BEAM CODING
WITH SPREAD SPECTRUM
ORTHOGONAL GOLD CODES
IN UNDERWATER ACOUSTIC SYSTEMS
A THESIS SUBMITTED TO
THE GRADUATE SCHOOL OF ENGINEERING AND SCIENCE OF BILKENT UNIVERSITY
IN PARTIAL FULFILLMENT OF THE REQUIREMENTS FOR THE DEGREE OF
MASTER OF SCIENCE IN
ELECTRICAL AND ELECTRONICS ENGINEERING
By
Andaç BEDER
October, 2015
ii
We certify that we have read this thesis and that in our opinion it is fully adequate, in scope and in quality, as a thesis for the degree of Master of Science.
_____________________________ Prof. Dr. Hayrettin Köymen (Advisor)
_____________________________ Prof. Dr. Ayhan Altıntaş
_____________________________ Asst. Prof. Satılmış Topçu
_____________________________ Dr. Tarık Reyhan
_____________________________ Asst. Prof. Arif Sanlı Ergün
Approved for the Graduate School of Engineering and Science:
_____________________________ Prof. Dr. Levent Onural Director of the Graduate School
iii
ABSTRACT
BEAM CODING WITH SPREAD SPECTRUM
ORTHOGONAL GOLD CODES IN UNDERWATER
ACOUSTIC SYSTEMS
Andaç BEDER
M.S in Electrical and Electronics Engineering Supervisor: Prof. Dr. Hayrettin Köymen
October, 2015
In this study, the applicability of beam coding approaches enabling coded transmission with direct sequence spread spectrum (DSSS) signals to multiple high resolution beams in underwater acoustic systems is investigated. Performance of (DSSS) signals for beam coding application is theoretically analyzed and experimentally proved. Instead of conventional (DSSS) parameters maximal length sequence and binary phase shift keying (BPSK) modulation, gold code sequences are more appropriate for multi-user applications due to their better cross-correlation function and minimum shift keying (MSK) modulation is more appropriate for constant amplitude signals due to its phase continuity. Beam coding experiments were carried out with 511 gold chips sequences with Minimum Shift Keying (MSK) modulation to spread over the frequency range of 70 - 90 kHz. The results of these experiments indicate that each coded signal can be separately detectable after signal processing in Matlab. And this shows that the beam coding approach is implementable in underwater acoustic systems.
Keywords: Beam Coding, Direct Sequence Spread Spectrum, Gold Code Sequence, Minimum Shift Keying.
iv
ÖZET
SUALTI AKUSTİK SİSTEMLERDE YAYILI İZGE
TEKNİĞİNİ KULLANARAK ORTOGONAL GOLD
KODLAR İLE HUZME KODLAMA
Andaç BEDER
Elektrik Elektronik Mühendisliği, Yüksek Lisans Tez Yöneticisi: Prof. Dr. Hayrettin Köymen
Ekim, 2015
Bu çalışmada, kodlu Doğrudan Dizili Yayılı İzge (DDYİ) sinyallerinin yüksek çözünürlüklü huzmelerden yayımı ile huzme kodlama yaklaşımının sualtı akustik sistemler için uygulanabilirliği incelenmektedir. Huzme kodlama uygulaması için DDYİ sinyallerinin başarımı teorik açıdan analiz edilmekte ve deneysel yöntemle doğrulanmaktadır. Klasik DDYİ sinyallerinde kullanılan maksimal uzunluk dizileri ve ikili faz kaydırmalı anahtarlama modülasyonu yerine daha iyi çapraz korelasyon fonksiyonuna sahip olduğu için çoklu kullanım uygulamalarına daha uygun Gold kod dizileri ve faz devamlılığına sahip sabit genlikli sinyaller için daha uygun minimum kaydırmalı anahtarlama modülasyonu kullanılmaktadır. Huzme kodlama deneyleri 511’lik Gold kod dizileri 70 – 90 kHz frekans bandına yayılan minimum kaydırmalı anahtarlama modülasyonu yapılarak gerçekleştirilmiştir. Deneylerin sonucu kodlu sinyallerine Matlab programı ile sinyal işleme uygulandıktan sonra kodlu sinyallerin ayrı ayrı tespit edilebildiğini göstermektedir. Bu da huzme kodlama yaklaşımının sualtı akustik sistemler için uygulanabilir olduğunu göstermektedir.
Anahtar sözcükler: Huzme Kodlama, Doğrudan Dizili Yayılı İzge, Gold Kod Dizileri, Minimum Kaydırmalı Anahtarlama.
v
Acknowledgements
I would like to express my deepest gratitude to my supervisor Prof. Dr. Hayrettin Köymen for his instructive comments, criticism, guidance and patience throughout my thesis studies. I would also like to express my thanks to the jury members Prof. Dr. Ayhan Altıntaş, Assist. Prof. Satılmış Topçu, Dr. Tarık Reyhan and Assoc. Prof. Arif Sanlı Ergün for evaluating my thesis.
Special thanks go to my mother, Bahtışen Tunçtürk, and my sister, Aylin Beder, for their prayers, endless love, understanding and trust not only for the duration of my thesis, but also throughout my life.
I am grateful to ASELSAN Inc. for supporting my thesis and providing me with resources and test facilities.
I would like to thank my friends and colleagues for their valuable help. Last but not the least; I would like to thank Dilara Kıvanç for her endless support throughout my thesis.
vi
Contents
1. INTRODUCTION ... 1
2. BEAM CODING WITH SPREAD SPECTRUM MODULATION ... 4
2.1 Introduction ... 4
2.2 History of Spread Spectrum ... 5
2.3 Notion of Direct Sequence Spread Spectrum Modulation... 6
2.4 Beam Coding with Direct Sequence Spread Spectrum Modulation ... 8
3. PSEUDORANDOM (PN) CODE SEQUENCE DESIGN ... 11
3.1 Introduction ... 11
3.2 Maximal Length Sequences ... 13
3.3 Gold Code Sequences ... 19
4. ALTERNATIVE MODULATION TECHNIQUE FOR PN CODES ... 24
4.1 Introduction ... 24
4.2 Conventional DSSS Modulation: Binary Phase Shift Keying (BPSK) .... 25
4.3 Alternative DSSS Modulation: Continuous Phase Frequency Shift Keying (CPFSK) ... 28
4.4 The Distortion Problems of Wideband DSSS Acoustic Signals ... 33
4.4.1 The Attenuation Loss Problem ... 34
vii
5. THE BEAM CODING EXPERIMENT ... 37
5.1 Introduction ... 37
5.2 The Experimental Factor of Yalıncak Lake ... 38
5.3 The Experimental Setup ... 39
5.4 The Experimental Result ... 42
5.5 The Experimental Discussion and Comparison ... 52
viii
List of Figures
Figure 2.1: Basic (DSSS) System Block Diagram ... 7
Figure 2.2: Beam Coding with (DSSS) Signals ... 10
Figure 3.1: m- stage linear shift register system ... 12
Figure 3.2: Generation of M-sequence Code Process ... 15
Figure 3.3: The Periodic Autocorrelation Function of M-sequence m=7 codes 16 Figure 3.4: The Periodic Autocorrelation Function of M-sequence m=511 codes ... 17
Figure 3.5: Periodic Cross-Correlation Function of G1(D) and G2(D):... 18
Figure 3.6: Generation of Gold Code Sequence Process ... 20
Figure 3.7: Periodic Autocorrelation Function of Gold Code4 and Gold Code7 ... ... 22
Figure 3.8: Periodic Cross-Correlation Function of Gold Code4 and Gold Code7 ... 22
Figure 3.9: Peak Cross-correlation of m-Sequences and Gold Code Sequences 23 Figure 4.1: (MSK) Modulated (DSSS) Signals with Code = [1 1 1 0 0 1 0] ... 26
Figure 4.2: (MSK) Modulated (DSSS) Signals with Code = [1 1 1 0 0 1 0] ... 26
Figure 4.3: Transmitted and Received (BPSK) Modulated (DSSS) Signals at the Lake Test ... 27
Figure 4.4: Inner Product Plot for T=0.05ms Signals ... 30
ix
Figure 4.6: (MSK) Modulated (DSSS) Signals with Code = [1 1 1 0 1 0 0] ... 33
Figure 5.1: Yalıncak Lake Underwater Noise Measurement ... 38
Figure 5.2: Beam Coding Experiment Setup ... 41
Figure 5.3: Binary ‘1’ and Binary ‘0’ Representation ... 42
Figure 5.4: Direct Path and Multipath of (DSSS) Signal ... 43
Figure 5.5: Time Domain and Frequency Domain Representations of (DSSS) Transmitted Signal ... 44
Figure 5.6: Time Domain and Frequency Domain Representations of (DSSS) Received Signal ... 45
Figure 5.7: The Matched Filter Output ... 45
Figure 5.8: Time Domain and Frequency Domain Representations of (DSSS) Transmitted Signal ... 46
Figure 5.9: Time Domain and Frequency Domain Representations of (DSSS) Received Signal ... 47
Figure 5.10: 1. Coded Beam: CODE1 Matched Filter Output ... 49
Figure 5.11: 2. Coded Beam: CODE2 Matched Filter Output ... 49
Figure 5.12: 4. Coded Beam: CODE4 Matched Filter Output ... 50
Figure 5.13: 5. Coded Beam: CODE5 Matched Filter Output ... 50
Figure 5.14: 6. Coded Beam: CODE6 Matched Filter Output ... 51
Figure 5.15: 7. Coded Beam: CODE7 Matched Filter Output ... 51
Figure 5.16: Comparison of (BPSK) and (MSK) Modulation Matched Filter Output ... 53
x
Figure 5.17: 1. Coded Beam: CODE1 Comparison of (BPSK) and (MSK)
Modulation ... 55 Figure 5.18: 2. Coded Beam: CODE2 Comparison of (BPSK) and (MSK)
Modulation ... 55 Figure 5.19: 4. Coded Beam: CODE4 Comparison of (BPSK) and (MSK)
Modulation ... 56 Figure 5.20: 5. Coded Beam: CODE5 Comparison of (BPSK) and (MSK)
Modulation ... 56 Figure 5.21: 6. Coded Beam: CODE6 Comparison of (BPSK) and (MSK)
Modulation ... 57 Figure 5.22: 7. Coded Beam: CODE7 Comparison of (BPSK) and (MSK)
1
Chapter 1
1. INTRODUCTION
Underwater acoustic ranging systems are called sonar systems as an abbreviated form for Sound Navigation And Ranging. The principle of most sonar systems is the detection of underwater acoustic waves. Unlike electromagnetic waves, the movement of acoustic waves is provided by mechanical vibrations in its propagation medium such as water [1]. Generation and reception of acoustic wave are carried out by electro acoustic antennas that convert electrical energy to acoustical energy or vice versa [2].
Sonar systems are divided into two common categories, which are passive sonar systems and active sonar systems. Passive sonar systems listen to the underwater environment only without sending any acoustic waves through the water. In active sonar systems, a transmitter antenna called a transducer sends acoustic waves to the surveillance region and a receiver antenna called a hydrophone receives reflected acoustic waves. The active sonar system concept will be used in this study, since coded acoustic signals will be transmitted, received and processed. The purpose is the transmission of coded signals to
2
different surveillance regions known as “beam coding” for multiple target detection and surveillance region enlargement.
Surveillance regions are called “beam” according to the radiation pattern of the transducers. Single element transducers provide omni directional transmission, which means radiation acoustic waves propagate uniformly all in a direction. Thus, beam coding application with single element transducers is not possible. It is necessary to use a transducer with high directivity, meaning a very narrow main beam to meet the requirement of the beam coding approach. Beam coding is the transmission of distinct coded signals to different beams thanks to the beam steering process. According to one or more coded signals reflected back from the targets, multiple target detections and locating are possible by help of travel time and steering angle information of the coded signals.
Coded signals can be generated by using spread spectrum modulation. This modulation enables the suppressing of the detrimental effects of interference, low probability of intercept and achieving message privacy. In addition to these advantages, spread spectrum modulation also allows for simultaneously multiple coded transmissions by sharing a common channel due to using orthogonal pseudorandom code sequences, which is known as code division multiple-access (CDMA). The beam coding approach shows the same characteristics with those of code division multiple access, since multiple coded sonar signals are simultaneously insonified to distinct beams called by different code sequences. This is known as multiple access phenomena. The beam coding application will be carried out by using the (CDMA) property of spread spectrum.
Some researches were conducted about spread spectrum modulation for underwater acoustic systems. In [3], direct sequence spread spectrum (DSSS) signals were used experimentally to carry out low power range estimation in underwater acoustic by using binary phase shift keying (BPSK) modulation and maximal-length sequence for pseudorandom code sequence. In [4], (DSSS) signals were also used theoretically to carry out covertness and environment friendliness in sonar systems by using binary phase keying (BPSK) modulation
3
and maximal-length sequence for pseudorandom code sequence. In [5, 6], frequency hopped spread spectrum signals were used theoretically to carry out a beam coding in underwater acoustic systems. In this study, (DSSS) signals will be used to carry out a beam coding application by using minimum shift keying (MSK) modulation with gold code sequences for coded beams.
This study consists of six main chapters and these are introduction, beam coding with spread spectrum modulation, pseudorandom code sequence design, alternative modulation technique for (DSSS), beam coding experiment and conclusion. In chapter 2, the means of beam coding application and information about spread spectrum modulation are discussed. In chapter 3, generation and selection of pseudorandom code sequence for (DSSS) signals are discussed. In chapter 4, the advantage of alternative modulation technique (MSK) for (DSSS) signals is analyzed. In chapter 5, the beam coding lake experiment results are shared and discussed in detail. Finally, conclusions obtained from the study are elucidated.
4
Chapter 2
2. BEAM CODING WITH SPREAD
SPECTRUM MODULATION
2.1 Introduction
Conventional modulation techniques of digital communication such as (AM), (PSK) and (FSK) have two major concerns: efficient uses of channel bandwidth and transmit power. However, in some situations, there are more significant requirements, such as covert and secure communication rather than the efficient use of channel bandwidth and transmit power. Spread spectrum modulation means the transmitted signal occupies a bandwidth much wider than the message signal bandwidth by use of pseudorandom codes. This modulation allows many users to share the same bandwidth, multipath (ISI) rejection, mitigation of jamming effects by hostiles and low probability of intercept by eavesdroppers. There are some conventional modulation techniques that occupy a bandwidth much wider than the message signal bandwidth such as frequency modulation types. However, these modulations are not accepted as spread spectrum
5
modulation. The reason for this is that they do not use pseudorandom codes in order to increase channel bandwidth of transmission.
Besides covert and secure communication, spread spectrum also provides resistance to the inter symbol interference (ISI) stemming from multi-path propagation [7] and multiple-access communication, in which several independent users share a common channel without an external synchronization mechanism [8]. Coded beams are not totally mutually orthogonal; hence beam coding approach benefits from resistance to the inter symbol interference property of the spread spectrum. Multiple coded signals are insonified simultaneously to multiple beams with their distinct specific code sequences; hence beam coding approach also benefits from multiple access phenomena of the spread spectrum.
Spread spectrum modulation based on the kind of spreading modulation is broadly categorized as
Direct sequence spread spectrum (DSSS) modulation Frequency hopping spread spectrum (FHSS) modulation Time hopping spread spectrum (THSS) modulation Hybrid spread spectrum modulation
The beam coding approach, the main subject of the current thesis, is carried out by using resistance to (ISI) and multiple-access communication properties of spread spectrum modulation and applying direct sequence spread spectrum (DSSS).
2.2 History of Spread Spectrum
The use of bandwidth was much wider than the information bandwidth in the early 1930s without the use of pseudorandom code sequences [9]. The use of real spread spectrum modulation with pseudorandom code sequences came with World War
6
2. Both the allies and axis countries conducted simple spread spectrum modulation experiments. The first spread spectrum idea for secure communication to guide torpedoes was suggested by Fritz Mandl who was conducting research in weapons control systems for Hitler. However, the first patent on spread spectrum modulation was secured by Hendy Lamarr, the ex-wife of Fritz Mandl, and George Antheil, a music composer, on 11th August 1942 [10]. They did not make any financial profit from this patent, as the patent details were a military secret for many years. Most of the research about spread spectrum modulation was conducted during the 1950s, 1960s and 1970s under military secrecy.
The first commercial use of spread spectrum modulation was applied with direct sequence spread spectrum for multiple access communications in the 1980s. Now, the global positioning system (GPS) is the world’s single largest system in which spread spectrum modulation is used [9] [10].
2.3 Notion of Direct Sequence Spread Spectrum
Modulation
Direct Sequence Spread Spectrum (DSSS) modulation is one of the spread spectrum techniques in which transmission band spreading is achieved by multiplication of information signal and a binary pseudorandom code sequence whose chip rate is many times higher than the information signal rate. Multiplication of two uncorrelated signals generates a signal whose frequency spectrum is the convolution of these two uncorrelated signals frequency spectrums [11]. Thus, the (DSSS) signal frequency spectrum is nearly the spectrum of the binary pseudorandom sequence. At the receiver side, received signal is multiplied by exactly the same binary pseudorandom sequences. This process is called de-spreading. In this study, the de-spreading process is applied
7
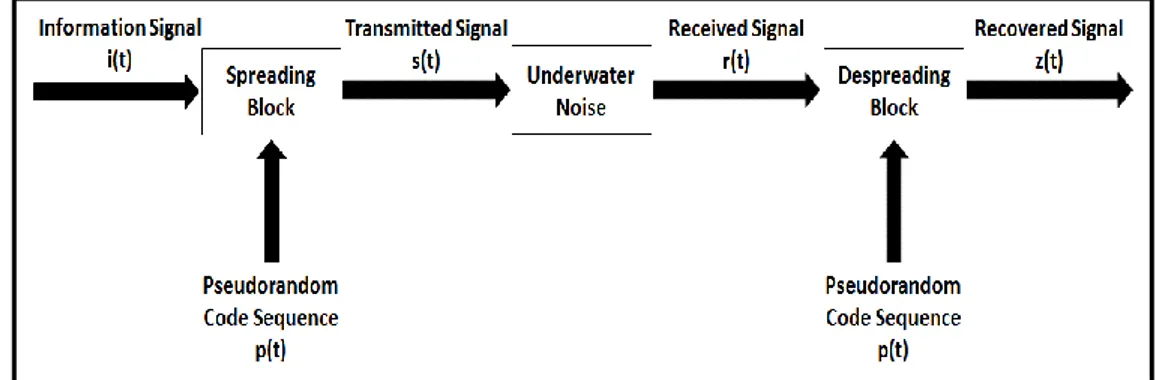
by matched filter under the assumption of Gaussian random underwater noise. The block diagram of a (DSSS) modulation system is described in Figure 2.1.
Figure 2.1: Basic (DSSS) System Block Diagram
Information signal can be only a carrier modulated signal and expressed as:
𝑖(𝑡) = cos(2𝜋𝑓𝑐𝑡 + 𝜃) Pseudorandom code sequence can be expressed as:
𝑝(𝑡) = ∑ 𝑃𝐴 × 𝑟𝑒𝑐𝑡 (𝑡 − 𝑖𝑇𝑐 𝑇𝑐 )
𝑁
𝑖=1
where 𝑁 is pseudorandom code sequence length and 𝑃𝐴 determines the amplitude of rectangular function either +1 or -1 in accordance with the rule of pseudorandom code sequence length. 𝑇𝐶 is time duration of each bit of code sequence; thus the duration of pseudorandom code sequence is 𝑁𝑇𝐶.
The transmitted signal is the carrier modulated direct sequence spread spectrum signal. It can be expressed as:
𝑠(𝑡) = 𝑖(𝑡) × 𝑝 (𝑡)
The received signal consists of attenuated (DSSS) signal and environmental noise can be expressed as:
8
𝑟(𝑡) = 𝑖(𝑡) × 𝑝 (𝑡) + 𝑛(𝑡)
The recovered signal consists of de-spreading information signal and spreading environment noise can be expressed as:
𝑧(𝑡) = [𝑖(𝑡) × 𝑝 (𝑡) + 𝑛(𝑡)] × 𝑝 (𝑡) 𝑧(𝑡) = 𝑖(𝑡) + 𝑛𝑠(𝑡)
where 𝑛𝑠(𝑡) is spread environmental noise whose power is spread over a wide frequency band. A small fraction of environmental noise that depends on processing gain can interfere with information signal.
Processing gain is the most crucial advantage of (DSSS) modulation as regards the non-spread spectrum modulations. In a (DSSS) signal, the binary pseudorandom sequence rate is called the chip rate and is denoted by 𝑊. The reciprocal of 𝑊 is called the chip duration and is denoted by 𝑇𝑐. The information signal bit rate is denoted by 𝑅. The reciprocal of 𝑅 is called the information signal duration and is denoted by 𝑇𝑏. The band spreading factor can be expressed as:
𝐵𝑒 = 𝑊 𝑅 =
𝑇𝑏 𝑇𝑐
where 𝑊 𝑅⁄ an integer is the ratio of (PN) code sequence bandwidth to the information bandwidth that is also called the processing gain.
2.4 Beam Coding with Direct Sequence Spread
Spectrum Modulation
The response of electro-acoustic antennas can vary according to direction which is called a beam pattern of antennas [12]. These spatial variations depend on the operational frequency, shape and size of electro-acoustic antennas. A beam pattern of the antenna can consist of the main beam, side lobes and grating lobes.
9
The main beam characterized by an aperture of -3 dB at maximum is called a “beam” in this study.
Some signal parameters such as transmission frequency and signal duration determine the individual characteristics of acoustic signals. However, these parameters are not adequate in transmitting different acoustic signals to distinct beams due to the operational requirements and limitation of electro-acoustic antenna. Acoustic signals can be modulated with independent code sequences and transmitted to distinct beams, which is called “beam coding”.
The performance improvement obtained from a (DSSS) signal is thanks to the processing gain. Processing gain enables the sharing of the same channel bandwidth with many (DSSS) signals. (DSSS) signals are separable from each other by means of their own pseudorandom code sequence. This capability provides simultaneous transmission of more than one (DSSS) signal over the same channel bandwidth. Each (DSSS) signal can be orientated to different beams by electronic beam steering. Beam steering changes the direction of the acoustic wave to a specific location by altering the relative phase of array elements. As a result, distinct (DSSS) signals are simultaneously assigned to each beam.
The beam can be formed in any direction via the electrically appropriate amount delaying the signal to each element of transducer array, which is called beam steering. Active sonar systems can apply beam steering by using conventional acoustic signals in order to cover the whole coverage area. However, there is a need for round trip times so as to cover the whole coverage area for monostatic systems. During these round trip times, the array must not be steered otherwise some targets are missed. This round trip time which is related with maximum detection range (𝑅𝑚) and velocity of sound (𝑐) is equal to 2𝑅𝑚⁄ . 𝑐 There is also a need for (𝛽 𝛼⁄ ) acoustic signals to complete the whole coverage area where 𝛽 is the surveillance region coverage area angle and 𝛼 is the beamwidth angle. Hence, the time to cover the complete coverage area is equal to 2𝑅𝑚⁄ × 𝛽 𝛼𝑐 ⁄ . For instance, an active sonar system has a maximum range of 1.5 km and has a surveillance region coverage area angle of 15° with a 1.5°
10
beamwidth. The time to cover the complete coverage area will be 2𝑥1500 1500⁄ 𝑥 15/1.5 = 20 seconds. This delay is significantly high in an active sonar system if the target is moving. Regardless of the round trip delay of beam steering, beam coding is recommended so as to scan the whole coverage area simultaneously.
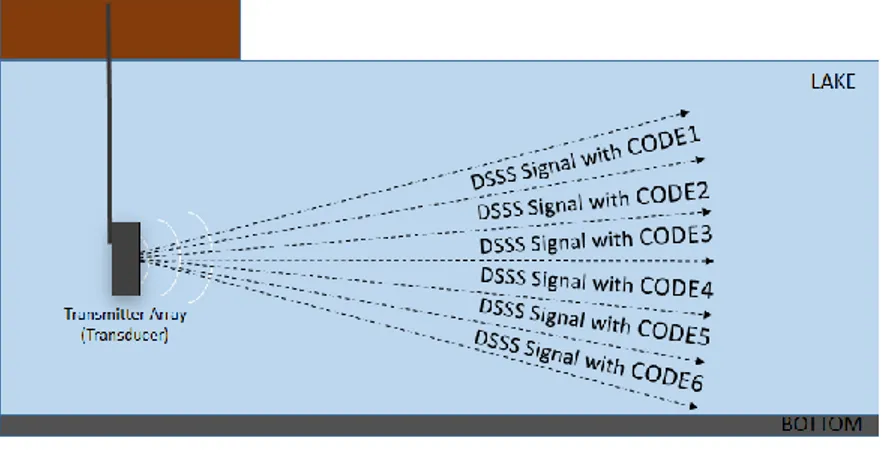
By using the beam coding application, the coverage area of an active sonar system can be increased without the need for more channel bandwidth or time. Beam coding with (DSSS) signals can be applicable as illustrated in Figure 2.2.
Figure 2.2: Beam Coding with (DSSS) Signals
In Figure 2.2, 6 different beams are coded with 6 distinct (DSSS) signals. The number of coded beams might change in accordance with the operational requirements. However, each (DSSS) signal appears as additive interference for other (DSSS) signals. The level of interference depends on mutual orthogonality (PN) code sequences and the number of coded beams. There is a need to determine the usable maximum number of coded beams in accordance with orthogonality of (PN) code sequences, since (PN) code sequences are not totally orthogonal in practice, even if it is assumed that they are mutually orthogonal. The selection of good mutual orthogonal (PN) code sequences, which is a crucial problem for beam coding application, will be discussed in the following chapter.
11
Chapter 3
3. PSEUDORANDOM (PN) CODE
SEQUENCE DESIGN
3.1 Introduction
The generation of pseudorandom (PN) code sequence is fundamental in direct sequence spread spectrum (DSSS) applications, as (DSSS) technique consists of multiplying the input data by a (PN) code sequence whose bit rate is much higher than the input bit rate. The result is wideband and noise like waveform.
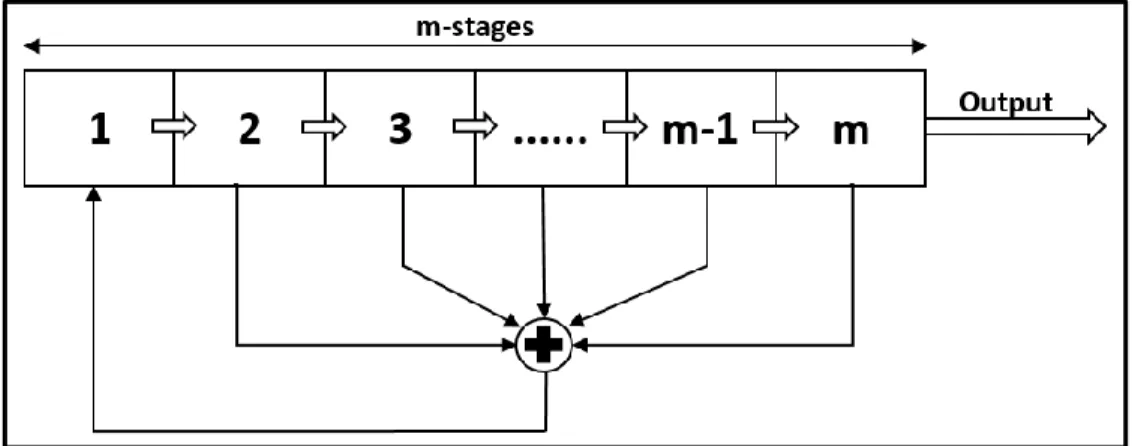
(PN) sequences are deterministic and periodic, not totally random. The generation of (PN) code sequence is performed by the outputs of linear feedback shift register systems. The linear feedback shift register system consists of consecutive two-state memory blocks (shift registers) and feedback logic blocks (exclusive OR logic). The m-stage linear shift register system is illustrated in Figure 3.1. Binary sequences in memory are shifted through the next shift registers. The new binary content of the first register is determined by a logical combination of some other shift registers.
12
Figure 3.1: m- stage linear shift register system
For multiple user applications of the (DSSS) technique, the cross-correlation and autocross-correlation properties of the (PN) sequence are significant. Each user should be assigned a particular (PN) sequence that should be mutually orthogonal with other (PN) sequences to reduce the level of interference among users. However, some level of interference among (PN) sequences is experienced in practice. Thus, the autocorrelation function of (PN) sequence should have a relatively high peak. That is, the peak-off value of the autocorrelation function should be much smaller than the peak value of the autocorrelation function. The cross-correlation function of (PN) sequences should be relatively small, ideally zero.
In the (DSSS) applications, the binary polar sequence elements {‘0’ and ‘1’} are mapped onto corresponding bipolar sequences elements {‘-1’ and ‘1’}. Because the multiplication of the input data with a pseudorandom code sequence, the ‘0’ element results in energy loss in the input data. Therefore, it is bipolar sequences that are applied, rather than polar elements.
In this section, the generation of maximal length sequences and gold sequences will be briefly explained while also discussing their cross-correlation and autocorrelation properties.
13
3.2 Maximal Length Sequences
The most common (PN) sequences are the maximal length sequences (m-sequence) for (DSSS) applications. M-sequences are the largest code sequences that can be generated by a linear shift register system. The m-sequence includes m=2n-1 codes where “n” is the number of shift registers in the linear shift register system.
The linear shift register system function G(D) for m-sequences generation has to be a primitive polynomial. The primitive polynomials are special polynomials that are not the products of any lower degree two polynomials. The primitive polynomials also divide DM+1 in module-2 domain. The reciprocal polynomial of any primitive polynomial is also a primitive polynomial. The reciprocal polynomial of G(D) is
Gr(D) =Dn.G(1/D)
The number of distinct m-sequences depends only on the number of distinct primitive polynomials for any linear shift register system. The number of primitive polynomials of degree “n” where “n” is the number of shift register is equal to Np = 2 𝑛−1 𝑛 ∏ 𝑃𝑖−1 𝑃𝑖 𝑘 𝑖=1
where 𝑃𝑖 {i=1, 2, ……. k} is the prime factor of 2𝑛 − 1.
For instance, in an n=3 linear shift register system, the prime factor of 23− 1 is only 7. Thus, the number of primitive polynomials of such a system is
Np = (2
3−1
3 )( 7−1
7 ) =2
The primitive polynomials of such a system are as follows: D7+1 = (D+1). (D3+D+1).(D3+D2+1) in module-2 domain.
14
Primitive polynomials: G1(D) = (D3+D2+1) and G2(D) = (D3+D+1)
There are 2 primitive polynomials for a linear shift register system that consists of 3 shift registers. It can also be easily calculated to indicate that G1 (D)
is a reciprocal polynomial of G2 (D) or vice versa.
G2r(D) = D3 (D-3 +D-1+1)
G2r(D) = 1+ D2 + D3 = G1(D)
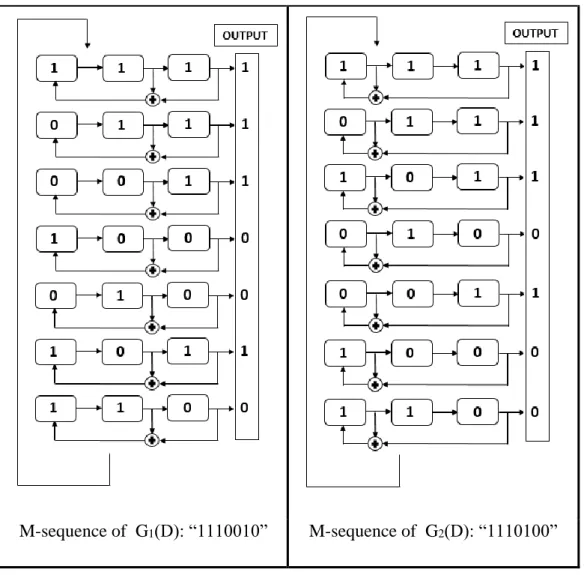
The generation of m-sequence code process for G1(D) and G2(D) is
illustrated in Figure 3.2.
In Figure 3.2, the initial states of shift registers are ‘1’ ‘1’ and ‘1’. Each linear shift register system whose function is a primitive polynomial can generate only one m-sequence code, regardless of the initial state of shift registers. The generation of m-sequence code process is cyclic, as the initial state change of shift registers results in generating phase shifted replica of either of the originals.
For a more complex linear shift register system, it is difficult to find primitive polynomials. The tables of primitive polynomials have been generated for quick reference. The tables of primitive polynomials may be found in [16] [17].
15
M-sequence of G1(D): “1110010” M-sequence of G2(D): “1110100”
Figure 3.2: Generation of M-sequence Code Process
The striking characteristic of the m-sequence code is its periodic autocorrelation function, due to the periodicity of m-sequences.
In the ideal case, the autocorrelation function of PN sequences is 𝑅(𝑗) = {𝑚, 𝑗 = 0
0, 1 ≤ 𝑗 ≤ 𝑛 − 1
The periodic autocorrelation function of m-sequences is, 𝑅(𝑗) = { 𝑚, 𝑗 = 0
16
However, autocorrelation function of long m-sequence is,
𝑅(𝑗) = { 𝑚, 𝑗 = 0 lim 𝑚→∞ ( −1 𝑚 ) = 0 , 1 ≤ 𝑗 ≤ 𝑛 − 1
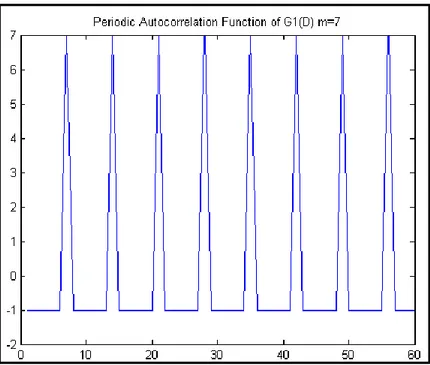
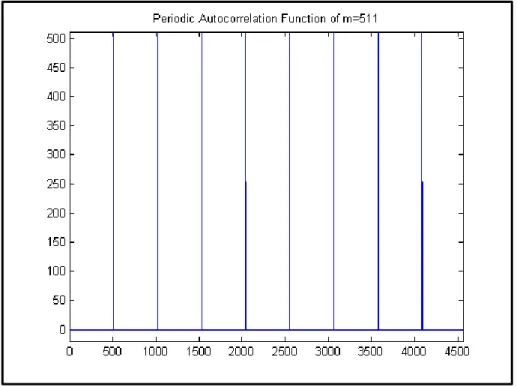
Thus, the m-sequence code becomes an almost ideal sequence in terms of its autocorrelation. In Figure 3.3, the periodic autocorrelation function of an m-sequence consisting of 7 codes is plotted. As expected, the peak value in the plot is 7 and the peak-off value in the plot is only -1. In Figure 3.4, the periodic autocorrelation function of an m-sequence consisting of 511 codes is plotted. As expected, the peak value in the plot is 511. However, the other value seems to be zero, even if the peak-off value in the plot is also -1.
17
Figure 3.4: The Periodic Autocorrelation Function of M-sequence m=511 codes
For beam coding applications, the cross-correlation characteristic of (PN) sequences are as important as the autocorrelation characteristic of (PN) sequences. This is because each beam is assigned as a particular sequence code that should be ideally mutually orthogonal in order to minimize interference among the beams. The cross-correlation characteristic of m-sequences is also a periodic function. However, the peak-off values of cross-correlation can have relatively large peaks. Hence, m-sequences are not appropriate code sequences for beam coding applications.
18
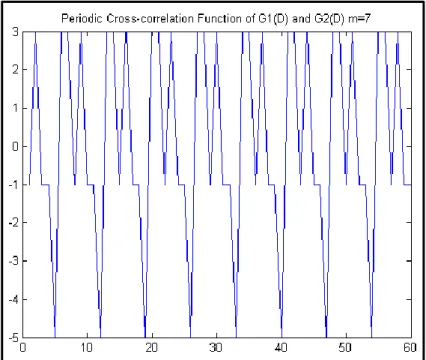
Figure 3.5: Periodic Cross-Correlation Function of G1(D) and G2(D):
In Figure 3.5, the periodic cross-correlation function of m-sequences G1(D) and G2(D) that consist of 7 codes is plotted. The absolute peak value in the
plot is five (5). The peak value of m-sequence cross-correlation function in Figure 3.5 is relatively high with respect to the peak value of m-sequence autocorrelation function: seven (7). This means that, if m-sequence consisting of 7 codes is applied for beam coding, the level of interference can be 71%. The interference percentage relatively decreases by increasing the length of the m-sequence code. However, the interference percentage does not drop below 10% until m = 8191.
19
3.3 Gold Code Sequences
Gold code sequences have smaller cross-correlation peak values and larger code sequences domains than m-sequences. These two advantages of gold code sequences make more desirable code sequences for beam coding applications.
Gold code sequences are derived from a combination of two specific m-sequences which are called preferred m-sequences. These two m-m-sequences of length m=2n-1 indicate periodic cross-correlation functions with three values, which are {-1, -t(n), t(n)-2} where;
𝑡(𝑛) = {2(𝑛+1) 2
⁄ + 1, 𝑜𝑑𝑑 𝑛
2(𝑛+2) 2⁄ + 1, 𝑒𝑣𝑒𝑛 𝑛
The generation of gold sequence processes is as follows:
1. Finding a preferred pair of m-sequences of G1(D) and G2(D).
2. Taking the sum of G2(D) and G1(D) in the module-2 domain or
vice versa.
3. Taking the sum of G2(D) and one code shifted version of G1(D).
4. Making the same summation until m=2n-1 shifted version of G2(D).
5. Giving m new periodic sequences.
6. Including original sequences G1(D) and G2(D), “m+2” sequences.
These “m+2” sequences are called gold sequences. For instance, m-sequences of G1(D) and G2(D) are preferred m-sequences. They were generated
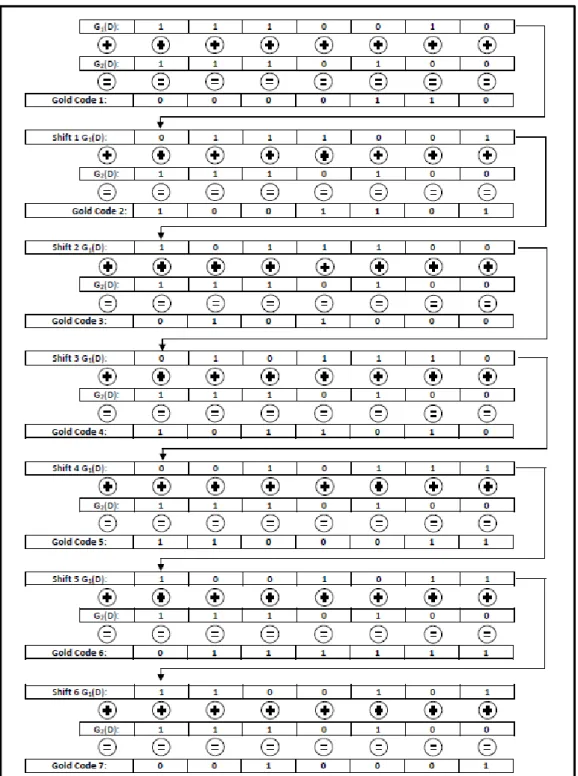
in the previous section (Maximal Length Sequence) and were shown in Figure 3.2. The generation of gold code sequences process by using m-sequences of G1(D) and G2(D) is illustrated in Figure 3.6.
20
21
According to Figure 3.6, nine gold code sequences containing seven new gold code sequences and two preferred maximal length sequences are generated by using two preferred maximal length sequences where m=7. The set of gold code sequences generated by maximal length sequences G1(D) and G2(D) are as
follows:
1. Preferred Maximal Length Sequence 1 G1(D): “1110010”
2. Preferred Maximal Length Sequence 2 G2(D): “1110100”
3. Gold Code 1: “0000110” 4. Gold Code 2: “1001101” 5. Gold Code 3: “0101000” 6. Gold Code 4: “1011010” 7. Gold Code 5: “1100011” 8. Gold Code 6: “0111111” 9. Gold Code 7: “0010001”
Autocorrelation functions of gold code sequences are also periodic due to the periodicity of gold code. Nonetheless, their autocorrelation functions are not as good as the autocorrelation function of m-sequences; since the peak-off value is not only -1, as seen in Figure 3.7. The peak-off values of gold code 4 are 3 and -5. The peak-off values of gold code 7 are 3 and -1. This autocorrelation function randomness decreases the performance of matched filter at the receiver.
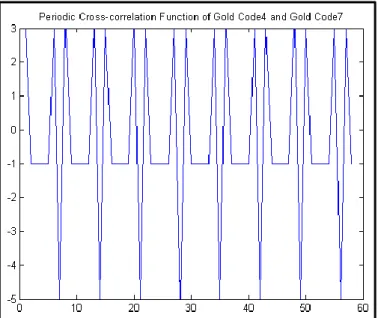
In Figure 3.8, the periodic cross-correlation function of gold code 4 and gold code 7 is plotted. As was explained before, their cross-correlation function consists of -1, -t(n) and t(n)-2 values, where 𝑡(𝑛) = 2(3+1) 2⁄ + 1 = 5.
22
Figure 3.7: Periodic Autocorrelation Function of Gold Code4 and Gold Code7
Figure 3.8: Periodic Cross-Correlation Function of Gold Code4 and Gold Code7
The peak value of gold code cross-correlation in Figure 3.8 is the same with the peak value of m-sequence cross-correlation in Figure 3.5. This means that cross-correlation of gold code for m=7 is not better than cross-correlation of m-sequence for m=7. Nevertheless, gold code sequences offer better
cross-23
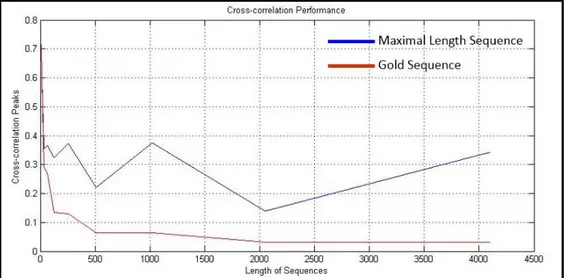
correlation properties than m-sequences for longer code sequences. Peak cross-correlation values of m-sequences and gold code sequences are plotted in Figure 3.9 with respect to code length. The peak cross-correlation values of m-sequences decrease slowly by increasing the length of binary code in sequence and the level of inference decreases more than 20% for m=511. On the other hand, the peak cross-correlation values of gold code sequences decrease constantly by increasing the length of binary code in sequence and the level of inference decreases less than 10% for m=511. Thus, gold code sequences are more suitable for beam coding application than m-sequences, especially for long code sequences thanks to better cross-correlation properties and larger number of code sequence sets.
Figure 3.9: Peak Cross-correlation of m-Sequences and Gold Code Sequences
It was previously mentioned that gold code sequences are not totally perfect PN sequences due to their autocorrelation randomness characteristic. For this reason, there arises a need for more research on the generation of PN sequences that have better autocorrelation and cross correlation functions than m-sequences and gold code m-sequences. In addition to the well-known m-m-sequences and gold code sequences, the Walsh-Hadamard and Kasami code sequences are also mentioned for direct sequence spread spectrum application in literature.
24
Chapter 4
4. ALTERNATIVE MODULATION
TECHNIQUE FOR PN CODES
4.1 Introduction
Orthogonal (PN) code sequences should be modulated with a type of modulation such as amplitude modulation (AM), phase shift keying (PSK) or frequency shift keying (FSK). (PSK) is more practical in (DSSS) applications in spite of its certain disadvantages. In this chapter, binary phase shift keying (BPSK) in (DSSS) application will be briefly described and its disadvantages will be examined. Then, alternative minimum shift keying (MSK) in (DSSS) applications will be elaborated.
25
4.2 Conventional DSSS Modulation: Binary Phase
Shift Keying (BPSK)
In literature, the most widely known and used modulation technique is Binary Phase Shift Keying (BPSK) modulation for binary case (DSSS) signals. In this modulation, the transmitted information is conveyed by phase of the carrier signal. In (BPSK), binary signals can be represented as follows:
s(t) = cos(2πfct + π(m − 1)) m = 1, 2 (4.1)
𝑠(𝑡) = { cos(2πfct) for binary ′1′
−cos(2πfct) for binary ′0′ (4.2) As can be seen in Equation (4.2), the (BPSK) modulation is straightforward. The binary ‘1’ is represented by the cosines function and the binary ‘0’ is represented by 180° phase shift of the cosines function. Eventually, (BPSK) modulated (DSSS) signal is equivalent to the multiplication of the continuous wave signal and the (PN) binary code sequence. The duration of each code in the (PN) binary code sequence is 𝑇, while its amplitude is either 1 or -1 depending on the polarity of the code.
Two different (BPSK) modulated (DSSS) signals are plotted in Figure 4.1 and 4.2. These (BPSK) modulated signals’ carrier frequencies 𝑓𝑐 are 80 𝑘𝐻𝑧 and
their chips duration is 𝑇 = 12.5 μs. Therefore, the null-to-null bandwidth of Binary Phase Shift Keying is 2
26
Figure 4.1: (MSK) Modulated (DSSS) Signals with Code = [1 1 1 0 0 1 0]
27
It is seen in Figure 4.1 and 4.2 that there are jumps in the waveform of (BPSK) modulated (DSSS) signals in time domain. These jumps result in energy of signal scattering out of channel band due to the discontinuity of phase. Because of the loss of signal energy, the detection performance of receiver side processing is reduced.
Besides the theoretical energy scattering problem of BPSK modulation, using (BPSK) modulated (DSSS) signals leads to an operational problem for an underwater acoustic transducer. This problem is known as “spike problem” due to the phase discontinuity between binary ‘1’ and binary ‘0’ code transition or vice versa. Each phase jumping in waveform generates spike waveforms. These spikes were firstly observed from the measurement of receiver hydrophone data at the Lake Test. The measurement of receiver hydrophone data is plotted in Figure 4.3.
Figure 4.3: Transmitted and Received (BPSK) Modulated (DSSS) Signals at the Lake Test
28
As seen in Figure 4.3, phase discontinuity can be observed at 0.4, 0.45 and 0.65 ms in the transmitted (BPSK) modulated (DSSS) signal plot. In response to this, there appear spikes at the 0.4, 0.45 and 0.65 ms in the received (BPSK) modulated (DSSS) signal plot. These spikes were observed for all (BPSK) modulated (DSSS) signals at the Lake Test results. The main reason for the appearance of these spikes can be the mechanical capability of the acoustic transducer. The acoustic transducer does not give a real time response as fast as each phase shifting in waveform does.
Alternative modulation techniques such as Gaussian Phase Shift Keying [3] can be suggested for (DSSS) applications in order to prevent the signal energy scattering to other bands and eliminating the spike problem. However, applying Gaussian filter on modulated signal results in non-constant amplitude signal transmission, which reduces the covertness performance of the (DSSS) signal. Thus, continuous phase modulation techniques can be an alternative modulation for (DSSS) signals. These modulations may enable constant amplitude signal transmission, the prevention of the signal energy loss and spike problem.
4.3 Alternative DSSS Modulation: Continuous
Phase Frequency Shift Keying (CPFSK)
The conventional modulation is Binary Phase Shift Keying (BPSK) for binary case (DSSS) signals, but (BPSK) modulation has side effects due to phase discontinuity. Hence, Continuous Phase Frequency Shift Keying (CPFSK) modulation can be suggested as an alternative modulation for (DSSS) signals. (CPFSK) signal is generally defined as follows:
𝑠(𝑡) = cos[2𝜋𝑓𝑐𝑡 + 𝜃(𝑡)] (4.3) where 𝜃(𝑡) is the phase of 𝑠(𝑡). The phase of the signal is a continuous function of time by definition of (CPFSK). According to binary code sequence, phase of
29
signal linearly increases or decreases in the course of the binary code duration. The phase of signal 𝜃(𝑡) is defined as follows:
𝜃(𝑡) = 𝜃(0) ±𝜋ℎ
𝑇 𝑡 for 0 ≤ t ≤ T (4.4)
where 𝑇 is the bit duration and h dimensionless parameter is called the deviation ratio. Phase of signal 𝑠(𝑡) increases linearly by help of the plus sign, which corresponds to binary code ‘1’, and decreases linearly by the help of the minus sign, which corresponds to binary code ‘0’. Due to the plus and minus signs in phase definition, binary code ‘1’ and binary code ‘0’ can be represented by different frequencies that are defined as follows:
Frequency of Binary Code ‘1’: 𝑓1 = 𝑓𝑐+ ℎ
2𝑇 (4.5)
Frequency of Binary Code ‘0’: 𝑓2 = 𝑓𝑐 − ℎ
2𝑇 (4.6)
There are two results of these relations. The first one is the carrier frequency 𝑓𝑐, which is the arithmetic mean of the 𝑓1 and 𝑓2. And the second one is the h deviation ratio which is the difference of the 𝑓1 and 𝑓2 normalized with respect to bit rate [18].
The carrier frequency: 𝑓𝑐 = 1
2(𝑓1+ 𝑓2) (4.7)
The deviation ratio: ℎ = 𝑇(𝑓1− 𝑓2) (4.8) The special case of (CPFSK) is Minimum Shift Keying (MSK) in which the deviation ratio h is assigned to 1 2⁄ . Due to h = 1/2 and Equation 4.8, the frequency difference between the frequency of binary code ‘1’ 𝑓1 and frequency of binary code ‘0’ 𝑓2 is 1/2𝑇. This difference is the minimum frequency separation that is necessary to ensure the orthogonality of signals over bit duration 𝑇, since the inner product of two orthogonal signals has to be zero.
Re[< s1s2 >] = 𝑅𝑒 [ ∫ s1s2∗ dt T
30 Re[< s1s2 >] = 𝑅𝑒 [∫ ej2π(f1−f2)tdt T 0 ] Re[< s1s2 >] = Re [T sin(π(f1− f2)T) π(f1− f2)T e jπ(f1−f2)T] Re[< s1s2 >] = Tsinc(2T(f1− f2)) (4.10) According to (4.10), if 𝑠𝑖𝑛𝑐(2𝑇(𝑓1− 𝑓2)) = 0, then 𝑠1 and 𝑠2 are orthogonal signals. This is possible if and only if the frequency difference of 𝑠1 and 𝑠2 signals equals to 𝑘/2𝑇 in which 𝑘 is a positive integer. Thus, the minimum frequency separation is 1/2𝑇 when 𝑘 = 1. This explains why (CPBSK) with h = 1/2 is called (MSK) [8].
31
In order to generate a (MSK) signal s(t), in-phase and quadrature component of the (MSK) signal should be expressed by applying trigonometric identities on Equation (4.3) as follows:
s(t) = cos[θ(t)] cos(2πfct) − sin[θ(t)] sin(2πfct) In-phase component: SI(t) = cos[θ(t)] Quadrature component: SQ(t) = sin[θ(t)]
The in-phase and quadrature component can be expressed by using Equation (4.4) as follows:
In-phase component: SI(t) = cos [θ(0) ± 𝜋
2𝑇𝑡]
SI(t) = cos[θ(0)] cos (𝜋
2𝑇𝑡) ± sin[θ(0)] sin [ 𝜋
2𝑇𝑡] (4.11)
Quadrature component: SQ(t) = sin [θ(0) ± 𝜋 2𝑇𝑡] SQ(t) = cos[θ(0)] sin [𝜋 2𝑇𝑡] ± sin[θ(0)] cos ( 𝜋 2𝑇𝑡) (4.12)
As was explained before, phase component θ(t) of a (MSK) signal increases or decreases in terms of the binary value in which phase of (MSK) signal increases π
2 by binary ‘1’ and decreases π
2 by binary ‘0’. The effect of the binary
value can also be observed in Equations (4.11) and (4.12). The plus sign in Equation (4.11) corresponds to binary ‘0’ and the minus sign in Equation (4.11) corresponds to binary ‘1’. On the other hand, the plus sign in Equation (4.12) corresponds to binary ‘1’ and the minus sign in Equation (4.12) corresponds to binary ‘0’ [18]. By the help of these derivations, (MSK) modulated (DSSS) signals are plotted in Figure 4.5 and 4.6. These (MSK) signals carrier frequencies 𝑓𝑐 are 20 𝑘𝐻𝑧 and their chips duration is 𝑇 = 50 𝜇𝑠. Therefore, the binary ‘1’ code represents 𝑓1 = 25 𝑘𝐻𝑧 and the binary ‘0’ code represents 𝑓2 = 35 𝑘𝐻𝑧. For a linear modulation such as (BPSK,) the null-to-null frequency band spread is 2
32
40 𝑘𝐻𝑧. However, the frequency band spreads of (MSK) signals are higher than
2
𝑇= 40 𝑘𝐻𝑧 because of the nonlinearity of (MSK) modulation. The null-to-null
frequency band spread of MSK signals are approximately 30 𝑘𝐻𝑧 in Figure 4.5 and Figure 4.6.
As seen in Figure 4.5 and Figure 4.6, there are no jumps in the waveform of the (MSK) signal due to continuity of phase. This continuity prevents signal energy to spread to other bands whichprovides a higher signal to noise ratio at the receiver side.
33
Figure 4.6: (MSK) Modulated (DSSS) Signals with Code = [1 1 1 0 1 0 0]
4.4 The Distortion Problems of Wideband DSSS
Acoustic Signals
Wideband DSSS signals’ both magnitude and phase response with respect to their frequency range play an important role in the beam coding application, as beam coding benefits from high autocorrelation performance of transmitted and received DSSS signals. Nonlinear magnitude and/or phase response results in distortion on wave shape of DSSS signals. Due to these magnitude and/or phase distortion of DSSS signals, the beam coding performance is reduced. In this study, the attenuation loss problem related to nonlinear magnitude response and the group delay distortion problem related to nonlinear phase response are worked on. However, no equalizer was implemented in order to correct these distortions, since the aim of this study is the proving of the beam coding concept.
34
4.4.1 The Attenuation Loss Problem
Attenuation loss is one effect of a variety of propagation phenomena in the sea. Sea water dissipative propagation medium for acoustic signals converts the acoustic signal energy into heat energy due to effects of absorption, leakage out of channel and scattering. In this study, absorption loss is a significant loss phenomenon, since it strongly depends on the frequency variation of acoustic signals.
Absorption loss (γ) results in the exponential decrease of acoustic signal energy and is expressed in dB unit. Absorption coefficient (α) results in the linear decrease of acoustic signal energy and is expressed in dB/km unit. The relation between absorption coefficient (α) and absorption loss (γ) is as follows [19]:
α = 20γ log 𝑒 ≈ 8.686γ
The absorption of sound in seawater is caused by two factors which are viscosity and ionic relaxation chemical reactions. There are two kinds of viscosity; namely, shear and volume viscosity. Also, there are two kinds of ionic relaxation: magnesium sulfate and boric acid molecules relaxation. The dominant factor of absorption loss is ionic relaxation at the 70-90 kHz frequency band, which is the frequency band of this study. The Fischer-Simmons absorption coefficient expression is as follows [12]:
α = 𝐴1𝑃1( 𝑓2 𝑓12+ 𝑓2) 𝑓1+ 𝐴2𝑃2( 𝑓2 𝑓22+ 𝑓2) 𝑓2+ 𝐴3𝑃3𝑓 2
where 𝐴1, 𝐴2, 𝐴3, 𝑓1 and 𝑓2 are complicated temperature dependent functions. 𝑃1 represents the effects of boric acid with function of pressure. 𝑃2 represents the
effects of magnesium sulfate with function of pressure. 𝑃3 represents the effects of viscosity with function of pressure. The simpler form of absorption coefficient expression is as follows [12]:
35 α = (0.1𝑓 2 1 + 𝑓2) + ( 40𝑓2 4100 + 𝑓2) + 2.75x10⁻⁴𝑓2+ 0.003
The absorption loss increases rapidly with frequency and the order of magnitude is highly variable [19]. At 70 kHz, the absorption loss coefficient will be approximately 23 (dB/kyd) and at 90 kHz, the absorption loss coefficient will be approximately 29 (dB/kyd). This means that the 70 kHz signal components’ amplitude will be twice as high as that of the 90 kHz signal components’ amplitude in linear scale due to the absorption loss.
In this study, the DSSS signals energy is spread to the 70-90 kHz frequency band. This means that the DSSS signals components are variously affected by the absorption loss. The amplitude of the DSSS signals are distorted due to the absorption loss coefficient high difference between the 70 kHz signal components and the 90 kHz signal components. Hence, the amplitude distortion results in beam coding performance reduction.
The magnitude distortion equalizer can be employed in order to annihilate the absorption loss problem on the DSSS signals for beam coding applications. However, the aim of this study is the proof of the beam coding concept; thus the magnitude distortion equalizer was not employed so as to observe the worst case performance of the beam coding application.
4.4.2 The Group Delay Distortion Problem
Group delay distortion is one effect of a variety of phase responses in the overall underwater acoustic system. Group delay (𝜏) is defined as the time delay variation on modulated sinusoidal acoustic signal, expressed by phase response differentiating with respect to frequency, and is shown as follows:
𝜏 =𝑑 𝜙(𝑤) 𝑑𝑤 = − 1 2𝜋 𝑑 𝜙(𝑓) 𝑑𝑓
36
where 𝜙(𝑤) function of angular frequency (𝑤) is phase response of signal. If the phase response of signal is linear function at operating frequency range, group delay will be constant at operating frequency range. This preserves the modulated acoustic signal wave shape and eliminates the group delay distortion problem.
The distortion of received signal in an underwater acoustic system is caused by any device within the whole system. Hence, the transfer function knowledge of all devices is required in order to diminish group delay distortion. However, it is difficult to determine transfer functions of some devices such as the transfer function of underwater medium. On the other hand, the transfer functions of some devices such as electroacoustic antennas can be measured so as to minimize group delay distortion.
In this study, the phase response of electroacoustic antennas are significant for beam coding that includes various frequency components at the 70-90 kHz frequency band. The phase response transducer and hydrophone are not available. However, it is known that the phase response linearity of electroacoustic antennas are better at off resonance frequencies. In beam coding experiments, electroacoustic antennas were used at off resonance frequencies. Also, the group delay distortion equalizer was not employed so as to observe the worst case performance of the beam coding application; since the aim of this study is the proof of beam coding concept.
37
Chapter 5
5. THE
BEAM
CODING
EXPERIMENT
5.1 Introduction
The aim of the experiment indicates that beam coding is performed by coded beams by sharing the same bandwidth possible with help of the (DSSS) modulation’s multiple access property. To accomplish this aim, several experiments were conducted in Lake Environment. Firstly, a coded (DSSS) signal was transmitted throughout a beam in order to measure the matched filter performance of one coded beam. Secondly, the summation of seven coded (DSSS) signals was transmitted throughout a beam in order to measure interference performance of (DSSS) signals under underwater environmental conditions.
In the previous chapters, we discussed orthogonal code design and the selection of the modulation technique for orthogonal code sequences, which are critical parameters for (DSSS) modulation. In light of these discussions, (DSSS)
38
signal parameters are decided as 511 chips gold code sequences and (MSK) modulation for beam coding experiments.
In this chapter, the experimental factor of Yalıncak Lake, the experimental setup and the experimental methodology are briefly introduced. The experimental results are shared, visualized and discussed in detail.
5.2 The
Experimental Factor of Yalıncak Lake
Beam coding experiments were conducted at Aselsan Inc. underwater acoustic research and measurements of Yalıncak Lake platform which is in the Middle East Technical University Campus. Environmental factors are mostly a crucial part of underwater acoustic experiments. The performance of experiments can degrade because of many different noise sources. For this reason, before beginning the experiments, the noise level of Yalıncak Lake was measured and recorded by hydrophone without any transmission. The noise level of Yalıncak Lake underwater environment is under 2 mV, as illustrated in Figure 5.1.39
Noise sources of underwater environment can be grouped under four categories, which are ambient noise, self-noise, reverberation and acoustic interference [19]. Ambient noise originates from natural and man-made activities such as wind, wave, rain, animals and shipping. These are independent of sonar systems. Self-noise is directly related with acoustic systems that can suffer from their own electronic thermal noise. Reverberation originates from undesired echoes of sonar signal that can mask desired echo of sonar signal. Acoustic interference originates from other acoustic sources in the underwater environment that can interfere with the signal channel.
During the experimental measurements, there was possibly some ambient noise due to natural activities, but there was no man-made ambient noise. Self-noise of acoustic systems (transducer and hydrophone) are also inevitable. Reverberation was observed from received hydrophone data due to multi-path and other reflections. Acoustic interference was not observed by any other acoustic source that interfered with our signal band.
5.3 The
Experimental
Setup
The experimental setup consists of five electronic devices, which are an arbitrary waveform generator, a power amplifier, a transducer, a hydrophone and oscilloscope and two software programs: Matlab and Agilent Bench-link Waveform Builder.
The arbitrary waveform generator is a 33522A Function and Arbitrary Waveform Generator, 30 MHz by Agilent Technology. The transducer is a D45 omni directional transducer by Neptune Sonar, whose transmitting voltage response (TVR) graph is shown in Appendix A. The hydrophone is a TC4014-5 omni directional hydrophone including pre-amplifier electronics by Teledyne Reson, whose receiving sensitivity graph is shown in Appendix A. The
40
Oscilloscope is a DPO 7104 Digital Phosphor Oscilloscope by Tektronix. The power amplifier is a Brüel & Kjaer Power Amplifier Type 2713.
In Appendix A, the magnitude response of D45 omni directional transducer and TC4014-5 omni directional hydrophone are given. Besides magnitude response, phase response of electroacoustic antennas is also crucial, especially with the signals that include various frequency components as DSSS signals. Phase response of electroacoustic antennas should be a linear function of frequency and as a consequence, the group delay should be constant at all frequency bands. Linear phase response enables the transmission of various frequencies contained in a modulated waveform to be delayed by the same amount. This provides preventing the signal shape and avoiding phase distortion. The phase response of D45 omni directional transducer and TC4014-5 omni directional hydrophone are not available. Therefore, the phase response of these electroacoustic antennas is assumed on the worst case in the beam coding experiments in order to observe the worst case performance of the DSSS signals.
The experimental setup block diagram starts with (DSSS) signal generation on the Matlab software program. After the generation of the (DSSS) signal, the Agilent Bench-link Waveform Builder software program is used so as to translate Matlab (DSSS) signal coefficients to the appropriate file format for the arbitrary waveform generator. (DSSS) signal is generated by the Arbitrary Waveform Generator block and the amplitude of the signal is amplified 100 times by the power amplifier. The transducer converts the transmitted DSSS electrical signal to acoustic signal and transmits the acoustic signals into the underwater medium. The hydrophone converts the acoustic signal to an electrical signal that is the received (DSSS) signal. Both transmitted and received (DSSS) signals are observed, measured and recorded by the oscilloscope. The recorded data is carried out with several Matlab implementations, which are band pass filtering, matched filtering and peak detection.
41
42
5.4 The
Experimental
Result
The time domain and the frequency domain representations of transmitted (DSSS) signals, received (DSSS) signals and matched filter output results are plotted and examined in two steps of the experiment. The first step is related with the measurement of the matched filter performance of one coded (DSSS) signal transmission. The second step is related with measurement interference performance of seven coded (DSSS) signal transmission.
In the first step of the experiment, a 511 chips gold sequence coded (DSSS) signal was transmitted throughout a beam in order to measure the matched filter performance. The time domain and the frequency domain representations of the transmitted (DSSS) signals are plotted in Figure 5.5, in which the signal consists of 511 chips gold code sequence, each chip having 50 μs duration in the sequence. As a result of the transmitted (DSSS) signal, it can be observed that the total duration is 25.55 ms. The carrier frequency of gold code sequence is 80 kHz. Due to the 50 μs chip duration, binary ‘1’ chips are symbolized by 4.25 sinusoidal cycles at 85 kHz and binary ‘0’ chips are symbolized by 3.75 sinusoidal cycles at 75 kHz. The binary ‘0’ chip and the binary ‘1’ chip signal in the transmitted (DSSS) signal is illustrated in Figure 5.3.
43
The time domain and the frequency domain representations of the received (DSSS) signals are plotted in Figure 5.5. Even if the received (DSSS) signal has the same frequency domain characteristic with the transmitted (DSSS) signal, the effect of environmental noise and reverberation is observable on the received signal at the time domain. The received signal duration is longer than the transmitted signal duration: 25.55 ms because of the interference of the desired echo and the undesired surface reflection echo.
The matched filter output result is plotted in Figure 5.7. Matched filter output has 2 peaks that correspond to direct path and surface multi-path of the transmitted (DSSS) signal. The first peak is approximately at 8.35 ms with an estimated range of 12.525 meters and the second peak is approximately at 9.4 ms with an estimated range of 14.1 meters by assumption of 1500 m/s sound velocity. These results are verified by the current experimental setup dimension.
Figure 5.4: Direct Path and Multipath of (DSSS) Signal
It is assumed that the first peak on the matched filter output is the direct path of (DSSS) signal, and then the direct path distance 2𝑦 is equal to 12.525 meters. The surface multipath distance under the assumption of constant sound velocity profile in underwater environment can be calculated as follows:
44 2𝑥 = 2 × √32+ (12.525 2 ) 2 2 = 13.888 𝑚
The expected multipath distance 13.888 m is almost equal to the measured multipath distance 14.1 m. It is also proved that DSSS signals can overcome inter symbol interference by multipath propagation.
Figure 5.5: Time Domain and Frequency Domain Representationsof (DSSS) Transmitted Signal
45
Figure 5.6: Time Domain and Frequency Domain Representationsof (DSSS) Received Signal
46
In the second step of the experiment, summation of seven 511 chips gold sequence coded (DSSS) signals was transmitted throughout a beam in order to measure the interference performance of (DSSS) signals. The time domain and the frequency domain representations of the transmitted (DSSS) signal are plotted in Figure 5.8, in which the signal consists of summation seven, 511 chips gold code sequence. Each 511 chips gold sequence coded (DSSS) signal has similar bandwidth characteristics, which are 50 μs chip duration, 25.55 ms each (DSSS) signal duration and 80 kHz carrier frequency. The summation of seven (DSSS) signals does not have a sinusoidal shape. Its shape is similar to the noise signal except for its amplitude level. However, the frequency domain characteristic of this summation signal shows similarity with a DSSS signal; that the summation of seven (DSSS) signal is also a spread spectrum signal.
Figure 5.8: Time Domain and Frequency Domain Representationsof (DSSS) Transmitted Signal
47
The time domain and the frequency domain representations of the received DSSS signal are plotted in Figure 5.9. The time domain representation of the received signal shows the noise signal characteristic more than the transmitted signal due to environmental noise and reverberation. The frequency domain representation of received signal shows that more signal energy is relatively scattered out of the spreading band. As a result of this, maximum point levels of the matched filters decrease.
Figure 5.9: Time Domain and Frequency Domain Representationsof (DSSS) Received Signal
Since the transmitted (DSSS) signal includes seven different (DSSS) code sequences, each code sequence can be separately detected by using different matched filters. Thus, each code sequence has to have its own matched filter. These matched filter output results are plotted in Figure 5.10, Figure 5.11, Figure 5.12, Figure 5.13, Figure 5.14 and Figure 5.15 for each code separately. Matched filter outputs have only one peak that is the direct path of the transmitted (DSSS) signal. As opposed to the matched filter outputs in the first step of the experiment,
48
the multi-path of the transmitted (DSSS) signals are not detectable due to the high distortion on the multi-path signals.
According to the matched filter output figures, maximum points of matched filter outputs are approximately at 9.37 ms with an estimated range of 14.055 meters by assumption of 1500 m/s sound velocity. According to each matched filter output result, each (DSSS) code can detect a target individually and the detection parameter of each code is as follows:
1. Code 1 detection is at 9.36 ms, in which the matched filter level is 124.3 units.
2. Code 2 detection is at 9.356 ms, in which the matched filter level is 115.8 units.
3. Code 4 detection is at 9.37 ms, in which the matched filter level is 109.2 units.
4. Code 5 detection is at 9.369 ms, in which the matched filter level is 109.9 units.
5. Code 6 detection is at 9.356 ms, in which the matched filter level is 112.2 units.
6. Code 7 detection is at 9.37 ms, in which the matched filter level is 111 units.
The maximum points of all matched filter outputs are approximately equal to each other. However, these maximum point levels are lower than the maximum point level of the matched filter (Figure 5.7) in the first step of the experiment. It means that beam coding by applying the summation of seven (DSSS) signal results in detection performance reduction on the receiver. On the other hand, these results indicate that beam coding is technically feasible for underwater acoustic systems.
49
Figure 5.10: 1. Coded Beam: CODE1 Matched Filter Output
50
Figure 5.12: 4. Coded Beam: CODE4 Matched Filter Output
51
Figure 5.14: 6. Coded Beam: CODE6 Matched Filter Output