POLYMORPHISMS OF GLUTATHIONE S- TRANSFERASE GENES (GSTM1, GSTP1, AND GSTT1) AND BREAST CANCER SUSCEPTIBILITY
IN THE TURKISH POPULATION
A THESIS SUBMITTED TO
THE DEPARTMENT OF MOLECULAR BIOLOGY AND GENETICS AND
THE INSTITUTE OF ENGINEERING AND SCIENCE OF BILKENT UNIVERSITY
IN PARTIAL FULFILLMENT OF THE REQUIREMENTS FOR THE DEGREE OF MASTER OF SCIENCE
BY EBRU DEMiR AUGUST, 2002
i I certify that I have read the thesis, and that in my opinion it is fully adequate, in scope and in quality, as a thesis for the Master of Science.
____________________________ Prof. Dr. Semra SARDAŞ
I certify that I have read the thesis, and that in my opinion it is fully adequate, in scope and in quality, as a thesis for the Master of Science.
____________________________ Assoc. Prof. Dr. Tayfun ÖZÇELİK
I certify that I have read the thesis, and that in my opinion it is fully adequate, in scope and in quality, as a thesis for the Master of Science.
____________________________ Asst. Prof. Dr. Işık G. YULUĞ
Approved for the Institute of Engineering and Science
____________________________ Prof. Dr. Mehmet BARAY
ii ABSTRACT
POLYMORPHISMS OF GLUTATHIONE S- TRANSFERASE GENES (GSTM1, GSTP1, AND GSTT1) AND BREAST CANCER SUSCEPTIBILITY
IN THE TURKISH POPULATION
Ebru DEMİR
Ms. in Molecular Biology and Genetics Supervisor: Asst.Prof.Dr.Işık G. YULUĞ
August 2002, 98 pages
The potential association between the Glutathione S- transferase genes
GSTM1, GSTT1, GSTP1 and breast cancer susceptibility was investigated in a case
control study of 264 female patients and 233 age-matched controls in the Turkish population. The combined GSTP1 105 Ile/Val or Val/Val genotypes was significantly associated with breast cancer risk in all women (odds ratio OR=1.64, 95% confidence interval CI=1.09-2.47 and in premenopausal women is OR= 2.01, 95% CI=1.06-3.83). Neither GSTM1 nor GSTT1 was found to be associated with breast cancer. Distribution of GSTP1 genotypes was stratified according to body mass index (BMI), age, age at menarche, age at term pregnancy, number of full-term pregnancies, and family history of breast cancer. The association of the combined GSTP1 105 Ile/Val or Val/Val genotypes with breast cancer risk was further exacerbated in women with high BMI (OR=2.12, 95% CI=1.35-3.62), but not with a low BMI (OR=0.78, 95% CI=0.45-1.34). These findings support the role for the combined GSTP1 105 Ile/Val or Val/Val genotypes in the development of breast cancer, particularly with a high BMI.
iii
ÖZET
TÜRK TOPLUMUNDA GLUTATYON S-TRANSFERAZ GENLERİNİN (GSTM1, GSTT1,GSTP1) POLİMORFİZMLERİ VE MEME KANSERİ İLE İLİŞKİSİ
Ebru DEMİR
Moleküler Biyoloji ve Genetik Yüksek Lisansı Tez Yöneticisi: Yrd.Doç.Dr.Işık G. YULUĞ
Ağustos 2002, 98 sayfa
GSTM1, GSTT1 ve GSTP1 Glutatyon S-Transferaz genleri ile meme
kanserine yatkınlık arasındaki olası ilişki Türk toplumunda 264 kadın hasta ve 233 yaş bakımından eşleştirilmiş kontrol bireyinde incelendi. Kombine GSTP1 105 Ile/Val veya Val/Val genotipleri tüm kadınlarda (olasılık oranı OR=1.64, %95 güven aralığı GA=1.09-2.47) ve premenopozal kadınlarda (OR=2.01, %95 GA=1.06-3.83) (belirgin şekilde artmış olarak) meme kanseri riskiyle ilişkiliydi. Ne GSTM1 ne de
GSTT1 meme kanseri ile ilişkili bulunmadı. GSTP1 genotiplerinin dağılımı vücut
kütle oranı (VKO), yaş, menarş yaşı, miyadında doğum yaşı, miyadında doğum sayısı ve ailede meme kanseri öyküsüne göre gruplandırıldı. Kombine GSTP1 105 Ile/Val veya Val/Val genotiplerinin meme kanseri riski ile ilişkisi yüksek VKO’lu hastalarda (OR=2.12, %95 GA=1.35-3.62) daha da belirgindi, ama düşük VKO’lu hastalarda değildi (OR=0.78, %95 GA=0.45-1.34). Bu bulgular meme kanseri gelişiminde, özellikle yüksek VKO’lu kadınlarda kombine GSTP1 105 Ile/Val veya Val/Val genotiplerinin rolü olduğu düşüncesini desteklemektedir.
iv
ACKNOWLEDGEMENTS
I am grateful to my advisor Asst. Prof. Işık G. Yuluğ_ for her supervision, guidance, continuous support and being with me at all times.I also would like to thank Assoc.Prof.Tayfun Özçelik, for his motivating comments and helpful critisims. Many thanks to Dr. Gökçe A. Törüner, and Dr. Dilek Güvenç for supporting me with their knowledge and experience.
I also thank Dr. Betul Bozkurt for providing the samples and the clinical data for my work.
I would particularly like to thank all members of the MBG department for their support and friendship.
Many thanks to my family, especially my mother for always giving her unconditioned support and love.
I am very grateful to Sargun Tont, Atasay Kotanak and all my friends for their continuous support and encouragement and being there for me when I needed them the most.
v
Table of Contents
SIGNATURE PAGE ……… i ABSTRACT………... ii ÖZET... iii ACKNOWLEDGEMENTS……… iv TABLE OF CONTENTS………... vLIST OF TABLES………. vii
LIST OF FIGURES………... viii
ABBREVIATIONS……….. ix
1. Introduction………..… 1
1.1. Genetic Basis of Human cancer……….... 1
1.1.1. Cancer and Related Genes……….… 1
1.1.1.1.Genetic Events in Cancer, Gain-of-function……….…..…. 1
1.1.1.2.Genetic Events in Cancer, loss-of-function………...….. 2
1.1.1.3.Patterns of Tumorigenic Events………... 2
1.1.2. Inherited Predisposition………. 4
1.1.2.1.Strong Predisposition………... 4
1.1.2.2. Weak Predisposition………... 7
1.1.2.2.1. Glutathione S-Transferases (GST)………... 10
1.1.3. Genetic Events Outside the Cancer Pathway………. 14
1.2. Breast Cancer……… 31
1.2.1. Clinical Information………... 31
1.2.1.1.Epidemiology and Etiology………. 31
1.2.2. Genetic Predisposition to Breast Cancer……… 32
1.3. Aim………... 38
2. Materials and Methods………. 39
2.1. Materials………... 39
2.1.1. Subjects……… 39
2.1.1.1.Patients………. 39
2.1.1.2.Age-matched Control Group……… 41
2.1.1.3.Random Control Group……… 41
2.1.2. Oligonucleotides……… 41
2.1.3. Chemical and Reagents……….. 43
2.1.4. PCR Materials……… 44
2.1.5. Restriction Endonucleases………...……….. 44
2.1.6. Standard Solutions………. 44
2.2. Methods……… 46
2.2.1. DNA Isolation……… 46
2.2.2. Polymerase Chain Reaction (PCR)……… 47
vi
2.2.4. Agarose Gel Electrophoresis……….. 47
2.2.5. Genotyping of Individuals………. 48 2.2.5.1.GSTP1 Genotyping……….. 48 2.2.5.2.GSTT1 Genotyping……….. 48 2.2.5.3.GSTM1 Genotyping………. 49 2.2.6. Statistical Analyses……… 53 2.2.6.1.Chi-square Test……… 53
2.2.6.2.Odds Ratio Calculation……… 55
2.2.6.3.Multivariate Adjusted Odds Ratio Calculation……… 57
2.2.6.4.Gene-environment, Gene-Gene Interaction Analyses…………. 57
3. Results……….. 60
4. Discussion……… 72
5. Conclusion and Future Perspectives……… 77
vii
LIST OF TABLES:
Table 1: List of Familial Cancer Genes and Syndromes………... 6 Table 2: Major gene polymorphisms associated with cancer……… 8 Table 3: The association of GSTM1 null genotype and cancer in
case control studies……….. 14 Table 4: The association of GSTP1 Ile 105 Val polymorphism and
cancer in case control studies……….. 21 Table 5: The association of GSTT1 null genotype and cancer in
case control studies……….. 24 Table 6: Genetic association ( case control ) studies in breast cancer………... 34 Table 7. CYPs and breast cancer in women………... 37 Table 8: Selected characteristics for breast cancer patients (n=264) and
age-matched control subjects (n=233)………. 40 Table 9. List of primers for gene specific amplification………... 42 Table 10. Sample 2x2 Table for OR analysis……… 56 Table 11: Definition of ORs (OR01, OR10, OR11) and interaction parameters
(Ψ,Φ) for the relations of two dichotomous environmental and
genetic factors and cancer……….. 59 Table 12:Characteristics of participants in this study……… 66 Table 13. Distribution of the GSTM1, GSTP1 and GSTT1 genotypes in
the age matched controls and breast cancer patients………. 67 Table 14: Distribution of GST genotypes stratified according to BMI in cases
and controls……… 68 Table 15: Combination of the GSTT1 null genotype with the
GSTP1 105 Ile/Val or Val/Val genotype for breast cancer risk………… 69 Table 16: Combination of the GSTM1 null genotype with the
GSTP1 105 Ile/Val or Val/Val genotype for breast cancer risk…………. 70 Table 17: Combination of the GSTT1 and GSTM1 null genotypes with
viii
LIST OF FIGURES
Figure 1. The cellular pathways in cancer………. 3
Figure 2: Overview of enzymatic detoxification……….……….. 11
Figure 3: The glutathione S-tranferase super-gene family……… 11
Figure 4: A framework for genetic events related to cancer development………… 30
Figure 5: Schematic representation of GSTP1 ... 50
Figure 6: Schematic representation of GSTT1... 51
Figure 7: Schematic representation of GSTM1... 52
Figure 8. Genotyping of GSTM1 gene………... 63
Figure 9: Genotyping of GSTP1 gene……… 64
ix ABBREVIATIONS
APC Adenomatous Polyposis of the Colon
BRCA1 Breast Cancer Susceptibility Gene 1
BRCA2 Breast Cancer Susceptibility Gene 2
CASP10 Caspase 10
CDH1 Cadherin 1
CDKN1C Cyclin dependent kinase 1C
CDKN2A Cylin Dependent kinase 2A
CI Confidence Interval
CYP1A1 Cytochrome P450 1A1
CYP1A2 Cytochrome P450 1A2
CYP1B1 Cytochrome P450 1B1
CYP2A6 Cytochrome P450 2A6
CYP2C19 Cytochrome P450 2C19
CYP2D6 Cytochrome P450 2D6
CYP3A4 Cytochrome P450 3A4
CYP11a Cytochrome P450, subfamily Xia
CYP17 Cytochrome P450, subfamily XVII
CYP19 Cytochrome P450, subfamily XIX
DNA Deoxyribonucleic acid
DIA4 Diaphorase 4
dNTP Deoxynucleotide triphosphate
ERCC1 Excision repair cross-complementing rodent
deficiency complementation group 1
ERCC2 Excision repair cross-complementing rodent
deficiency complementation group 2
ESRRA Estrogen-related receptor alpha
EXT1 Exostosin 1
EXT1 Exostosin 1
GSTM1 Glutathione S-Transferase mu 1
GSTM2 Glutathione S-Transferase mu 2
x
GSTM4 Glutathione S-Transferase mu 4
GSTM5 Glutathione S-Transferase mu 5
MADH4 Mothers against decapapenaplegic Drosophila
Homolog of 4
MEN1 Multiple Endocrine Neoplasia type1
MLH1 Mut L Homolog 1 ml milliliter mM milimolar µl microliter MPO Myeloperoxidase MSH2 Mut S Homolog 2
NAT1 N-Acetyl Trransferase Type 1
NAT2 N-Acetyl Transferase Type 2
NF1 Neurofibromatosis 1
NF2 Neurofibromatosis 2
ng nanogram
OR odds ratio
pmol picomol
PPARA Peroxisome Proliferative Activated Receptor, Alpha
PPARG Peroxisome Proliferative Activated Receptor,Gamma
PRKAR1A Protein kinase,c-AMP dependent regulatory,type 1
POLB Polymerase Beta
PTGS1 Prostaglandin-Endoperoxide Synthase 1
PTGS2 Prostaglandin-EndoperoxideSynthase 2
RB Retinoblastoma gene
RET Rearranged during Transfection
SDHD Succinate Dehydrogenase Complex, Subunit D
SMARCB1 SWI/SNF-related, Matrix-Associated,
Actin-Dependent regulator of chromatin Subfamily1, Member 1
SULT1A1 Sulphotransferase 1A1
SULT1A2 Sulphotransferase 1A2
TNF Tumor Necrosing Factor
xi
TSC1 Tuberous Sclerosis 1
TSC2 Tuberous Sclerosis 2
VDR Vitamin D Receptor
VHL Von Hipple-Lindau
XRCC1 X-ray repair complementing defective repair in Chinese hamster cells 1
X2 Chi-square
1
1. Introduction
1.1 Genetic Basis of Human Cancer
All cancers are caused by abnormalities in DNA sequence. Throughout life, the DNA in human cells is exposed to mutagens which causes errors in replication. This process results in progressive, subtle changes in the DNA sequence of each cell (Futreal PA. et al. 2001). Occasionally, one of these somatic mutations alters the function of a critical gene, providing a growth advantage to the cell in which it has occurred and resulting in the emergence of an expanded clone derived from this cell. Additional mutations in the relevant target genes and consequent waves of clonal expansion produce cells that invade surrounding tissues and metastasize. Cancer is the most common genetic disease: one in three people in the western world develop cancer, and one in five die from it (Higgison J. et al 1992).
Self-sufficiency in growth signals, insensitivity to growth-inhibitory (anti-growth) signals, evasion of programmed cell death (apoptosis), limitless replicative potential, sustained angiogenesis, and tissue invasion and metastasis are six capabilities that are shared in common by almost all types of human tumors (Hanahan D. and Weinberg AR. 2000).
1.1.1 Cancer and Related Genes
Initiation and progression of cancer and the major genes, which take part in these processes, are shown in Figure 1.
1.1.1.1. Genetic Events in Cancer, Gain-of-function
Oncogenes are altered forms of normal cellular genes called proto-oncogenes. In human cancers, proto-oncogenes are frequently located adjacent to chromosomal breakpoints and are targets for mutation. The products of proto-oncogenes regulate several events of cell cycle, cell division and differentiation. In a cancer cell, one or more of the components of these pathways are altered. Oncogenes exhibit a dominant phenotype at the cellular level and gain-of-function occurs when one copy of an oncogene is activated. Oncogenes may be transmitted from generation to generation
2 when the proto-oncogene mutates in the germ-line. A good example of an oncogene is ERBB2, which codes for a receptor for epidermal growth factor and is involved in glioblastoma, brain cancer and breast cancer. Another example is Bcl-1 coding for cyclin D1, which is a component of the cell cycle clock and is involved in breast, head and neck cancers. Other examples include C-Myc, N-Myc and L-Myc which are transcription factors that activate growth promoting genes and are involved in leukemia, neuroblastoma, and breast, lung and stomach cancers.
1.1.1.2 Genetic Events in Cancer, Loss-of-function
Tumor suppressor genes encode proteins that function in growth regulatory or differentiation pathways and if altered contribute to cancer formation. Tumor supressor genes exhibit a recessive phenotype and require inactivation of both alleles. They are divided into two categories: Gatekeepers and Caretakers (Kinzler KW. and Vogelstein B. 1997). Genes whose mutation or altered expression distrupts the cell-cyle control and cell division, death or lifespan, promoting the outgrowth of cancer cells (e.g. Rb) are termed `Gatekeepers` and those whose change causes genomic instability, increasing the frequency of alteration in gatekeeper genes are defined as `Caretakers` (e.g. MLH1, BRCA1).
1.1.1.3 Patterns of Tumorigenic Events
Four to seven rate-limiting genetic events are needed for the development of the common epithelial cancers (Renan MJ. et al. 1993). The precise pattern of genetic alteration differs between cancers of different types and even of the same type. However, the patterns are not random (Liotta L. et al. 2000 and Suzuki S. et al. 2000). The molecular profiling of tumors by genomic alterations or expression changes will reflect the possible mechanisms of tumor evolution, which may provide information of clinical value.
3 Figure 1. The cellular pathways in cancer (Adopted from Evan GI. and Vousden KH 2001).
4
1.1.2 Inherited Predisposition
Genetic factors are involved in varying degrees in carcinogenesis. Germ-line mutations in BRCA1 or BRCA2 genes confer a high breast cancer risk to the individual; however, such strong predispositions are rare in a population. At the other end of the spectrum are the weak genetic effects (predisposition without evident family-history) that confer a low risk to the individual, even though they may be common in a population.
1.1.2.1 Strong Predisposition
Familial adenomatous polyposis was described at the beginning of 20th century. At that time hereditary cancer syndromes were thought to be very rare until a case-control study showed that a positive family history of stomach or colon cancer meant a three-fold increased risk for those cancers in family members (Brose MS et
al. 2000).
In 1960’s, family studies suggested an autosomal dominant mode of genetic transmission of certain clusters of carcinoma of the breast, ovary and colon (Brose MS et al. 2000). In the 1980’s, the gene for familial adenomatous polyposis was linked to 5q and then mapped to 5q21 (Brose MS et al. 2000). There are now more then 40 germ-line mutations known to be responsible for cancer susceptibility (Table 1).
With the notable exception of RET oncogene, the germ-line mutations in hereditary cancers are usually on the tumor suppressor genes which are responsible for regulation of cell cycle and DNA repair. When the entire human genome mapping is completed, more cancer susceptibility genes may be found. The researchers will not be able to match so many genes to hereditary disorders without examining family histories.
General features of hereditary cancer syndromes include the following:
Vertical transmission of cancer predisposition. This refers to the presence of a genetic predisposition in sequential generations. To have the cancer predisposition a person must inherit it from a parent.
5 The mutant gene can be passed on to both male and female children. In
the case of breast cancer, the women are at higher risk. Males develop breast cancer rarely. A male who inherits a cancer predisposition and shows no evidence of it can pass the altered gene on to his children. When a parent carries an autosomal dominant predisposition, each child
has a 50% chance of inheriting the predisposition.
Clinical characteristics. Patients with an autosomal dominant
predisposition are diagnosed at an earlier age than in sporadic cases. Most known mutations that increase breast cancer risk also increase risk of ovarian cancer. In addition, two or more primary cancers such as multiple primary cancers of the same type (e.g. bilateral breast cancer) or primary cancers of different types (e.g. breast and ovarian cancer) can occur in the same individual.
6 Table 1: List of Familial Cancer Genes and Syndromes
Gene Cancer syndrome
APC Familial polyposis of colon
BRCA1 Hereditary Breast/Ovarian Cancer
BRCA2 Hereditary Breast/Ovarian Cancer
CDH1 Familial gastric carcinoma
CDKN2A Cutaneous malignant melanoma
CDKN1C Beckwith-Wiedeman Syndrome
CYLD Familial cylindramotosis
EXT1 Multiple exostoses type 1
EXT2 Multiple exostoses type 2
MADH4 Juvenile Polyposis
MEN1 Multiple endocrine neoplasia type1
MLH1 Hereditary non-polyposis colon cancer
MSH2 Hereditary non-polyposis colon cancer
NF1 Neurofibromatosis type 1
NF2 Neurofibromatosis type 2
PRKAR1A Carney Complex
PTCH Nevoid basal cell carcinoma
PTEN Cowdens` Syndrome
RB1 Familial Retinoblastoma
RET Multiple endocrine neoplasia MEN2A, MEN2B and medullary thyroid carcinoma
SDHD Familial paraganglioma
SMARCB1 Rhabdoid predisposition syndrome TP53 Li-Fraumeni Syndrome
TSC1 Tuberous Sclerosis 1
TSC2 Tuberous Sclerosis 1
STK11 Peutz-Jegers Syndrome
VHL Von Hipple-Lindau Syndrome
7 1.1.2.2 Weak Predisposition
Weak predisposition to cancer may result from genetic variations in cancer pathways and low penetrance genes. Subtle sequence variants or polymorphisms may be associated with a small to moderately increased risk for cancer. In sporadic cancers, such factors affecting the probability of the events are very important. Low penetrance gene candidates are found in many pathways such as environmental carcinogen detoxification, steroid hormone metabolism and DNA damage repair. However, polymorphisms in the genes regulating immune response, hormone regulation and apoptosis are also regarded as important genetic factors (Table 2) (Brockmoller J. et al. 2000). Identification of these genes will be greatly accelerated by the data from the Human Genome Project (Chakravarti A. 2001).
The search for candidate genes relies on cataloguing the DNA sequence variation within the population and showing that particular variants are significantly associated either with disease susceptibility or with some other aspects of the disease phenotype such as treatment response or survival (Cardon LR. and Bell JI. 2001). The most readily assayed form of genomic variation is a single nucleotide polymorphism (SNP). 2,84 million SNPs have been identified so far and are available from genomic databases (The Interval SNP Map Working Group, 2001). Although SNPs are mostly biallelic and less informative than microsatellite markers, they are more stable mutations. This enables more suitable association studies in which linkage disequilibrium (LD) between markers and an unknown variant is used to map disease-causing mutations. Since SNPs have only two alleles, which can be genotyped by a simple assay, this makes them more suitable to automated analysis. When identifying genes involved in determining complex traits, association studies are better suited for detecting genetic effects of low penetrance with higher resolution. For such studies, many more markers will be required in addition to better statistical tools and high-throughput low-cost genotyping technology to analyze large marker sets in many samples. The performance of numerous analyses on the small surface of oligonucleotide micro-arrays is one of the most promising approaches for large-scale SNP genotyping (Tillib SV. et al 2001)
10 1.1.2.2.1 Glutathione S-Transferases (GSTs)
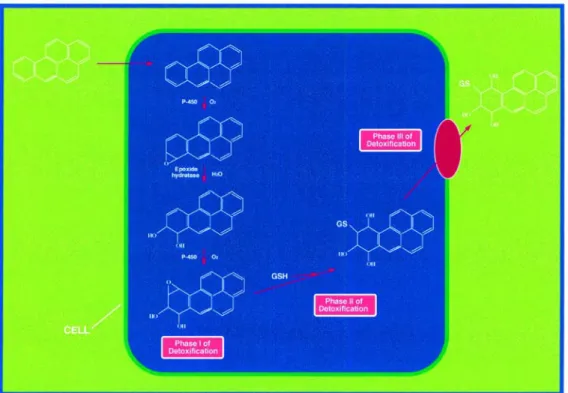
Living organisms are continuously exposed to non-nutritional foreign chemical species. These xenobiotics may harm the organism, causing toxic and sometimes carcinogenic effects. Naturally occurring toxic compounds include plant and fungal toxins (e.g. plant phenols and aflatoxins) and reactive oxygen species (e.g. the superoxide radical and hydrogen peroxide). The enzymatic detoxification of xenobiotics such as polycyclic aromatic hydrocarbons (PAH) has been classified into three distinct phases. Phase I and II involve the conversion of a lipophilic, non-polar xenobiotic into a more water-soluble and therefore less toxic metabolite, which can then be eliminated more easily from the cell (phase III) (Figure 2).
Phase I is catalyzed mainly by the cytochrome P450 system. Phase II enzymes catalyze the conjugation of activated xenobiotics to endogenous water-soluble substrates, such as reduced glutathione (GSH), UDP-glucuronic acid or glycine. In many species, conjugation to reduced glutathione catalyzed by GSTs is the major phase II reaction. GSTs can catalyze reactions resulting in the formation of GSH conjugates such as Micheal addition reactions which involve the addition of an enolate ion in a conjugate fashion to α, β-unsaturated ketones, nucleophilic aromatic substitutions, and epoxide ring-opening reactions. The reduction of hydroperoxides is also catalyzed by GSTs and results in the formation of oxidized glutathione (GSSG) (Hayes JD. and McLellan LI. 1999).
The GSH-xenobiotic conjugate is too hydrophilic to diffuse freely from the cell and must be pumped out actively by a transmembrane ATPase such as the GS-X pump (Ishikawa T. 1992) (Figure 2).
GSTs are dimeric and mainly cytosolic. In addition to their catalytic role in
detoxification, they have extensive ligand binding properties (Barycki JJ. and Colman RF. 1997). Quite distinct from the cytosolic enzymes, a separate microsomal class of GSTs exists. The microsomal class of GSTs is designated as `membrane-associated protein in eicosanoid and glutathione` metabolism (MAPEG) (Jakobsson PJ. et al 1999).
11 Figure 2: Overview of enzymatic detoxification (adopted from Sheehan D. et al. 2001)
The GSTs comprise a complex and widespread enzyme super-family that has
been subdivided into a number of classes by the amino acid/nucleotide sequence, and immunological kinetic and tertiary/quaternary structural properties. Human GSTs are a family of isozymes that includes at least eight distinct classes: alpha (A), mu (M), pi (P), sigma (S), theta (T), kappa (K), zeta (Z), and omega (O) (Strange CR. et al. 2001) (Figure3).
alpha mu theta pi zeta sigma kappa omega
ancesteral GST gene
Chromosome 6p 1p 22q 11q 14q 4q ND 10q Genes A1-A4 M1-M5 T1,T2 P1 Z1 S1 K1 O1 Allelic yes yes yes yes yes ? ? ? Figure 3: The glutathione S-tranferase super-gene family (Adopted from Strange CR
12 Several enzymes have been recognized as belonging to the Alpha and Mu classes. While the Pi class originally contained only one protein, GSTP1, at least five distinct Mu-class subunits (M1, M2, M3, M4 and M5) have been identified in humans with homologous gene loci (Strange CR et al. 2001).
Alpha-class GSTs comprises 4 types of subunits (A1, A2, A3, and A4) with
homologous gene loci in humans. The identification of subgroups within the Alpha class was carried out by comparison of substrate preferences and sequence similarities. The A4 subunit has particularly high activity with ethacrynic acid, lipid hydroperoxides, and 4-hydroxyalkenals (Hubatsch I. et al. 1998).
GSTP1 is involved in the detoxification of base propenals (Norppa H. 1997),
and metabolizes carcinogenic products such as benzo-(a)-pyrene dial epoxide, and acrolein, which are derived from cigarette smoke (Seidegard J. and Ekstrom G.1997).
Theta-class enzymes have unique substrate specificity in that they lack activity with 1-chloro-2,4-dinitrobenzene (CDNB), the `universal` GST substrate. Two distinct homodimers (GST1-1 and GST2-2) have been identified in humans with the T1 and T2 subunits (Pemble SE. et al 1994, and Schroder KR. et al 1996).
Human GSTP1-l has been shown to catalyze the isomerization of
13-cis-retinoic acid to all-trans-13-cis-retinoic acid (Chen H, and Juchau MR 1998). This is an example of an endogenous non-detoxification function for GSTs. In addition to their isomerization and GSH-conjugation activities, these enzymes contribute to defense against oxidative stress by their role as inhibitors of the Jun N-terminal kinase (Pi class) and their role in selenium-independent GSH peroxidase activities (Alpha class) (Zhao TJ. et al. 1998). These activities protects cells against the harmful effects of hydrogen peroxide including cell death (Adler V. et al 1999, and Yin Z. et al 2000).
GSTT1 detoxifies oxidative products of lipids and DNA. GSTT2 catalyzes
cumene hydroxyoperoxidease (Norpha H. 1997). GSTT1 enzymes are also involved in the metabolism of carcinogenic substrates, such as methylating agents, pesticides and industrial solvents (Sheehan D. et al 2001).
Zeta-class is classified in the theta category (Miller MC. et al 2001). Omega class enzyme shows high activity with CDNB (7-chloro-4-
nitrobenzo-2-oxa-1, 3-diazole), p-nitrophenyl acetate and thiol transferase (Sheehan D. et al 2001). Omega class GSTs may act as a GSH-dependent thiol transferase removing S-thiol adducts which some proteins form with GSH and cysteine in response to oxidative stress (Board PG. et al. 2000). A novel possible role for Omega
13 class GSTs is protecting cells form apoptosis induced by Ca2+ mobilization from intracellular stores (Dulhunty A. et al 2001).
Polymorphisms in thee genes coding for enzymes involved in protection against oxidative stress have been implicated in predisposition to cancer (Forsberg L.
et al. 2001).
It is obvious that the activity of GSTs is highly critical in the detoxification of carcinogens. Alterations in the structure, function or level of expression of GST genes or polymorphisms could alter the ability of the cell to inactivate carcinogens and mutagenes, thereby modifying cancer risk. The GSTM1 and the GSTT1 genes both exhibit deletion polymorphisms. Homozygous deletions of these genes, called
GSTM1 and GSTT1 null genotyping, results in lack of enzyme activity
(Gudmundsdottir K. et al. 2000). An A to G polymorphism at nucleotide 313 in the
GSTP1 gene results in an amino acid substitution (Ile105Val). This residue lies in the
substrate-binding site of the enzyme and the polymorphism has been shown to affect enzyme activity (Gudmundsdottir K. et al. 2000). A decrease in the GSTP1 enzyme activity will result in inefficient detoxification of carcinogens and an increase in cancer risk.
The association of GSTM1 null genotype with cancer was observed mostly in bladder and lung cancers. However, in some studies, GSTM1 null genotype was found to be associated with breast cancer risk (Table 3).
The results of association studies between GSTP1 genotype and many cancers including breast cancer are discordant in different populations (Table 4).
The GSTT1 null genotype seems to be associated with cancers of the larynx, skin, astrocytomas, meningioma, and the myelodysplastic syndrome, but not with cancers of the bladder, stomach, liver, ovary or endometrium (Table 5).
29
1.1.3 Genetic Events Outside the Cancer Pathway
Genetic variations may determine the outcome of interactions between exogenous carcinogens and the cell. Such gene-environment interaction between exposure to certain chemicals and genetic variations may increase cancer risk. Although variations may account for large and important differences in cancer susceptibility in the population, information on the gene-environment interaction may show us ways of reducing these risks. Tissue specific expressions of genes may indicate the relation between the tissue specific genes and exposures (Willams JA. 2001).
Variations in the circulating levels of growth factors or hormones increase cancer risk. It has been shown that prolonged exposure to estrogen is associated with an increased risk of developing breast cancer. Therefore, factors that increase the number of menstrual cycles such as early age at menarche, nulliparity, and the late onset of menopause increase the probability of breast cancer (Michels B. et al. 2001)
31 Figure 4: A framework for genetic events related to cancer development (adopted from Ponder BAJ. 2001).
1.2 Breast
Cancer
1.2.1 Clinical Information
1.2.1.1 Epidemiology and Etiology
Breast cancer is the most commonly diagnosed cancer among women, after nonmelanoma skin cancer. Breast cancer is the second leading cause of cancer deaths after lung cancer. In 2002, an estimated 205,000 new cases will be diagnosed and 40,000 deaths from breast cancer will occur in USA (Atlanta GA. 2002).
Breast cancer is a complex, multifactorial disease where both genetic and environmental factors have important contributions. The cumulative risk of breast cancer increases with age with most breast cancers occurring after the age of 50 (Feuer EJ. et al. 1993). Breast cancer occurs at an earlier age in women with a genetic susceptibility. Breast cancer risk increases with early menarche and late menopause, and is reduced by early first full term pregnancy. It is reported that these factors influence breast cancer risk only among women who did not have a mother or sister with breast cancer (Colditz GA. et al. 1996). However, a protective effect has been seen with early age at first live birth, and also with parity of 3 or more, in women with known mutations of the BRCA1 gene (Norad S. et al. 1993, and Norad SA. et al. 1995). The effect of reproductive history can only be explained by the contribution of other factors to breast cancer. Several lifestyle factors such as weight gain, obesity, fat intake, and level of physical activity are also associated with breast cancer risk. Overweight women are most commonly observed to be at increased risk of postmenopausal breast cancer and at reduced risk of premenopausal breast cancer that is thought to be estrogen related. However, these factors have not been well evaluated in women with a positive family history of breast cancer or in carriers of cancer-predisposing mutations. Similarly, alcohol consumption and a high-fat diet may be associated with an increased risk. Other risk factors may be important in subgroups of women defined according to genotype. For example,
32 polymorphisms of NAT gene have been observed to influence female smokers’ risk for breast cancer (Ambrosone CB. et al. 1996).
Breast cancer is the most common cancer in females in Turkey (Ozsari H. and Atasever L. 1997). The life-time prevalence of the disease ranges between 1 in 8 to 1 in 12 in Western populations (Pharoah PD. and Mackay JF. 1998, and National Cancer Institute 1999).
1.2.2.
Genetic Predisposition to Breast Cancer
Genetic factors influence the development of breast cancer. Females with germ-line mutations in BRCA1 or BRCA2 genes have an extremely high risk of developing breast cancer, but such strong predispositions are rare. Approximately 10-15% of breast cancer cases have a family history of the disease. Germ-line BRCA1 and BRCA2 mutations have been identified in approximately 5% of women diagnosed with breast cancer (Claus EB. et al. 1996, and Ozdag H. et al. 2000). Somatic mutations are absent in BRCA1 and a very low frequency of BRCA2 mutations exist in breast cancer cases. Mutations in BRCA1 and BRCA2 interacting proteins may affect their function. Another gene causing predisposition to very rare breast cancer susceptibility is TP53 (Borresen AL. et al. 1992). The most interesting polymorphism of the TP53 gene is Arg72Pro polymorphism. Studies on this polymorphism in various cancers reveal quite discordant results. The interaction of p53 with p73 is influenced by this polymorphism.
Other genetic variations confer a low risk to the individual, but are common in a population. Weak predisposition to breast cancer may result from genetic variations in cancer pathways and low penetrance genes. These polymorphically expressed low penetrance genes code for the enzymes that may have a role in the metabolism of estrogens or detoxification of drugs and environmental carcinogens. Although the clinical significance in breast cancer is unclear, genetic polymorphisms may account for the individual differences in sensitivity to carcinogens such as estrogen metabolites.
Molecular epidemiology studies of breast cancer have found associations with P450 cytochrome genotypes such as CYP1A1, CYP2D6, and CYP17 (Table 7). Studies of the NAT2 genotype and breast cancer susceptibility have shown inconsistent results (Table 6).
33 Individuals with a polymorphism in the GSTM1, GSTT1 or GSTP1 genes may have a higher risk of breast cancer because of their impaired ability to metabolize and eliminate carcinogens. Carcinogens such as PAHs, are lipophilic and stored in adipose tissues, including breast tissue (Wu F. et al. 2002). The most extensively studied polymorphisms in human breast cancer are associated with carcinogen-metabolism (Table 6, and Table 7).
The results of association studies between GST genotypes and breast cancer are discordant in different populations (Rebbeck TR. et al. 1997, Helzlsouer KJ. et al. 1998, Ambrosone CB. et al. 1999, and Maugard CM. et al. 2001) despite this neat theoretical framework.
38 1.3. Aim
The purpose of this study is to determine whether GSTM1 null, GSTP1 Ile105Val, GSTT1 null genotypes are genetic susceptibility factors for breast cancer in the Turkish population.
This study deals with the following questions:
1. Are Glutathione S-tranferase gene polymorphisms genetic risk factors for breast cancer in the Turkish population?
2. Are Glutathione S-tranferase polymorphisms associated with the established risk factors for breast cancer?
The GSTM1 locus was included in this study, since negative results have been reported in some populations, and no data about GSTM1 polymorphism was available for the Turkish population.
The GSTP1 locus was studied because its role was less established as a breast cancer risk factor.
The GSTT1 and GSTP1 loci were analyzed because no data was available for the Turkish population in regard to their association with breast cancer.
39
2. Materials and Methods
2.1. Materials
2.1.1 Subject:
Our study population consisted of 264 females previously diagnosed with breast cancer, 233 age-matched females and 77 random controls as a control group with no history of cancer. Cases and controls consented to participate in this study by giving blood samples and personal information. At the time of blood donation, each individual completed a standardized questionnaire including data on age, weight, height, menstrual and reproductive histories, family history of breast and other cancers (first degree relatives; only mother, sister or daughters) and smoking status.
A blood sample was collected from each volunteer and DNA extracted using a standard procedure as described in section 2.1.2.
2.1.1.1 Patients:
264 breast cancer patients were included in the study (Table 8). All patients were diagnosed at Hacettepe University Medical School, Ankara, Numune Hospital, and SSK Ankara Oncology Hospital, which are located in Ankara and predominantly serve patients from central Anatolia.
Information about age, weight and height of the patient, age at menarche, age at full term pregnancy, number of full term pregnancies, family history of breast cancer, and smoking history were obtained from standardized questionnaire forms. Information about the histopathology of the tumors, estrogen receptor status, and progesterone receptor status were obtained from the medical records (See; questionnaire form)
1. Adı Soyadı: 2. Yaşı:
3. Medeni Hali:
4. Yaşadığı şehir ve süresi: 5. Ağırlığı (kg):
6. Boyu (cm):
7. Mesleği:
8. İlk menstürasyon periyodunun başlama yaşı:
9. Menapozal durumu:
Premenapozal ise; son menstürasyon periyodunun kaç gün önce olduğu: Postmenapozal ise; son menstürasyon periyodunun kaç gün önce olduğu: 10. Tanı konulduğu zamanki menapozal durumu:
11. Tanının ne zaman konulduğu: 12. Uygulanan tedavi:
13. Daha önce hormon tedavisi gördü mü? Ne tip? 14. Oral kontraseptif kullandı mı? Nedir? 15. Kaç çocuğu var?
a. İlk doğumunu yaptığı yaş: b. Son doğumunu yaptığı yaş:
16. Daha önce meme ile ilgili operasyon geçirdi mi?
17. Ooferektomi (yumurtalıkların alınması) yapıldı mı? Yapıldı ise kaç yıl önce? 18. Sigara içme alışkanlığı:
Hiç içmedim () Eskiden içerdim ()
1-10 sigara /gün () 11-20 sigara /gün () 20 ve daha fazla/gün () 1 yıldır içiyorum () 2-5 yıldır içiyorum () 5-10 yıldır içiyorum ()
10-15 yıldır içiyorum() 15-20 yıldır içiyorum () 20 ve daha fazla yıldır içiyorum () 17. Sigara içilen ortamda sıkça bulunuyormusunuz?
(a) Evet (b) Hayır
18. Alkol kullanıyormusunuz?
(a) Evet (b) Hayır
Nadiren Haftada 1 kez Haftada 2-3 kez Haftada 4-5 kez Haftada 6-7 kez 19. Beslenme alışkanlığınızda size en fazla uyan tanım aşağıdakilerden hangisidir?
(a) Kızartma ağırlıklı yağlı diyet (b) Sebze ağırlıklı yağsız diyet
(c) Dengeli beslenme
20. Radyasyona maruz kaldınız mı? Hangi sıklıkla?
(a) Evet (b) Hayır
21. Tiroid ile ilgili bir rahatsızlığınız var mı?
(a) Evet (b) Hayır
Hipertiroidizm () Hipotiroidizm ()
22. Aile bireylerinde ve sizde genetik bir rahatsızlık var mı? Tipi.
(a) Evet (b) Hayır
23. Ailenizde meme kanserli başka bireyler var mı? (Anne, kardeş, anneanne, vb.) 24. Tümörün histopatolojisi
25. Tümör grade
26. Tümör stage
27. Östrojen reseptör durumu (+) veya (-) 28. Progesteron reseptör durumu (+) veya (-)
41 2.1.1.2 Age-matched Control Group:
233 women from Ankara Numune Hospital and SSK Ankara Oncology Hospital (Table 8) were included. Information about the age, weight, height, age at menarche, age at full term pregnancy, number of full term pregnancies, family history of breast cancer, and smoking history were obtained from standardized questionnaire forms.
2.1.1.3 Random Control Group
The random control group consisted of 77 students from Bilkent University. Information about age and sex were obtained from each individual.
2.1.2 Oligonucleotides:
43 2.1.3 Chemical and Reagents
Agarose Basica LE, EU
Boric acid Sigma, St.Louis, MO, USA Bromophenol blue Sigma, St.Louis, MO, USA Chloroform Carlo Erba, Milano, Italy
Ethanol Merck, Frankfurt, Germany
Ethidium bromide Sigma, St.Louis, MO, USA Ficoll Type 400 Sigma, St.Louis, MO, USA Gamma Micropor Agarose Prona LE, EU
Isoamyl alcohol Carlo Erba, Milano, Italy Phenol Carlo Erba, Milano, Italy Proteinase K Appligene-Oncor, USA
pUC Mix Marker, 8 MBI Fermentas Inc., NY, USA Sodium acetate Carlo Erba, Milano, Italy Sodium dodecyl sulfate(SDS) Sigma, St.Louis, MO, USA
TrisHCl Sigma, St.Louis, MO, USA
Trisodium citrate Sigma, St.Louis, MO, USA Xylene cyanol Sigma, St.Louis, MO, USA
44 2.1.4 PCR Materials
Taq polymerase (5U/µl), 10X PCR buffer (100 mM Tris-HCl, pH 8.8 at 25 oC, 500 mM KCl, 0.8% Nonidet P40), 25 mM MgCl2, 10 mM dNTP mix were obtained from MBI Fermentas Inc., NY, USA.
2.1.5. Restriction Endonucleases
Alw261 restriction endonuclease enzyme was obtained from MBI Fermentas Inc., NY,
USA.
2.1.6 Standard Solutions
Agarose gel loading buffer (6X) 15 % ficoll
0.05 % bromophenol blue 0.05 % xylene cyanol DNA Extraction buffer
10 mM Tris HCl, pH 8.0 10 mM EDTA, pH 8.0 0.5 % SDS Proteinase K (stock); 20 mg/ml SSC (20X) 3 M NaCl 0.3 M trisodium citrate, pH 7.0 TE Buffer 10 mM Tris HCl pH 8.0 1 mM EDTA
Tris-boric acid-EDTA (TBE) (10 X) (1L) 108 g Tris HCl
45 55 g boric acid
20 ml 0.5 M EDTA
Complete final volume to 1 L with ddH2O
Standard DNA size markers
PUC Mix Marker, 8 (MBI, Fermentas)
46 2.2.1 DNA Isolation:
Peripheral blood was collected in EDTA-containing tubes and stored at 4 oC for a period of five days. The blood was then divided into 800 µl aliquots and stored at -20 oC. These 800 µl blood samples were used for DNA extraction by standard proteinase K/SDS digestion and phenol-chloroform extraction. The blood samples were washed before proteinase K/SDS digestion. After the aliquots were thawed 800µl l x SCC was added and mixed by vortexing. The samples were then centrifuged at 13,000 rpm for 1 minute. The supernatant was carefully removed and discarded into the chloros. The cell pellet was resuspended in 1.4 ml l x SSC and centrifuged at 13,000 rpm for 1 minute. This washing step was repeated until the pellet became white. The pellet was then resuspended in 800µl DNA extraction buffer containing 20µl proteinase K (20 mg/ml) solution. The samples were incubated at 56 oC for 4 hours, and were briefly mixed every 20 minutes. If the cell pellet was not dissolved completely at the end of this incubation period, the tubes were left overnight at 56 oC.
After the cell pellet was completely dissolved, the phenol/chloroform step was carried out in the fume-hood. 400µl phenol/chloroform/isoamylalcohol (25:24:1) was added and the tube was vortexed vigorously. The tube was then centrifuged at 13,000 rpm for 5 minutes. The upper aqueous DNA-containing layer (~700 µl) was transferred into a new tube. If the DNA supernatant was sticky and not resuspended completely or if interface was not clear the extraction step was repeated by adding 350µl phenol/chloroform/isoamylalcohol (25:24:1). Then 35µl NaOAc (3mM, pH=5.2) and 700µl ice-cold absolute ethanol (EtOH) were added to the upper aqueous layer to precipitate the DNA, mixed by inversion and incubated at -20 oC for a duration of 30 minutes to overnight. The tubes were then centrifuged at 13,000 rpm for 15 minutes. Afterwards, ethanol was discarded and the pellet air-dried. The pellet was solubilized in 200 µl TE (pH 8.0) or in sterile ddH2O by incubation at 56 oC for 1 hour. If the pellet was not dissolved completely, overnight incubation at 56 oC was carried out. The DNA samples were stored at 4 ºC up to 2 months or at -20 oC for long-term.
47 2.2.2 Polymerase Chain Reaction (PCR)
The polymerase chain reaction is a method for oligonucleotide primer directed enzymatic amplification of a specific DNA sequence of interest.
All amplification reactions were carried out on a Perkin Elmer 9600 PCR machine. 2.2.3 Restriction Endonuclease Digestion :
Amplified GSTP1 products were subjected to digestion to analyze A3136
polymorphism in GSTP1. Enzyme digestion reaction was carried out using 10 µl PCR product, 10 x buffer Y+/TANGO (MBI Fermantas) (33 mM Tris-acetate, 10 mM Magnesium acetate, 66 mM Potassium acetate, 0.1 mg/ml BSA pH=7.9 at 37 oC), 3 units of Alw26I (MBI, Fermentas) in 30 µl reaction volume and the samples were incubated at 37 oC for 4 hours.
2.2.4 Agarose Gel Electrophoresis :
Agarose gel electrophoresis was used to analyze the PCR products. 2% (w/v) agarose gels were prepared in 1xTAE buffer and 1µl of ethidium bromide solution from 10mg/ml stock was added to the buffer. 8µl PCR product was mixed with 1.5µl 6x loading buffer and the mix was loaded onto the gel. The products were run at 90 volts for 45 minutes. The gel was then analyzed under the transilluminator and photographs were taken.
To analyze the restriction fragments, 3% 1:1 ratio of Agarose: Gamma micropore was used. 20µl of digested products were mixed with 4µl of 6x loading buffer and the mix was loaded onto the gel. Electrophoresis was performed at 90 volts for 30-45 minutes. The gel was photographed under UV light. pUCmix8 ( MBI Fermentas) was used as the DNA size marker.
48 2.2.5 Genotyping of Individuals :
The GSTP1 polymorphism was analyzed by PCR and restriction enzyme digestion for
genotyping. GSTT1 and GSTM1 genotypes were analyzed by PCR. The genotypes of each individual were scored by two independent researchers to eliminate uncertainty.
2.2.5.1 GSTP1 Genotyping
Ile 105 Val polymorphism in GSTP1 was analyzed by PCR and restriction digestion. For GSTP1 PCR amplification, 50-100ng genomic DNA was used in a total of 25µl reaction volume containing 10pmol each of GSTP1 primers, 200µM of dNTP mix, 10xPCR buffer, 1.5mM MgCl2, 1U DNA Taq polymerase. The amplification conditions were as follows; initial denaturing step at 94 oC for 5 minutes, followed by 30 cycles of denaturing for 30 seconds at 94 oC, annealing for 30 seconds at 57 oC, extension for 30 seconds at 72 oC. The reaction was completed with a final extension at 72 oC for 7 minutes. The expected amplification product, 176bp, was digested with 3 U Alw26I at 37 oC for 4 hours. The digested fragments were electrophoresed in 3% 1:1 ratio of Agarose: Gamma Micropore. The presence of 91bp and 85bp restriction fragments indicate the presence of Val allele (see Figure 5 for schematic representation).
2.2.5.2. GSTT1 Genotyping
GSTT1 genotyping was determined by PCR using GSTT1 gene specific primers. GSTP1 primers were also included in the PCR mixture as a control to see the independent
amplification of each sample. For GSTT1 PCR genotyping, 50-100ng genomic DNA was used in a total volume of 25 µl containing 10 pmol of each GSTT1 primers, 200µM of dNTP, 10xPCR buffer, 2.0mM MgCl2, and 1U of DNA Taq polymerase. The amplification conditions were as follows: initial denaturing step at 94 oC for 5 minutes, followed by 30 cycles of denaturing for 30 seconds at 94 oC, annealing for 30 seconds at 60oC, extension for 30 seconds at 72 oC. The reaction was completed with a final extension at 72 oC for 7
49 minutes. The expected amplification product was 138bp in GSTT1 positive individuals. For
GSTP1 genotyping, reaction conditions were carried out as described previously in Section
2.2.4.1. Null genotypes were scored after GSTP1 amplifications were confirmed (see Figure 6 for schematic representation).
2.2.5.3 GSTM1 Genotyping
GSTM1 genotype was determined by GSTM1 amplification and by CYP2E1
amplification as an internal control reaction. CYP2E1 primers were also included in the PCR mixture as a control to see the independent amplification of each sample. Both reactions were carried out in the same reaction tube. GSTM1 PCR genotyping experiments were performed by using 50-100ng genomic DNA, 10xPCR buffer, 10 pmol of each GSTM1 primers, 20 pmol of each CYP2E1 primers, 200µM dNTP, 1.5 mM MgCl2 in a total volume of 25µl. The amplifications were carried out by the following conditions; 94 oC initial denaturation for 5 minutes followed by 35 cycles of denaturation for 30 seconds at 94 oC, annealing for 30 seconds at 55 oC and extension for 45 seconds at 72 oC, with a final extension at 72 oC for 7 minutes. The expected amplification product was 215 bp in GSTM1 positive individuals. The 412 bp product size for CYP2E1 was expected to be amplified in all samples (see Figure 7 for schematic representation).
53 2.2.6 Statistical Analyses
Statistical analyses were carried out with the Minitab 13.1 software program. 2.2.6.1 Chi-square Test
There are basically two types of random variables yielding two types of data: numerical (e.g. number of children) and categorical (e.g. GSTP1 genotype, whose values are Ile/Ile, Ile/Val, Val/Val). A chi-square (X2) statistic is used to investigate whether distributions of categorical variables differ from one another. The chi-square test is also a test of independence; it provides little information about the strength (e.g. strong, weak, perfect) or form (e.g. positive, negative) of association between two variables (Daniel WW. 1995). It is a series of mathematical formulas which compare the actual observed frequencies (e.g. variable: GSTP1, categories: Ile/Ile, Ile/Val, and Val/Val) with the expected frequencies. That is, the chi-square analysis tests observes results against the null hypothesis (null hypothesis is the hypothesis to be tested) and assesses whether the actual results are different from the expected ones (Daniel WW. 1995). The requirements for the test are:
The sample must be randomly drawn from the population. Data must be reported in raw frequencies (not percentages).
Any observations must fall into only one category or value on each variable. This test should only be used when observations are independent (e.g. no category or response is dependent upon or influenced by another).
Observed frequencies can not be too small. For instance, the GSTP1 105 Val/Val genotype frequency was too low in our population (8.43% in cases and 8.58% in controls). So, the GSTP1 105 Ile/Val and Val/Val genotypes were combined in our study.
The chi-square test is one of the methods of calculating a P value. The P value shows us whether a result is statistically significant. In other situations, to make a decision based on a single comparison, the steps of statistical hypothesis testing must be followed:
A threshold P value must first be settled. The threshold value is traditionally usually set as 0.05.
54 The null hypothesis must be defined. If two means are being compared, the null hypothesis is that the two populations have the same mean.
The chi-square test must be carried out to compute the P value. The P value must be compared to the preset threshold value.
If the P value is less than the threshold, the null hypothesis is rejected and the difference is statistically significant.
If the P value is greater than the threshold, the null hypothesis is not rejected and the difference is not statistically significant, and there sufficient evidence is not present to reject the null hypothesis.
The P value is a probability, with a value ranging from zero to one. If the P value is small, it is concluded that the difference is quite unlikely to be caused by random sampling, and the populations have different means.
If a result is statistically significant, there are two possible explanations: The populations are identical, so there really is no difference. By chance, larger values in one group and smaller values in the other are obtained. Finding a statistically significant result when the populations are identical is called making a Type I error. If statistically significant is defined to mean "P<0.05", then a Type I error is made in 5% of experiments where there really is no difference. The other explanation is that the populations are really different and that the conclusion is correct (Pagano M. and Gauvreau K. 1992).
If a result is not statistically significant, it is also possible that the study missed a small effect due to small sample size and/or large scatter. In this case, a Type II error has been made concluding that there is no difference when in fact there is a difference (Pagano M. and Gauvreau K. 1992).
Statistical calculations combine sample size and variability (standard deviation) to generate a confidence interval (CI) for the population mean. Intervals can be calculated for any desired degree of confidence, but 95% confidence intervals are used most commonly. If many 95% CI from many data sets are generated, the CI is expected to include the true population mean in 95% of the cases and not to include the true mean value in the other 5%.
55 The other most frequent use of chi-square distribution is to test the null hypothesis that two criteria of classification are independent when applied to the same set of entries. According to two criteria, a table in which the rows (r) represent the various levels of one criterion of classification and the columns (c) represent the various levels of the second criterion is prepared. Such a table is generally called a contingency table.
Where the null hypothesis is true, chi-square is distributed approximately with k-r degrees of freedom. In determining the degrees of freedom, k is the number of the groups for which observed and expected frequencies are available, and r is the number of the restrictions or constraints imposed on the given comparison. For the analysis of the contingency tables, in which r rows represent the various levels of one criterion, and the c columns represent the various level of a second criterion, degrees of freedom are calculated as (r-1)(c-1)=df (Pagano M. and Gauvreau K. 1992).
2.2.6.2 Odds Ratio Calculation
There are two types of observational studies: prospective and retrospective case-control studies. The primary difference between the two is the sampling scheme. When sampling is based upon the response variable, the study is called a retrospective study. When sampling is based upon the stimulus variable, the study is called a prospective study. A prospective study is related to the future. The subjects are stratified according to whether they have the risk factor or not. The outcome is evaluated after a certain follow-up period has passed (e.g. after GST genotyping follow-up for 30 years to observe the individuals that will develop breast cancer). A retrospective study is related to past. The persons with the outcome constitute the study group, and whether these subjects have the risk factor or not is determined (e.g. find a breast cancer group and control group, determine if they are postmenopausal or premenopausal, and then carry out GST genotyping). The retrospective or case history studies are relatively quick and inexpensive, easily repeatable and enable a larger number of individuals to be examined (Slome C. 1982). The characteristics of the disease under study plays a role in determining whether a prospective or retrospective study should be employed. The rarer the disease or the longer the
56 interval between the suspected cause and the condition, the more difficult is the cohort study. The term relative risk is used for the risk estimation obtained from prospective studies. It is actually the ratio of the risk of developing a disease among subjects with the risk factor to the risk among subjects without the risk factor. If the data are from a retrospective study, relative risk is not a meaningful measure for comparing the two groups. The appropriate test for comparing cases and controls in a retrospective study is the odds ratio (Rim AA. 1981). In any event, for rare diseases the odds ratio is a close approximation of the relative risk.
The odds ratio can assume a value between zero and infinity. A value of zero is the indicator of no association between the risk factor and disease status. A value greater than 1 indicates a higher risk among cases when compared to controls. The odds ratio takes a value somewhere between the lower and upper limits of the confidence intervals. An odds ratio value greater than 1 is statistically significant, if the lower limit of 95% confidence intervals is greater than 1 (Daniel WW. 1995).
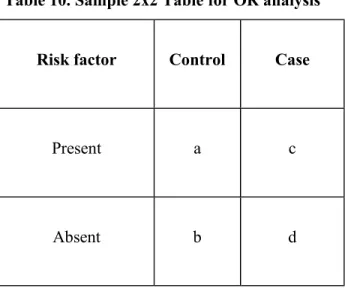
Table 10. Sample 2x2 Table for OR analysis
Risk factor Control Case
Present a c
Absent b d
a: number of controls with the risk factor b: number of controls without the risk factor c: number of cases with the risk factor d: number of cases without the risk factor
57 The following formulas are used for odds ratio calculations, and confidence intervals:
OR=ad/bc
95% CI= e
ln [OR]± 1.96 times square root of (1/A+1/B+1/C+1/D )2.2.6.3. Multivariate Adjusted Odds Ratio Calculation
To measure the relationship between one interval dependent variable (e.g.
GSTP1 genotype) and several independent variables (e.g. age, age at menarche, age
at first full-term pregnancy, number of children, family history of breast cancer) the multiple regression test is used. In this analysis, the independent variables can predict the dependent variables, but the dependent variables can not be used to predict the independent variables. Independent variables should be justified theoretically. The selected independent variables should have strong correlations with the dependent variable but only weak correlations with other independent variables. Each independent variable should have the same relationship with the dependent variable at each value of other independent variables. Multiple regression modeling is used to determine what variables contribute to the explanation of the dependent variable and to what degree. A theoretically well-defined model when applied to analysis, the adjusted odds ratio is a valuable statistical tool.
2.2.6.4. Gene-environment, Gene-gene Interaction Analyses
If cases or controls that are being compared differ in any characteristic that is related to the disease (in this instance breast cancer) and to the exposure (or potential risk factor or cause), then these differences must be taken into account when making these comparisons (Dunning MA. et al. 1999).
A case control study group is designed to investigate the presence of an interaction between a genetic and environmental factor. The environmental (E=e) and genetic factors (G=g) are binary variables that take values of 1 for exposed (e.
58 high BMI) or susceptible (e.g. the combination of GSTP1 105 Ile/Val or Val/Val genotypes), and 0 for unexposed (e.g. low BMI) or not susceptible (e.g. GSTP1 Ile/Ile). Disease status (D=d) takes a value of 1 for affected (breast cancer patients) and 0 for the unaffected (age-matched control) (Garcia-Closas M. et al. 1999). The odds ratio OReg is the measure of association between disease and environmental and genetic factors.
The multiplicative interaction parameter is Ψ. In the absence of a multiplicative interaction, Ψ=1 (Table 11).
The additive interaction parameter is Φ. In the absence of an additive interaction Φ=1 (Table 11).
The odds ratio for the reference group (e.g. 00 individuals) is 1, since the odds ratio for this group is calculated by comparing the reference group by itself. The odds ratios were calculated by comparing the reference group (the individuals inheriting no risk genotypes) to the others respectively.
For gene-gene interaction (the combined effects of studied genes) analysis, the same method can be used. However, that time the environmental (E=e) factor is replaced with the genetic factor. These binary variables take values of 1 for both susceptible (e.g. GSTM1 null genotype or GSTT1 null genotype), and 0 for both not susceptible cases (e.g. GSTM1 positive or GSTT1 positive).
59 Table 11: Definition of ORs (OR01, OR10, OR11) and interaction parameters (Ψa,Φa) for the relations of two dichotomous environmental and genetic factors and cancer. Genetic factor (G) G = 0 G = 1 E = 0 1.0a OR01 Environmental factor E = 1 OR10 OR11 Ψ = —————— Φ = ————————— Raeference category OR11 OR10 . OR01 (OR11 – 1) (OR10 – 1) + (OR01 – 1)
60
3. RESULTS:
We examined associations for gluthathione S-transferases M1 (GSTM1), T1 (GSTT1), and P1 (GSTP1) genotypes and breast cancer risk in the Turkish population. Genotyping for GSTs was conducted on 264 breast cancer cases and 233 age-matched controls. A group of randomly selected university students (n=77) was also genotyped to compare with the age-matched control group.
The nucleotide polymorphisms were identified by PCR assays for GSTM1 and GSTT1 genes. The examples of PCR analysis for GSTM1 and GSTT1 genotyping are shown in Figures 8 and 10. GSTP1 polymorphism was identified by restriction enzyme site digestion of the GSTP1 PCR product. An example of the result of this genotyping analysis is shown in Figure 9.
All 264 breast cancer patients and 233 control groups were subjected to genotyping analysis, the results were scored and the frequencies of the GSTM1,
GSTT1, and GSTP1 genotypes were compared. The characteristics of the participants
in this study have been described in Table 12. The mean age was 49.29 (SD: 13.83, range: 20-80) for cases and 46.15 years (SD: 14.11, range: 15-83) for controls, contributing to a higher proportion of cases (60.54%) than controls (47.64%) being postmenopausal. The mean age was 13.65 (SD: 1.44) at menarche, and 21.78 (SD: 4.73) at first birth while the mean number of children was 2.95 (SD: 2.16) for the cases. For the control group, the mean age was 13.86 (SD: 1.42) at menarche and 20.52 (SD: 3.93) at first birth while the mean of number of children was 3.03 (SD: 2.12). The mean BMI was 24.48 (SD: 4.72) for the cases and 26.96 (SD: 4.92) for the controls. The risk of breast cancer was higher for women who had a BMI ≥ 26.96 (the mean BMI of controls) (OR= 1.76; 95% CI= 1.23-2.52). The breast cancer risk was also higher for postmenopausal cases (OR= 1.69; 95% CI=1.18-2.42). The risk of breast cancer was slightly increased for women whose age at menarche was ≤ 12 (OR= 1.33; 95% CI=0.81-2.18). The risk of breast cancer was 3.80 times higher for women who had first-degree relatives with breast cancer (OR= 3.80; 95% CI=1.51-9.55). There was a slight increased case-control difference in the association between high BMI and postmenopausal status in the Turkish population for breast cancer (OR= 1.26; 95 % CI=0.77-2.05) (Table 12).
The distribution of GSTM1, GSTP1, and GSTT1 genotypes in the breast cancer patients and age-matched controls by menopausal status, and multivariate