IN-SITU FT-IR SPECTROSCOPIC INVESTIGATION of
NO
x+ CH
4SURFACE REACTIONS on PALLADIUM PROMOTED
WO
3/TiO
2-ZrO
2MIXED OXIDES
A THESIS
SUBMITTED TO THE DEPARTMENT OF CHEMISTRY
THE INSTITUTE OF ENGINEERING AND SCIENCES OF BILKENT
UNIVERSITY
IN PARTIAL FULFILLMENT OF THE REQUIREMENTS
FOR THE DEGREE
OF
MASTER OF SCIENCE
By
ANIL A IRAL
I certify that I have read this thesis and in my opinion it is fully adequate, in scope and in quality, as a thesis of the degree of Master of Science
__________________________________ Assoc. Prof. Margarita Kantcheva (Supervisor)
I certify that I have read this thesis and in my opinion it is fully adequate, in scope and in quality, as a thesis of the degree of Master of Science
__________________________________ Assoc. Prof. Ömer Da
I certify that I have read this thesis and in my opinion it is fully adequate, in scope and in quality, as a thesis of the degree of Master of Science
_______________________________ Assoc. Prof. Gürkan Karaka
I certify that I have read this thesis and in my opinion it is fully adequate, in scope and in quality, as a thesis of the degree of Master of Science
__________________________________ Assoc. Prof. Ahmet Oral
I certify that I have read this thesis and in my opinion it is fully adequate, in scope and in quality, as a thesis of the degree of Master of Science
__________________________________
Assist. Prof. Dönü Tuncel
Approved for the Institute of Engineering and Sciences
__________________________________ Prof. Dr. Mehmet Baray
ABSTRACT
IN-SITU FT-IR SPECTROSCOPIC INVESTIGATION of
NOx + CH4 SURFACE REACTIONS on PALLADIUM PROMOTED WO3/TiO2-ZrO2 MIXED OXIDES
ANIL A IRAL M.Sc. in Chemistry
Supervisor: Assoc. Prof. Margarita Kantcheva June 2005
The interaction of methane at various temperatures with NOx species formed by room
temperature adsorption of NO/O2 mixture on tungstated zirconia-titania (25 wt % of WO3,
denoted as WZT) and palladium(II)-promoted (1.5 wt % of Pd) zirconia-titania (1.5Pd/ZT) and tungstated zirconia-titania (1.5Pd/WZT) is investigated using in situ FTIR spectroscopy.
The structure and surface properties of ZT, WZT, 1.5Pd/ZT and 1.5Pd/WZT are studied by XRD, DR-UV-Vis spectroscopy and FT-IR spectroscopy of adsorbed CO and NO. Zirconia-titania was prepared by a homogenous coprecipitation of urea at 70oC. Formation of crystalline ZrTiO4 compound at calcination temperature of 600oC is observed. Based on the
data of XRD and DR-UV-Vis spectra, very good mixing of oxides has been achieved with high surface area (118 m2/g) and small crystallite size (4.4 nm). The WZT sample has paratungstate type polytungstate species forming intermediate WOx surface domains which
give rise to strong Brønsted acidity. Pd-containing samples were prepared impregnating the ZT and WZT samples with Pd(NO3)2.2H2O solution. The WZT support can stabilize isolated
Pd2+ ions coordinated to surface oxygen atoms.
The spectrum of CO adsorbed on the ZT sample reveals the presence of coordinatively unsaturated (cus) Zr4+ and Ti4+ sites. Their amount decreases considerably after the modification of the sample with WO3. The adsorption of CO and NO on the 1.5Pd/ZT and
1.5Pd/WZT samples indicates the presence of palladium ions in two different environments. The adsorption of NO at room temperature on the samples studied involves process of disproportionation of NO on surface oxide ions leading to formation of adsorbed anionic nitrosyl, NO , and NO2.
The addition of molecular oxygen to the NO causes its oxidation to NO2/N2O4. These
gases adsorb molecularly over the surface and undergo self-ionization and disproportionation with the participation of surface hydroxyl groups. Introduction of WOx species and Pd2+ ions
to the zirconia-titania mixed oxide hinders the processes of NO2/N2O4 self-ionization and
disproportionation by elimination of the necessary active sites.
NOx species formed at room temperature on the WZT and 1.5Pd/ZT samples suppress
the oxidation of the methane, whereas in the case of the 1.5Pd/WZT catalyst the surface nitrates initiate the formation of nitromethane. Mechanism for the reduction of NO over the 1.5Pd/WZT catalyst is proposed, which involves a step of thermal decomposition of the nitromethane to adsorbed NO and partially oxidized hydrocarbons (methoxy and/or formate species) through the intermediacy of cis-methyl nitrite. The reduction of the adsorbed NO by the partially oxidized hydrocarbons leads to the products of the CH4-SCR, molecular nitrogen
and carbon oxides. Under in situ conditions, nitromethane and cis-methyl nitrite are stabilized on the surface of the 1.5Pd/WZT catalyst, whereas the adsorption of the authentic reagent results in adsorbed nitromethane and its trans isomer. It is concluded that nitromethane formed in situ and authentic nitromethane follow different decomposition routes.
Keywords: In situ FT-IR; Pd promoted zirconia-titania; Tungstated zirconia titania; Mixed
oxides; Reactivity of stable surface NOx compounds; NOx; Selective catalytic reduction by
ÖZET
PALADYUM DEPOLANMI WO3/TiO2-ZrO2KARI IM OKS T KATAL ZÖRÜNÜN YÜZEY NDE GERÇEKLE EN NOX + CH4 REAKS YONLARININ IN-SITU FT-IR
SPEKTROSKOP ile NCELENMES
ANIL A IRAL Kimya Bölümü Yüksek Lisans
Tez Yöneticisi: Doç. Dr. Margarita Kantcheva Haziran 2005
Oda s cakl nda tungstenlenmi zirkonyum oksit-titanyum oksit (a rl kça 25 % WO3,
WZT olarak k salt ld ), paladyum depolanm zirkonyum oksit-titanyum oksit (a rl kça 1.5 % Pd, 1.5Pd/ZT) ve paladyum depolanm tungstenlenmi zirkonyum oksit-titanyum oksit (1.5Pd/WZT) katalizörleri yüzeyinde NO ve O2’in ortak adsorpsiyonu ile olu an NOx
komplekslerinin de ik s cakl klarda metan ile etkile imi in situ FTIR spektroskopisi ile incelendi.
ZT, WZT, 1.5Pd/ZT and 1.5Pd/WZT numunelerinin yap sal ve yüzey özellikleri XRD, DR-UV-Vis ile CO ve NO’in adsorpsiyonunun FTIR spektroskopisi yöntemleriyle incelendiler. Zirkonyum oksit-titanyum oksit 70oC’de üre çözeltisinin içinde ortak çökelme yöntemiyle haz rland . 600oC’de f nlama i leminden sonra ZrTiO4 kristal faz n olu umu
gözlendi. XRD ve DR-UV-Vis spektroskopisi verileri nda, oksitlerin çok iyi kar arak yüksek yüzey alan (118m2/g) ve küçük kristal boyutu (4.4 nm) elde edildi. WZT numunesi paratungsten tipinde yüksek Brønsted asiditesine sahip orta yo unlukta tungsten gruplar olu turur. ZT ve WZT numunelerine Pd(NO3)2.2H2O çözeltisi sulu ekleme yöntemiyle
eklenerek paladyumlu numuneler haz rland . WZT numunesinin Pd2+ iyonlar yaln z ba lar na yüzeydeki oksijen atomlar na ba layarak kararl hale getirebildi i görüldü.
ZT numunesine CO adsorpsiyonu koordinasyona aç k Zr4+ ve Ti4+ iyonlar n varl gösterdi. Bu iyonlar n yo unlu u numuneye WO3 eklenmesiyle azald . 1.5Pd/ZT ve
1.5Pd/WZT numunelerine CO ve NO adsorpsiyonu koordinasyona aç k iki çe it Pd2+ iyonlar oldu unu gösterdi.
Oda s cakl nda NO’in numunelere adsorpsiyonu sonucu bu molekül yüzeydeki oksijen iyonlar taraf ndan bozunarak anyonik nitrozil, NO- ve NO2’i olu turdu.
NO, oksijen taraf ndan oksitlenerek NO2/N2O4 ikilisini olu turur. Bu gazlar yüzeye
molekül düzeyinde ba lanarak hidroksil gruplar n da katk yla iyonla arak bozunmaya ba lad lar. WOx gruplar n ve Pd2+ iyonlar n zirkonyum oksit-titanyum oksit numunesine
eklenmeleri yüzeydeki aktif bölümlerin kaybolmas sonucu NO2/N2O4 ikilisinin bozunma
derecelerini kar m oksite nazaran azaltt .
Oda s cakl nda olu an NOx kompleksleri metan n oksidasyonunu WZT ve 1.5Pd/ZT
numunelerinde azaltmas na kar k, 1.5Pd/WZT katalizörü yüzeyinde nitrometan n olu mas ba lat r. 1.5Pd/WZT katalizörü yüzeyinde NO’in indirgenme mekanizmas önerildi. Bu mekanizma nitrometan n cis-metil nitrit üzerinden NO’e ve k smi yükseltgenmi hidrokarbonlara (metoksi ve/veya format iyonlar na) termal bozunmas içermektedir. Yüzeye ba lanm NO’in k smi yükseltgenmi hidrokarbonlarla indirgenmesi sonucu seçici katalitik indirgenme ürünleri olan moleküler nitrojen ve karbon oksitler olu tu. Seçici katalitik indirgenme reaksiyonu ko ullar nda (in-situ) olu an nitrometan ve cis-metil nitrit yüzeye daha kararl ba lan rken, nitrometan n yaln z ba na adsorpsiyonu adsorbe olmu nitrometan ve onun trans izomerinin varl gösterdi.
Anahtar Kelimeler: In situ FT-IR; Pd depolanm zirkonyum oksit-titanyum oksit;
Tungstenlenmi zirkonyum oksit-titanyum oksit; Kar m oksitler; Kararl NOx bile iklerinin
ACKNOWLEDGMENT
I would like to express my sincere thanks and gratitude to my supervisor, Assoc. Prof. Margarita Kantcheva for all her guidance and encouragement she has offered me throughout the period of this research.
I would like to thank all present and former members of Bilkent University Department of Chemistry for their support and help.
TABLE OF CONTENTS
1. INTRODUCTION 1
1.1. An environmental problem: NOx emission……….1
1.2. Catalytic Emission Control……….3
1.3. SCR of NOx with Methane……….6
1.4. Reaction Mechanism of SCR of NOx by Methane in Excess O2…………...7
1.5. Metal Oxide Supports for CH4-SCR Catalysts………...9
1.6. FTIR Spectroscopy and Aim of the Study……….11
1.7. Identification of Adsorbed NOx-Species by FTIR Spectroscopy…………..12
2. EXPERIMENTAL 14
2.1. Sample Preparation……….14
2.2. Surface Area Measurements, X-ray Diffraction and Diffuse Reflectance UV-Visible Spectroscopy………..16
2.3. FTIR Spectroscopy……….16
2.4. Experimental Setup……… 16
2.5. Activation of the Samples………...16
2.6. Adsorption of NO and Co-adsorption with O2………...18
2.7. Interaction of CH4 with the Catalysts……….18
2.8. Interaction of CH4 with NOx– precovered catalysts………..19
2.9. Adsorption of CH3NO2………...19
3. RESULTS AND DISCUSSION 20
3.1. Characterization of the Samples………..20
3.1.1. BET Surface Area Measurements……….20
3.1.2. X-ray Diffraction………...20
3.1.2.1.Titania-Zirconia Mixed Oxides………...20
3.1.2.2. Tungstated Titania-Zirconia………...22
3.1.2.3. Pd promoted Tungstated Titania-Zirconia………..24
3.1.4. Discussion of the Catalyst Structure………28
3.1.5. FTIR Spectra of the activated samples……….29
3.1.6. Adsorption of CO……….31
3.2. NO and NO/O2 Adsorption……….32
3.2.1. Adsorption of NO……….32
3.2.2. Coadsorption of NO/O2………36
3.2.3. Summary of the Results on NO and NO/O2 Adsorption on the Samples Studied………..40
3.3. Reactivity of the adsorbed NOx species toward methane………41
3.3.1. Blank NOx Experiment……….41 3.3.1.1. WZT Sample………..41 3.3.1.2 1.5Pd/ZT Sample……….43 3.3.1.3 1.5Pd/WZT Sample……….45 3.3.2. Blank CH4 Experiment………..46 3.3.2.1. 1.5Pd/ZT Sample………46 3.3.2.2. WZT and 1.5Pd/WZT Samples………..48
3.3.3. Interaction of Preadsorbed NOx species with Methane……….50
3.3.3.1. WZT Sample………...50
3.3.3.2. 1.5Pd/ZT Sample……… 52
3.3.3.3. 1.5Pd/WZT Sample……….55
3. 4. Summary of the Results on the Reactivity of Adsorbed NOx Species toward Methane ………...62
4. CONCLUSIONS 65
LIST OF TABLES
1. Solid superacids and their acid strength……….10
2. Frequencies of adsorbed NOxspecies observed on metal oxides………13
3. Catalysts and notations. All the samples were calcined at 500oC………...15
4. BET surface areas and tungsten density……….20
5. Calculated crystallite sizes of ZrTiO4………..22
6. Calculated crystallite sizes of WZT……….23
7. Edge energies, their corresponding transitions and the electronic structural properties..27
8. Assignments of the FTIR bands observed upon room-temperature adsorption of NO on the samples studied………...35
9. Assignments of the FTIR bands observed upon room-temperature coadsorption of NO and O2 on the samples studied………...39
LIST OF FIGURES
1. Production of NO, CO and HCs over a wide range of air to fuel ratios………2
2. Dual-bed emission control……….3
3. Typical SCR system with operating data………...5
4. Brønsted and Lewis acid sites on binary and tungstated binary oxides………...11
5. IR cell (A: Thermocouple entrance, B: Vacuum/Adsorption line connection, C: Heating filaments, D: Cooling pipes, E: BaF2 windows, F: MCT Detector)…………..17
6. Vacuum/adsorption apparatus ( A: Rotary pump, B: Diffusion pump, C: Liquid nitrogen trap, D: Adsorption pipes)……….18
7. Powder X-ray diffraction patterns of ZT samples calcined at different temperatures…...21
8. Powder X-ray diffraction patterns of 25WZT samples calcined at different temperatures. Characteristic lines due to ( ) ZrTiO4; ( ) Zr(WO4)2; (x) WO3……...……23
9. Powder X-ray diffraction pattern of 1.5Pd/WZT samples calcined at 700oC………...…...24
10. UV-vis diffuse reflectance spectra of the calcined Pd promoted samples………..28
11. (A) FTIR spectra of activated samples of ZT, WZT and 1.5Pd/WZT in the 4000 -1000 cm-1. (B) Spectra of ZT, TiO2 and ZrO2 in the OH-stretching region……….30
12. (A) FTIR spectra obtained upon adsorption of CO (20 Torr) for 30 min at room temperature on TiO2, (B) on ZrO2, (C) on ZT, WZT and 1.5Pd/WZT, (D) Spectra after evacuation for 30 min at room temperature. The spectrum of the activated sample is used as a background reference. Gas phases are subtracted from spectra………...31
13. (A) FTIR spectra of NO (10 Torr) adsorbed on ZT, WZT, 1.5Pd/ZT and 1.5Pd/WZT samples at room temperature for 25 min. (B) After evacuation for 30 min at room temperature. The spectrum of the activated sample is used as background reference. Gas phases are subtracted from spectra……….34
14. (A) FTIR spectra of NO (10 Torr) adsorbed on ZT, WZT, 1.5Pd/ZT and 1.5Pd/WZT samples at room temperature for 25 min. (B) After evacuation for 30 min at room temperature. (C) Gas phase spectrum of the corresponding spectrum shown on panel A. The spectrum of the activated sample is used as background reference. Gas phases are subtracted from spectra……….36
15. (A) FTIR spectra of WZT sample taken after adsorption of NO/O2mixture
for 30 min (a), after heating the closed IR cell for 15 min at 250oC (b), at 300oC (c), at 350oC (d), at 400oC (e), at 450oC (f), then cooling to room temperature (g) and evacuation at room temperature for 30 min (h). The spectrum of the activated sample is used as background reference. Gas phases are subtracted from spectra.
Spectra a is divided by 4 to display the bands with small intensity in the frame.
(B) Gas phase spectrum of the corresponding spectrum shown on panel A……….42 16. (A) FTIR spectra of 1.5Pd/ZT sample taken after adsorption of NO/O2mixture
(10 Torr NO + 6 Torr O2) at room temperature followed by evacuation for
30 min (a), after heating the closed IR cell for 15 min at 200oC (b), at 250oC (c), at 300oC (d), at 350oC (e), at 400oC (f), at 450oC (g), then cooling to room temperature (h) and evacuation at room temperature for 30 min (i). The spectrum of
the activated sample is used as background reference. Gas phases are subtracted from spectra. Spectra a,b,c and d are divided by 4 to display the bands with small intensity in the frame.
(B) Gas phase spectrum of the corresponding spectrum shown on panel A………44 17. (A) FTIR spectra of 1.5Pd/ZT sample taken after adsorption of NO/O2mixture
(10 Torr NO + 6 Torr O2) at room temperature followed by evacuation for
30 min, after heating the closed IR cell for 15 min at 200oC-350oC then
cooling to room temperature and evacuation at room temperature. The spectrum of the activated sample is used as background reference. Gas phases are subtracted from spectra. Room temperature spectrum is divided by 5 to display the bands with small intensity in the frame. (B) Gas phase spectrum of the corresponding
spectrum shown on panel A……….45 18. FTIR spectra of 1.5Pd/ZT sample taken after addition of methane (40 Torr)
at room temperature and after heating the closed IR cell for 15 min at 200oC (a), at 250oC (b), at 300oC (c), 350oC (d), 400oC (e), 450oC (f)
then cooling to room temperature (g), and evacuation at room temperature for
30 min (h). The spectrum of the activated sample is used as background reference………47 19. (A) FTIR spectra of WZT and (B) 1.5Pd/WZT samples taken after addition
of methane (40 Torr) at room temperature and after heating the closed IR cell for 15 min at 200oC (a), at 250oC (b), at 300oC (c), 350oC (d), 400oC (e),
450oC (f). The spectrum of the activated sample is used as background reference………..48 20. FTIR spectra of taken from “Blank CH4” experiment after cooling the
(b) and for the 1.5Pd/WZT sample (c)………..49 21. (A) FTIR spectra of the WZT catalyst taken after adsorption of NO/O2
mixture (10 Torr NO + 6 Torr O2) at RT followed by evacuation for 30
min and addition of 40 Torr of CH4 (a), after heating the closed IR cell for
15 min at 250oC (b), at 350oC (c), at 450oC (d) and cooling to room
temperature (e) then evacuation of the gas phase at RT (f). Spectra a and b are divided by 5 to display the bands with small intensity in the frame. The spectrum of
activated sample is used as a background reference. Gas phases are subtracted from spectra. (B) Gas phase spectrum of the corresponding spectrum shown on panel A……….50 22. FTIR spectra of the WZT catalyst taken from the “Blank CH4” (a), the
interaction of the preadsorbed NOx with CH4 (b) and the “Blank NOx” (c)
experiments after the evacuation at room temperature. The spectrum of activated
sample is used as a background reference. Gas phases are subtracted from spectra……...52 23. (A) FTIR spectra of the 1.5Pd/ZT catalyst taken after adsorption of NO/O2
mixture (10 Torr NO + 6 Torr O2) at RT followed by evacuation for 30 min and
addition of 40 Torr of CH4 (a), after heating the closed IR cell for 15 min
at 250oC (b), at 300oC (c), at 350oC (d) at 400oC (e), at 450oC (f) and cooling to room temperature (g) then evacuation of the gas phase at RT (h). Spectra a and b are divided by 5 to display the bands with small intensity
in the frame. The spectrum of activated sample is used as a background reference. Gas phases are subtracted from spectra. (B) Gas phase spectrum of the corresponding spectrum shown on panel A……….53 24. FTIR spectra of the 1.5Pd/ZT catalyst taken from the “Blank CH4” (a),
the interaction of the preadsorbed NOx with CH4 (b) and the “Blank NOx”
(c) experiments after the final evacuation at room temperature.
The spectrum of activated sample is used as a background reference……….. .54 25. (A) FTIR spectra of the “Blank NOx” experiment of 1.5Pd/WZT catalyst.
(B) FTIR spectra of the 1.5Pd/WZT catalyst taken after adsorption of NO/O2 mixture
(10 Torr NO + 6 Torr O2) at RT followed by evacuation for 30 min and
addition of 40 Torr of CH4 (a), after heating the closed IR cell for 15 min
at temperatures 200oC-450oC and cooling to room temperature followed by evacuation of the gas phase. (C) Gas phase spectrum of the corresponding spectrum shown on panel B. Room temperature spectra of panel A and B are
divided by 5 to display the bands with small intensity in the frame………55 26. FTIR spectra of the 1.5Pd/WZT catalyst taken from the “Blank CH4” (a),
the interaction of the preadsorbed NOx with CH4 (b) and the “Blank NOx” (c)
experiments after the cooling IR cell to room temperature. The spectrum of activated sample is used as a background reference. Gas phases are subtracted from spectra………57 27. (A) FTIR spectra of WZT sample taken after adsorption of CH3NO2(1.5 Torr)
at room temperature (a) followed by heating the closed IR cell for 15 min at 150 oC (b), at 200oC (c), at 250oC (d), at 300oC (e), and at 350oC (f).
Spectrum a is divided by 2………...58 28. FTIR spectra of 1.5Pd/WZT sample taken after adsorption of CH3NO2
(1.5 Torr) at room temperature (a) followed by heating the closed IR cell for 15 min at 150 oC (b), at 200oC (c), at 250oC (d), at 300oC (e), and at 350oC (f).
1. INTRODUCTION
1.1. An environmental problem: NO
xemission
Flame combustion of fossil fuels leads to reaction between carbon containing constituents of the fuel and the oxygen of the air
CmHn
+ (m + n/4)O
2(m)CO
2+ (n/2)H
2O
(1)
Carbon dioxide and water are the main products of this reaction but emission of unburned hydrocarbons and intermediate oxidation products like alcohols, aldehydes and carbon monoxide are formed as side products due to incomplete combustion.
During flame combustion, temperature reaches 1700 K and at this temperature, formation of nitrogen oxides from air constituents nitrogen and oxygen is thermodynamically favored according to the reaction [1]
N
2+ O
22NO
(2)
NO is a well known atmospheric pollutant and it reacts with photochemical pollutants like carbonyl containing molecules, alcohol radicals, ozone, organic hydroperoxides and peroxyacyl nitrates to generate more nitrogen oxides and organic nitrates [2]. NO2 which is an oxidation
product of NO, contributes to acid rain and urban smog; the reaction involving ozone depletes the ozone layer [3] and unburned hydrocarbons in polluted air interact in the photolytic cycle of NO to generate ground level ozone [4].
NOx emission sources are internal combustion engines, industrial boilers, power plants,
waste incinerators, gasifiers, engines and gas turbines or from decomposition of a large number of organic products by light or micro-organisms [2]. According to report of US Department of Energy [5], annual world production of NOx is over 30 million metric tons (mmt) of which 21
mmt is produced in the USA and 95 % comes from vehicles and power sources.
In vehicle engines, the emission of carbon monoxide , hydrocarbons (HC) and nitrogen oxides depends on the engine air-to-fuel ratio (A/F), defined as
Mass of air consumed by the engine
A/F =
(3)
When there is just enough air for complete combustion of all hydrocarbons in the fuel, A/F is 14.7 . If A/F ratio is below 14.7 (rich conditions), incomplete fuel combustion occurs under excess fuel conditions. The exhaust gas includes more reducing gases (CO, HC) than oxidizing gases (O2, NOx). When A/F is higher than 14.7 (lean conditions), exhaust gas will contain more
oxidizing reactants than reducing reactants [1]. The graph below shows the dependence on air-fuel ratio in a schematic manner.
Figure 1. Production of NO, CO and HCs over a wide range of air to fuel ratios [6].
Actual engine A/F
Lambda =
(4)
Stoichiometric engine A/F
Various reactions occur for the removal of CO, hydrocarbon and nitrogen oxide in engine-out exhaust gas. These are:
(1) Reactions with oxygen
C
mH
n+ (m + 0.25n)O
2mCO
2+ 0.5nH
2O
(5)
CO + 0.5O
2CO
2(6)
H
2+ 0.5O
2H
2O
(7)(2) Reactions with NO
NO + H
20.5N
2+ H
2O
(9)
C
mH
n+ 2(m + 0.25n)NO
1(m + 0.25n)N
2+ 0.5nH
2O + mCO
2(10)
Emission control systems should promote these reactions in order to remove carbon monoxide, hydrocarbons and nitrogen oxides from engine-out exhaust gas.
It is important to remove NOx emission from stationary sources such as industrial boilers,
power plants, incinerators and gas turbines. In the next section, the catalytic approach for the control of nitrogen compounds to avoid emissions of NOx will be given for mobile and stationary
sources.
1.2. Catalytic Emission Control
For vehicle engines, three-way catalyst (TWC) system can promote the reactions (5-10) for the removal of carbon monoxide, hydrocarbons and nitrogen oxides. Several exhaust gas components, HC, CO and NOx, are reduced simultaneously if the combustion can be controlled at
stoichiometric conditions. The TWC converter uses two different types of catalysts, a reduction catalyst and an oxidation catalyst. Both types consist of a ceramic structure coated with a metal catalyst, usually platinum, rhodium and/or palladium. Figure 2 shows a schematic picture of dual-bed emission control which maintains high conversion efficiency for the three exhaust gas constituents.
Figure 2. Dual-bed emission control [7].
Whereas the TWC technology is accepted for limiting the emission of carbon monoxide and hydrocarbons, it is inefficient to remove NOx for the lean-burn and diesel engines. Possibility
to lower engine-out emission of NOx using exhaust gas recirculation systems is omitted because
Selective catalytic reduction (SCR) process is one solution to reduce NOx emission by
catalyst after treatment. In this process ammonia or a substance that forms ammonia in situ is used as a reducing agent, however, this technology can not be applied to passenger cars.
According to thermodynamics, in the exhaust gas composition NO is unstable with respect to N2 and O2and at typical engine operating conditions direct decomposition of NO,
NO 0.5N2 + 0.5O2 (11)
additionally, SCR by hydrocarbons,
(6m+2)NO + 2CmH2m+2 (3m+1)N2 + 2mCO2 + (2m+2)H2O (12)
are thermodynamically feasible [1, 8, 9]. Up to now, no heterogenous catalyst has been found to catalyze direct decomposition of NO. SCR with hydrocarbons gave promising results to promote the reaction (12).
The selective catalytic reduction (SCR) of NO with ammonia has been extensively studied as a catalytic technology for NOx elimination from stationary sources [2]. The SCR process is
based on the reaction between NOx and NH3, injected into the flue gas stream, to produce water
and nitrogen. The SCR catalyst is designed to promote the selective low temperature (300o C-400oC) reaction of NOx and ammonia (NH3), converting to nitrogen and water vapor via the
following reactions (10)
4NO + 4NH3 + O2 4N2 + 6H2O (13)
2NO2 + 4NH3 + O2 3N2 + 6H2O (14)
The SCR technology uses ammonia injection into the process stream prior to this catalytic reaction. When molecules of NOx, ammonia and oxygen simultaneously contact the "catalytic
site", the SCR reaction takes place converting NOx and ammonia to nitrogen and water vapor. As
this is an exothermic reaction, a small amount of heat is released to the stream, thereby increasing the temperature of the stream. Catalytic tests performed with various oxide catalysts for the selective reduction of NO with ammonia indicated that vanadia supported catalysts are the most active and selective giving excellent results.
Figure 3 shows a typical SCR system for the abatement of NOx. First the SCR catalyst bed
is heated to operating temperature and gaseous or liquid ammonia is injected into the flue gas stream then ammonia is adsorbed onto the catalyst surface. Finally ammonia on the catalyst surface reacts with NOx in the presence of oxygen to form water and molecular nitrogen
Figure 3. Typical SCR system with operating data [11].
The SCR of nitrogen oxides with ammonia is a wide-spread technology but it has some disadvantages. The amount of ammonia injected into the NOx stream is a critical operating
parameter. The required ratio of ammonia to NOxshould be stoichiometric. The ratio of ammonia
to NOx must be maintained to assure high levels of NOx reduction, while also assuring that too
much ammonia is not present. Ammonia that is not reacted will slip through the SCR catalyst bed and exhaust to atmosphere and this can create a new environmental problem [12].
N2O is formed as a product of the SCR reaction [13], even though it is a strong
greenhouse gas and contributes to the depletion of the stratospheric ozone layer. At present there is no legislation concerning N2O concentration limits, although this is expected to change in the
near future.
There are also technical problems arising from catalyst plugging by fine particle dust, catalyst poisoning by SO2, conversion of SO2 to SO3, formation of ammonium bisulfate and the
deposition of ammonium bisulfate on the catalyst at temperatures below 270°C. All these factors lead to catalyst deactivation [14].
Recently, much attention has been directed to the selective catalytic reduction (SCR) of NO using hydrocarbons as reductants in the presence of excessive oxygen. Research in this area has been focused on the SCR of NO with methane due to the fact that methane is the main component of natural gas and exists in most combustion exhausts [15]. The overall reaction for the CH4-SCR technique is [16]
The reaction of NOx with CH4 removes both of environmental pollutants which cause
greenhouse effect. Another advantage is that CH4 is cheaper than ammonia and its transportation
is much safer because methane sources are in close proximity to the stationary sources. For the usefulness in practical applications, methane should be shown to have reduction efficiencies similar to those of ammonia.
1.3. SCR of NO
xwith Methane
The reaction of SCR of nitrogen oxides by hydrocarbons was discovered independently by Iwamoto et al. [17, 18] and Held et al. [19, 20]. Different kinds of solid catalysts like simple and mixed metal oxides, zeolites and platinum group metals were tested.
Li and Armor [16] used metal exchanged zeolites for NO reduction with methane in the presence of excess oxygen. The catalysts they used were ZSM-5 and zeolite Y exchanged with Co2+, Cu2+, Fe2+, Cr3+ and Na+. They reported that Na+ exchanged ZSM-5 (Na-ZSM-5) is inactive whereas the activity increases in the order Cr < Fe < Cu < Co and selectivity of CH4 over a
Co-ZSM-5 catalyst decreases with increasing concentration of oxygen in the feed. Cu-Co-ZSM-5, that is a unique catalyst for the direct nitric oxide decomposition, is found to be a poor catalyst for nitric oxide reduction by methane in the presence of excess of oxygen. The apparent reaction order of NO and CH4 over Co-ZSM-5 catalyst were 0.44 and 0.56, respectively.
Co-ZSM-5 is very active for removal of NO at 723 K [21]. Yokoyama and Misono [22] proposed that Ce-exchanged ZSM-5 was more active than Cu-ZSM-5 at 573 K. Li and Armor [23] concluded from their studies that Ga-containing H-ZSM-5 has comparable activity with Co-ZSM-5 and gallium catalysts are more selective than cobalt catalysts when water is absent in the feed. Activity is decreased by the water vapor in the feed more, as compared to Co-ZSM-5.
Nishizaka and Misono [24] studied the reduction of methane over H-ZSM-5 catalyst as a function of temperature for four metal containing catalyst. The sequence of increasing activity is Pd > Ru > Pt > Cu. They observed a conversion of about 70% for NO and 65% for CH4 at 723 K
for Pd/H-ZSM-5 and Pd-Ce/H-ZSM-5.
For the practical implementation of metal zeolite catalysts for NO reduction, catalyst durability is very important. However, steam which is unavoidably present in combustion gases irreversibly deactivates zeolite catalysts above a certain temperature [25-27]. Deactivation is due to dealumination of zeolite and this results the loss of ion-exchange capacity which causes an
irreversible change in activity and selectivity. In addition to water vapor, SO2 in the feed stream
shows a moderate poisoning effect.
In conclusion, zeolite based catalysts have serious drawbacks due to their diminished activity by wet conditions. Due to these problems, studies on metal-loaded oxide catalysts have found renewed interest
A number of different metal oxides have been shown to exhibit activity in the catalytic reduction of NOx with methane [2, 9]. A few of them selectively reduce NOx in the presence of
excess oxygen. These materials are alkaline earth and rare-earth oxides [28-30] (e.g. Li/MgO and Sr/La2O3), Group IIIB [31] and supported transition metal oxides [32-35]. Comparing to zeolitic
systems, these catalysts have better thermal stability, higher water resistivity and lower activity. In recent years, Pd catalysts have been found to be highly selective in the presence of excess oxygen (i.e. [O2]/[CH4] > 2). Several authors [24, 36, 37, 38] have shown that when Pd is
supported on acidic materials it can be active for the selective reduction of NO with CH4. When
Pd catalysts are tested under SCR with CH4, their performance could vary from inactive to active
but unselective, passing through highly selective. This performance depends on the metal loading and support acidity [36, 39]. Pd particles are transformed into PdO clusters which are very active for methane combustion. High selectivity of low-loading Pd catalysts supported on acidic materials is ascribed to the stabilization of the Pd2+ ions [40].
1.4. Reaction Mechanism of SCR of NO
xby Methane in Excess O
2Since methane is one of the most difficult hydrocarbons to be activated, high temperature and reactive catalytic systems are needed to be utilized as a reductant in the SCR of NO. Selectivity and catalytic activity depend on priority of NOx to O2 for the reaction with methane.
Over H-ZSM-5 containing Co, Mn, Ga, In and Pd catalysts [16, 41-49], CH4 selectively reacts
with NOx instead of being completely combusted with O2. It is shown that NO2 formation on the
catalyst surfaces is a necessary step in the SCR and formation of active NOx species need the
presence of O2[50-53]. These facts are supported by the lower rate of NO/CH4 reaction and a
similar rate of NO2/CH4 reaction as compared with the NO/O2/CH4reaction. It is assumed that
the formation of various surface NOx species and their reactivity with CH4 may have direct
relationship with the catalytic activity and selectivity in the CH4-SCR of NOx. The NOx groups
interact with methane to form a new adsorbed intermediate containing C, N and O atoms. In subsequent steps, this intermediate reacts with NO + O2 or NO2, and N2 is formed [54].
Lobree et al. [55] investigated the interactions of adsorbed NO and NO2 with CH4 over
Pd-H-ZSM-5 by in-situ infrared spectroscopy together with temperature programmed desorption (TPD) and reaction (TPR) spectroscopy. They observed that above 650 K adsorbed nitrosyl species (Z-H+[Pd(OH)(NO)]+Z-) react with CH4 to produce CH2NO (or its isomer CHNOH) with
the release of water. The CH2NO formed, decomposes producing water and leaving behind CN
(neutral) which further reacts with NO to form N2 and CO. The reaction with O2 produce NO and
CO. They compared the activities of H-ZSM-5 and Pd-HZSM-5 for NO reduction by CH4 in the
presence of O2 and concluded that acidity of Pd2+ cations is higher than that of Brønsted acid
protons and they are the principal active component.
Shimizu et al. [56] studied active site structure and reaction mechanism for CH4-SCR on
Pd-H-Mordenite. Combined with kinetic results, they proposed that during CH4-SCR reaction,
the Pd2+-NO complex is present as the main Pd species and adsorbed NO on Pd2+ is reduced by CH4 derived reactive species (CHx) to form NH4+ on highly acidic sites. Then NH4+reacts with
NO adsorbed on Pd2+ and NO2 species formed by NO and O2 resulting in N2 formation.
Watson and Ozkan [57] studied Pd catalysts supported on titania for the SCR of NO by CH4. They found that Pd0 sites are essential for dissociative adsorption of methane. Under in-situ
conditions, NH3 is observed to form as molecularly adsorbed species on Lewis acid sites which
are believed to act as a reducing agent for the adsorbed NO. It is mentioned that direct interaction of nitro/nitroso species with surface CHx remains a possibility.
An analysis of published data on the CH4-SCR mechanism indicates that nitric oxide is
oxidized to nitrogen dioxide and/or surface nitrite/nitrate complexes which are selectively reduced by methane to molecular nitrogen through the possible formation of organic nitro compounds. These organic nitro compounds are shown to be very reactive. They transform into molecular nitrogen under the action of oxygen due to intermediate formation of ammonia, which is a very efficient reducing agent. Cowan et. al. [58] showed that the rate determining step for CH4-SCR is hydrogen abstraction, whose site is adsorbed NO2 formed by oxidation of NO. Initial
steps are
2NO + O2 2NO2 [16]
CH4 + NO2(ads) CH3· + HONO [17]
In the next step, methyl radicals combines directly with adsorbed NO2 yielding CH3NO2,
nitromethane. Above 220oC decomposition of nitromethane gives NH3 which can react to give
Xie et. al. [30, 59] observed the formation of gas phase methyl radicals which reacts with NO to form nitrosomethane on their CH4-SCR active Sr/La2O3 and Ba-doped MgO catalysts.
1.5. Metal Oxide Supports for CH
4-SCR Catalysts
The performance of CH4-SCR catalysts has been found to strongly depend on the acidity
of the support. Zeolitic materials exhibit strong Lewis and Brønsted acidity. Transition and non-transition metals loaded on zeolites have been shown to exhibit activity for the SCR of NOx with
methane in excess oxygen. Li and Armor [50] found that the most active catalysts for NOx
removal by CH4 in oxygen excess were based on cobalt supported on several zeolites, such as
Co-ferrierite and Co-ZSM-5. However, water vapour and SO2 can act as poisons on the catalyst
surface and decrease the activity. Use of non-zeolitic solid acid supports is an alternative approach to durable performance for CH4-SCR in moist streams. Among metal oxide supports,
Al2O3, ZrO2 and TiO2 have taken interest.
-Al2O3 is widely used as support in catalysis. It has large surface area, thermal stability
and low cost, however it has low acidity and this limits its application in CH4-SCR. Pd/ -Al2O3
exhibits very low activity in CH4-SCR but high acivity in combustion of methane [24, 60]. Li et
al. [61] demonstrated that sulfation of -Al2O3 generates strong acid sites which is essential for
the reduction of NO with methane over Pd catalyst and sulfated -Al2O3 is promising to act as a
support for Pd catalyst. ZrO2 is of great interest on account of its surface acidity. Zhao et al. [62]
showed that monoclinic zirconia has Lewis and Brønsted acid sites whereas tetragonal zirconia has only Lewis acid sites. Titania has various forms obtained from different preparation methods and these forms exhibit various surface arrangements resulting in different surface reactivity. Active anatase phase has poor stability, poor mechanical strength and low surface area at high temperatures. Kumthekar and Ozkan [63] examined the SCR of NOx with methane on the
Pd/TiO2 catalyst. They reported that the catalyst can reduce NO.
These metal oxides exhibit superacidity when modified with sulfate, tungstate or molybdate ions. Hino and Arata [64] classified acid strength of these superacids. Table 1 shows their results.
Table 1. Solid superacids and their acid strength [64].
Catalyst (calcination temperature) Highest acid strength (Ho value)
SO4/SnO2 (550oC) SO4/ZrO2 (650oC) SO4/HfO2 (700oC) SO4/TiO2 (525oC) SO4/Al2O3 (650oC) SO4/Fe2O3 (500oC) SO4/SiO2 (400oC) WO3/ZrO2 (800oC) MoO3/ZrO2 (800oC) WO3/SnO2 (1000oC) WO3/TiO2 (700oC) WO3/Fe2O3 (700oC) B2O3/ZrO2 (650oC) -18.0 -16.1 -16.0 -14.6 -14.6 -13.0 -12.2 -14.6 -13.3 -13.3 -13.1 -12.5 -12.5
Results indicate that sulfate-modified catalysts possess higher acidity than their tungstated counterparts. However, SO42- is unstable at high temperatures under reducing conditions and may
result in activity losses. Tungstated metal oxides (WO3-TiO2, WO3-ZrO2) are structurally more
stable than sulfated materials and they exhibited high activity for reaction that requires strong Brønsted acid sites [65]. When WO3 covers the surface of ZrO2 as a monolayer, the catalyst
shows strong Brønsted and Lewis acidity. It is shown that Pd/ZrO2 can become highly selective
for CH4-SCR when promoted by tungstate.
It has been observed that thermal stability of titania can be enhanced by the incorporation of zirconia [66, 67]. This property is important because the activation of C-H bond of CH4 occurs
at high temperature. Lu et al. [68] reported that addition of ZrO2to TiO2 may prevent the possible
strong metal-support interaction due to migration of TiO2 onto the metal surface, after reduction
at high temperature. Moreover, mixed oxide (TiO2-ZrO2) is more acidic with respect to single
component oxides. Strong acid sites on the mixed oxides are generated by charge imbalance resulting from heteroatom linkages [69]. Figure 4 shows the structural representation of the situation.
O Zr O Ti+ O Zr+ O Ti O OH OH
Stronger Bronsted Acid Sites
Stronger Lewis Acid Sites
O Zr+ O Zr O Zr O OH OH
Zirconium Oxide Binary Oxide
Ti O W O Ti+ O H+ O O OH Bronsted Acid Sites Lewis Acid Sites Tungstat ed Mixed Oxide O Zr O O O O
Figure 4. Brønsted and Lewis acid sites on binary and tungstated binary oxides.
On binary oxide surface, there is a charge imbalance based on the generation of Ti-O-Zr bonding [70]. Charge imbalance will create Brønsted and Lewis acid centers. When surface of the mixed oxide is tungstated, tungstate groups will weaken the O-H bond which creates Brønsted acidity, and these groups will also withdraw electron density from unsaturated cationic centers (Ti4+ and Zr4+) to form strong electron deficient Lewis acidity. The highest acidity and highest surface area are obtained when the Zr:Ti molar ratio is equal to 1 [71]. It is expected that monolayer coverage of WO3 on equimolar ratio of TiO2-ZrO2 mixed oxide support will exhibit
very strong surface acidity.
TiO2-ZrO2 can be a valuable support to load Pd for CH4-SCR reaction in terms of its high
acidity, good thermal stability, high surface area (which is necessary for good dispersion of metal) and high mechanical strength. In the course of our work Pd-promoted TiO2-ZrO2 catalyst
is shown to be SCR-CH4 inactive. It is reasonable to use tungstated titania-zirconia support to
load Pd since the tungstation can create high surface acidity needed for good dispersion of Pd.
1.6. FTIR Spectroscopy and Aim of the Study
It has been established that after NO + O2 adsorption on CH4-SCR catalysts, NOx-(x = 2,
3) compounds are formed and these species interact with CH4 to form organic nitro and/or nitrite
species that are decomposed via various routes to SCR reaction products. For the search of detailed mechanism of the process, IR spectroscopy gives direct information on the nature of the different surface species. It is the most powerful technique for in-situ characterization of adsorbed NOx species on catalyst surfaces [72].
The aim of this study is to identify and determine the routes of formation and thermal stability of adsorbed NOx complexes on the surface of Pd/tungstated titania-zirconia mixed
oxides by means of in-situ FTIR spectroscopy and to investigate the reactivity of adsorbed NOx
species toward methane in order to propose a reaction mechanism.
1.7. Identification of Adsorbed NO
x-Species by FTIR Spectroscopy
Interpretation of IR spectra of NOx- surface species produced under SCR conditions can
be quite contradictory due to the fact that the large number of compounds (nitrogen oxo species, hydrogen containing compounds and carbon containing species) may coexist on the surface and some bands from the spectra of different nitrogen-oxo compounds may coincide [72]. Table 2 shows the reported frequencies of adsorbed NOxspecies observed on metal oxides [73].
The nitrite anion has a C symmetry. as(NO2) and s(NO2) stretches at 1260 cm-1 and
1330 cm-1, respectively. Different ways of bonding of nitrite anion to metal cations changes its IR spectrum. Nitro compounds form when NO2- coordinated via its N atom and C symmetry is
preserved. When NO2- is coordinated by one or two oxygen atoms, nitrito compounds form.
Chelating nitrito species have also C symmetry. If free nitrite ion is coordinated simultaneously via an O and its N atom, bridging and bidentate nitro species form.
The free nitrate ion has a D3h symmetry. 3(NO2) mode is IR active and it vibrates at 1400
cm-1 whereas 1 mode is Raman active and observed at 1050 cm-1. Surface nitrates have C
symmetry and they have the 3 mode split into two bands and 1 mode becomes IR active.
Splitting of 3vibration is in the sequence: bridged nitrates > bidentate nitrates > monodentate
nitrates. Thermal stability of these species follow the same order [72].
Kanctheva and Ciftlikli [74] analyzed the combination bands of nitrate species and showed that this spectral region can be used for structural identification of bridged and bidentate nitrates. Bridged nitrates produce combination bands at 2845-2800 cm-1 [ (N=O) + as(NO2)] and
a pair of bands at 1980-1960 and 1900-1890 cm-1 [ s(NO2) + (ONO)]. Bidentate nitrates can be
distinguished by the appearance of combination bands in the region of 2600 cm-1 [ (N=O) +
s(NO2)] and a pair of bands at 1755 and 1700 cm-1 [ s(NO2) + (ONO)].
Stability factor is important to identify the nature of NOx adspecies. Weakly adsorbed
species can be easily removed by evacuation at ambient temperature and these are noncharged, such as NO, NO2, N2O3 and N2O4. Surface nitrosyls and dinitroslys are sometimes very stable.
Their thermal stability depend on the structure and on the kind of the cation to which they are bonded [72].
Table 2. Frequencies of adsorbed NOxspecies observed on metal oxides [73].
NOx Species Vibration Modes Wavenumbers [cm-1]
Free nitrite ion, NO2- as(NO2)
s(NO2)
(ONO)
1250 1335 830 Nitro, M-NO2 as(NO2)
s(NO2)
(ONO)
1370-1470 1320-1340 820-850
Nitrito, M-O-NO (N=O)
(NO) (ONO)
1400-1485 1050-1100 820-840 Chelated nitrito, (M-O2)=N as(NO2)
s(NO2)
(ONO)
1270-1390 1170-1225 840-860 Bridging nitro, M-O-N(O)-M as(NO2)
s(NO2) 1390-1520 1180-1260 Bidentate nitro M O N O as(NO2) s(NO2) 1390-1520 1180-1260
Free nitrate ion, NO3- as(NO2) 1400
Monodentate nitrate, M-O-NO2 as(NO2) s(NO2) (NO) 1450-1570 1250-1330 970-1035 Bidentate nitrate, M-O2NO as(NO2)
s(NO2)
(NO)
1200-1310 1003-1040 1500-1620
Biridged nitrate, (M-O)2=NO as(NO2) s(NO2) (NO) 1200-1260 1000-1030 1590-1660
2. EXPERIMENTAL
2.1. Sample Preparation
Flow chart 1 shows the preparation steps of the catalysts. TiO2-ZrO2 mixed oxide (1:1 mol
ratio based on oxides) was prepared by a homogenous coprecipitation of urea at 70oC . By homogenous coprecipitation method, good mixing of oxides (which is important for the generation of strong acid sites due to charge imbalance) and high surface area can be obtained.
Aqueous solutions of TiCl4, ZrO(NO3)2 and urea were heated together at 110 o
C under constant reflux and stirring. After 18 hours of heating, pH of the solution increased from 2 to 8 and formation of white precipitate was observed. Urea decomposes to generate in-situ OH- ions according to the reaction:
CO(NH2)2 + 3H2O 2NH4+ + 2OH- + CO2(g) (1)
Generation of hydroxide ions favors homogenous coprecipitation of zirconium and titanium hydroxides. After the precipitation, the suspension was aged additionally for 12 hours. The resulting precipitate was collected by suction filtration, washed with deionized water until AgNO3 gave negative test for Cl- ions. The material was dried at 110oC for 12 hours and calcined
at 500oC in air to get mixed oxides.
Oven-dried hydrous titania-zirconia was impregnated with ammonium metatungstate solution by incipient wetness method. The resulting sample was oven-dried at 110oC and calcined at 500oC for 4 hours. Three samples with nominal WO3 contents of 15 wt %, 20 wt % and 25 wt
% were prepared.
To incorporate Pd, required quantity of Pd(NO3)2 was dissolved in water and powdered
oven-dried hydrous tungstated titania-zirconia was added to this solution and excess water was evaporated with continuous stirring. The sample was oven-dried at 383 K and calcined at 500oC for 4 hours. Two catalysts with nominal Pd contens of 0.7 wt % and 1.5 wt % were prepared. The
same method was applied to incorporate Pd to hydrous TiO2-ZrO2 and 1.5 wt % Pd on TiO2-ZrO2
was obtained.
Catalyst notations used further in the text are shown in Table 3.
Flow chart 1. Preparation routes of the catalysts
CO(NH2)2 TiCl4 ZrO(NO3)2 heating 18 hour 343 K CO(NH2)2 + 3H2O 2NH4 + 2OH- + CO2(g)
Ti4+ + 4OH- TiOx(OH)4-2x
Zr4+ + 4OH- ZrOx(OH)4-2x
Homogenous coprecipitation pH 8-9 White precipitate Calcination 773 K TiO2-ZrO2 Mixed Oxide Incipent wetness impregnation Ammonium metetungstate Hydrated Tungstated TiO2-ZrO2 Calcination 773 K Tungstated TiO2-ZrO2 Impregnation
under constant stirring
Pd(NO3)2
Hydrated Pd-promoted Tungstated ZrO2-TiO2
Calcination 773 K Pd-promoted Tungstated ZrO2 -TiO2 Impregnation under constant stirring Pd(NO3)2 Hydrated Pd-promoted ZrO2-TiO2
Calcination 773 K
Pd-promoted ZrO2-TiO2
Table 3. Catalysts and notations. All the samples were calcined at 500oC.
Notation Sample ZT (1:1) Titania-Zirconia 1.5Pd/ZT 1.5 wt % Pd promoted Titania-Zirconia 15WZT 15 wt % WO3 on Titania-Zirconia 20WZT 20 wt % WO3 on Titania-Zirconia WZT 25 wt % WO3 on Titania-Zirconia 0.7Pd/WZT 0.7 wt % Pd promoted 25 wt % WO3 on Titania-Zirconia 1.5Pd/WZT 1.5 wt % Pd promoted 25 wt % WO3 on Titania-Zirconia
Pure titania (anatase) and ZrO2 (monoclinic phase) were prepared by hydrolysis of the
2.2. Surface Area Measurements, X-ray Diffraction and Diffuse Reflectance
UV-Visible Spectroscopy
The BET surface areas of the samples were measured by nitrogen adsorption at 77 K using a MONOSORP apparatus from Quanta chrome. The samples were dehydrated at 573 K for 1 h before the measurements.
XRD analysis performed on a Rigaku Miniflex diffractometer with Ni-filtered Cu K radiation under ambient conditions. The scan speed was 20/min for the samples studied.
DR-UV-vis spectra were obtained under ambient conditions with fiber optic spectrometer AvaSpec-2048 (Avantes).
2.3. FTIR Spectroscopy
The FTIR spectra were recorded on a BOMEM MB 102 FTIR (Hartman & Braun) spectrometer equipped with a liquid-nitrogen-cooled MCT detector at a resolution of 4 cm-1 (128 scans).
2.4. Experimental Setup
A specially designed IR cell (Xenonum Scientific, USA) allows recording of the spectra at ambient and elevated temperatures (Figure 5). The cell has BaF2 windows. The sample holder
of the cell can be moved up and down relative to the light beam, which gives the possibility for the recording the gas phase spectrum. The cell is connected to a vacuum/adsorption apparatus (Figure 6).
2.5. Activation of the Samples
Self-supporting discs (0.025 – 0.035 g/cm2) were used for the FTIR studies. These specimens were activated by heating for 1 hour in a vacuum at 450oC and in oxygen (100 Torr) at the same temperature followed by evacuation for 1 hour at that temperature.
The spectra of the activated sample that was taken at high temperature and room temperature were used as background references. The high temperature background reference
was used in the subtraction of the spectra taken at high temperatures and similarly the room temperature background reference was used for the spectra registered below 150oC. The spectra of the samples that were subjected to heat treatments at elevated temperatures were recorded at those temperatures.
Figure 5. IR cell (A: Thermocouple entrance, B: Vacuum/Adsorption line connection, C: Heating
Figure 6. Vacuum/adsorption apparatus ( A: Rotary pump, B: Diffusion pump, C: Liquid
nitrogen trap, D: Adsorption pipes)
2.6. Adsorption of NO and Co-adsorption with O
2NO adsorption was performed at room temperature introducing 12 Torr of NO and the evolution of the IR spectra with the time was followed.
Co-adsorption with O2 was achieved at room temperature introducing a gas mixture (12
Torr) of NO and (6 Torr) of O2 for a given period of time.
Thermal stability of the adsorbed NOx species was studied by heating the sample for 15
minutes under vacuum in the temperature range 200oC – 450oC.
2.7. Interaction of CH
4with the Catalysts
40 Torr of methane was added into the IR cell in order to observe the interaction of CH4
with the catalyst. Then the closed IR cell was heated from 200oC – 450oC.and the samples were allowed to stay for 15 minutes at each temperature level.
2.8. Interaction of CH
4with NO
x– precovered catalysts
After the formation of NOx species by room temperature adsorption of NO and O2 (1:1)
followed by evacuation for 30 minutes, 40 Torr of CH4 was added. The interaction of methane
with the NOx– precovered catalyst was observed in the temperature range 200oC – 450oC. The
interaction time at each temperature level was 15 minutes.
CH4 and O2 used were passed through a trap cooled by liquid nitrogen before admission to
the IR cell. The purity of NO gas was 99.9 % (Air Products).
CH3NO2 adsorption was performed at room temperature by introducing 1 Torr of
3. RESULTS AND DISCUSSION
3.1. Characterization of the Samples
3.1.1. BET Surface Area Measurements
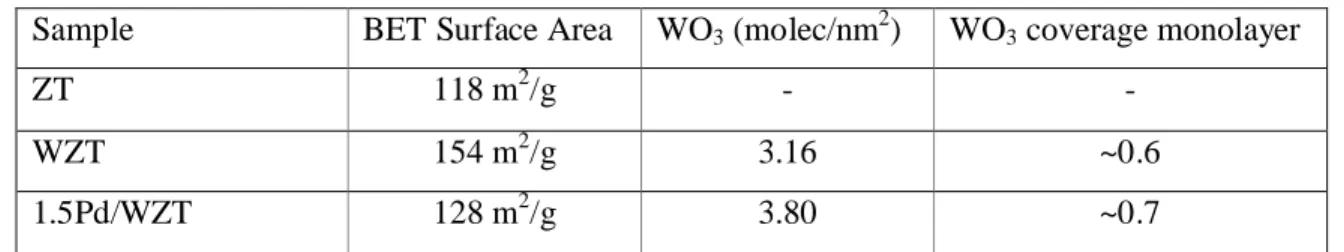
Table 4 BET surface areas and tungsten density.
Sample BET Surface Area WO3 (molec/nm2) WO3 coverage monolayer
ZT 118 m2/g -
-WZT 154 m2/g 3.16 ~0.6
1.5Pd/WZT 128 m2/g 3.80 ~0.7
In Table 4 surface areas of the samples are given together with the WO3surface density
(number of molecules/nm2). The maximum packing density of planar WO3 species are taken as
0.21 g. WO3/100 m2 [76]. According to this density value, the average cross-section of an
adsorbed WO3 is equal to 0.183 nm2 and the surface concentration of WO3 corresponding to the
theoretical monolayer is found to be 5.45 WO3/nm2. This shows that surface concentrations of
WO3 on WZT and 1.5Pd/WZT samples have nearly 60% and 70% of the monolayer WO3
coverages, respectively.
3.1.2. X-ray Diffraction
3.1.2.1. Titania-Zirconia Mixed Oxides
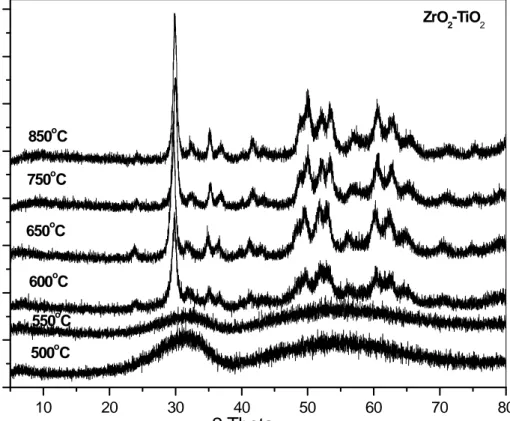
Figure 7 shows the XRD pattern of sample ZT calcined at different temperatures. The sample ZT after calcinations at 500oC and 550oC is in amorphous form. Formation of crystalline ZrTiO4 compound at 600oC is observed that can be matched with JCPDS file no. 34-415.
Intensity of the lines due to ZrTiO4 increased with increasing calcination temperature. No
independent lines due to TiO2 (rutile or anatase) and ZrO2 (monolinic, cubic or tetragonal) have
10 20 30 40 50 60 70 80 0 500 1000 1500 2000 2500 3000 3500 4000
Int
en
sity
[a.u]
2 Theta
500oC 550oC 600oC 650oC 750oC 850oC ZrO2-TiO2Figure 7. Powder X-ray diffraction patterns of ZT samples calcined at different temperatures.
Crystallite size is calculated using the Scherrer equation [77] (equation 1). The calculations are performed by measuring the broadening of a particular peak in a diffraction pattern associated with a particular planar reflection within the crystal unit cell. It is inversely related to the FWHM (full width at half maximum) of an individual peak. This is due to the periodicity of the individual crystallite domains, in phase, reinforcing the diffraction of the X-Ray beam, resulting in a tall narrow peak. If the crystals are defect free and periodically arranged, the X-ray beam is diffracted to the same angle even through multiple layers of the specimen. If the crystals are randomly arranged or have low degrees of periodicity, the result is a broader peak.
Crystallite Size = K x / B x (Cos B) (1)
where K is the shape factor of the average crystallite (expected shape factor is 0.9). is the wavelength (1.54056 Å for Cu K 1), B is the peak position and B is the FWHM of the
with 2000 nm crystallite size. In this case, crystal size effect on peak broadening is removed due to large crystallite size of Si and instrumental broadening is found to be 0.1o. The diffraction peak of (111) of the ZrTiO phase has 2 in the range from 29.90o to 30.01o. Deconvolution parameter is built into diffraction lines for FWHM (Full-width at half-maximum) correction to help in assigning the area of the (111) peak with PeakFitTM program. Table 3 shows the crystallite sizes of ZrTiO calcined at increasing temperatures, calculated according to the Scherrer equation.
Table 5 Calculated crystallite sizes of ZrTiO4
Calcination Temperature of TiO2-ZrO2 Crystallite Size 600oC 4.4 nm 650oC 4.9 nm 750oC 5.2 nm 850oC 5.7 nm
The crystallization process initiates with the nucleation and the nuclei grow by diffusion, which depends on temperature, being thus crystallization a thermally activated process. Crystallite size increases with increasing calcination temperatures. At higher temperatures, the oxide diffusion process is accelerated, starting the sintering process. This leads to the augmentation of the particle size.
3.1.2.2. Tungstated Titania-Zirconia
Figure 8 shows XRD patterns of 25 % tungstated ZrO2-TiO2 calcined at 500oC, 550oC and
600oC. The catalysts are found to be XRD amorphous. These results show that tungstation retards the crystallization to higher temperatures. The WO3 displays its three peaks in medium intensity
at 22.99, 23.43 and 24.23 o (JCPDS file no. 43-1035). Peaks become narrower and higher in intensity as the calcination temperature increases.
10 20 30 40 50 60 70 80 0 500 1000 1500 2000 2500 3000 3500 4000 4500 5000 5500 6000 6500 7000 x x
Inten
sity
2Theta
500oC 550oC 600oC 650oC 700oC 750oC 800oC25WZT
xFigure 8. Powder X-ray diffraction patterns of 25WZT samples calcined at different
temperatures. Characteristic lines due to ( ) ZrTiO4; ( ) Zr(WO4)2; (x) WO3.
In addition to ZrTiO4, Zr(WO4)2 (JCPDS file no. 31-1500) can be noted. Reddy et al. [70]
observed characteristic lines due to Zr(WO4)2 in their tungstate promoted TiO2-ZrO2 catalyst
calcined at 800oC. Intensity of lines due to ZrTiO4 and Zr(WO4)2 increase with increasing
calcination temperature up to 800oC.
Table 6. Calculated crystallite sizes of ZrTiO4 phase of WZT
Calcination Temperature of WZT Crystallite Size 700oC 4.8 nm 750oC 4.9 nm 800oC 5.1 nm
Table 6 shows the crystallite sizes of WZT calcined at increasing temperatures, calculated according to the Scherrer equation. Crystallite sizes are slightly lower than that of ZT samples at corresponding calcinations temperatures. This is due to the fact that the load of WOx species
stabilizes the titania-zirconia structure and prevents sintering of the small crystallites.
3.1.2.3. Pd promoted Tungstated Titania-Zirconia
Figure 9 shows XRD patterns of 1.5 wt % Pd promoted 25 wt % WO3 on TiO2-ZrO2
calcined at 700oC. Diffraction patterns are similar with tungstated sample calcined at 700oC. ZrTiO4, Zr(WO4)2 and WO3 phases have been found. PdO(101) and Pd(111) planes have
diffraction lines at around 34o and 40o, respectively [78]. Since the amount of PdO and Pd is very low and the diffraction patterns are complex, these phases are difficult to analyze.
10 20 30 40 50 60 70 80 0 500 1000 1500 2000 2500 3000 3500 4000
1.5 wt % Pd promoted 25 wt % W O3on TiO2-ZrO2
Inte
nsity
[a.u]
2Theta
700oC
3.1.3. Diffuse Reflectance UV-vis Spectra of the Samples
In DR-UV-vis spectroscopy, the position of the absorption edge is sensitive to the bonding between metal oxide and WOx polyhedra and these data are useful to characterize the
average particle size of nanocrystalline insulators and semiconductors [76]. Absorption edge energy for WOx species is strongly influenced by number of neighboring WOx polyhedra bonded
through W-O-W bonds and by the number of bonds between each polyhedra. In our study, UV-vis absorption edge energies of WOx compounds on TiO2-ZrO2 support are compared with the
edge energies of several crystalline standards with known WOx coordination in order to
determine the chemical state of Pd on tungstated TiO2-ZrO2.
Optical absorption edge energy is the minimum photon energy required to excite an electron from the top of the valence band (HOMO) to the bottom of conduction band (LUMO). There are 2 types of electronic transitions which are direct and indirect. Photons excite electrons in direct transitions whereas in indirect transitions there are also concerted vibrations and energy from the crystal lattice. In the region near the absorption edge energy, the dependence of absorption coefficient ( ) is given by
~ (hv – Eo) / (h ) (2)
where h is energy of incident photon, Eo is optical absorption edge energy and depends on
type of optical absorption caused by photon absorption. Fundamental absorption edge of WO3
crystallites is caused by indirect electron transitions and a plot of ( )1/2 vs h is linear near the edge for WO3. This method is used to determine the absorption edge energies. Table 7 shows the
edge energies, their corresponding transitions and the electronic structural properties of catalysts studied.
TiO2-ZrO2 has an edge energy value of 3.32 eV which is different than pure titania and
zirconia. This fact shows that a different matrix has been formed and according to XRD it is found as ZrTiO4[71].
The absorption spectrum of 25 wt .% WO3/ZrO2-TiO2sample calcined at 500oC has an
edge energy similar to that in (NH4)10H2W12O42 (ammonium paratungstate). Ammonium
paratungstate has a structure of polyoxotungstate clusters and their WOxdomains of intermediate
size contanining octahedra bonded through edges and corners. WOx domains of intermediate size
have unique acid property by forming Brønsted acid centers. Paratungstate-type polytungstate species form an extended network of WOx domains over which an excess negative charge can be
similar to that in bulk WO3. This shows that WO3crystallites are formed on the surface of mixed
oxide support. The XRD data of tungstated samples indicates that the increase in the calcination temperature results in increased sintering rate and particle size which results in loss of surface area. As a result, the average distance between dispersed WOx octahedra on the TiO2-ZrO2
surface decreases and WOx surface density increases. The dispersed WOx species will form
W-O-W bridging bonds between neighbouring W-O-WOx groups and three dimensional WO3 crystallites are
formed [79]. Structural change in octahedral WOx species on TiO2-ZrO2 surface with increased
Table 7. Edge energies, their corresponding transitions and the electronic structural properties. W O W O W O O O O TiO2-ZrO2 W O W O W O O O O TiO2-ZrO2 WO3 WO3 Calcination at 800oC
Intermediate WOx surface density High WOx surface density
Structural changes of octahedral WOx species on TiO2-ZrO2 surface with calcination temperature.
Compound Absortion Edge Energy Transition Property TiO2 3.15 eV O2---Ti4+ O(2p)—Ti(3d) Semiconductor oxide ZrO2 5.0 eV O2---Zr4+ O(2p)—Zr(4d) Insulator oxide TiO2-ZrO2 500oC calcined 3.32 eV O2----Zr4+ O2----Ti4+
A different matrix from pure titania or zirconia has been formed
Bulk WO3 2.60 eV
O2---W6+ O(2p)--W(5d)
It contains 6-coordinate W6+and WOx species in an
extended 3-D crystalline network of distorted octahedra bonded to 6 neighbouring octahedra.
Na2WO4 4.95 eV
O2---W6+ O(2p)--W(5d)
Monomeric tetrahedral tungstate( 4-coordinate W6+)
(NH4)10H2W12O42 3.54 eV O2---W6+
O(2p)--W(5d)
Intermediate value of absorption edge energy. WOx
domains of intermediate size contanining octahedra bonded through edges and corners
25%WO3/ZrO2-TiO2
500oC calcined
3.46 eV O2---W6+ O(2p)--W(5d)
Tetrahedral monomeric WO42- species and
microcrystalline WO3 are not present on tungstated
titania-zirconia. Absorption edge enegry more likely matches with ammonium paratungstate which has a structure of polyoxotungstate clusters. 25%WO3/ZrO2-TiO2
800oC calcined
2.68 eV O2---W6+ O(2p)--W(5d)
Figure 10 shows UV-vis diffuse reflectance spectra of Pd- promoted tungstated samples with increasing Pd content and also Pd promoted mixed oxide samples. The band around 450 nm is attributed to d-d transition of isolated Pd2+ ions linked to surface oxygen atoms of the support or small Pd(O)n2+ entities [80]. Shimizu et al. [56] observed in the absorption spectrum of
Pd-H-Mor similar band at 460 – 480 nm due to d-d transitions of isolated Pd2+ ions coordinated to the cation exchange sites of the zeolite. This leads to the conclusion that tungstated titania-zirconia support is able to stabilize dispersed palladium(II) analogous to the acidic zeolites.
4 0 0 6 0 0 8 0 0 0,1 0,2 0,3 0,4 0,5 0,6 0,7 0,8 0,9 1 .5 P d /Z T 3 P d/W Z T 1 .5P d /W Z T Absorbance W a v e le n g th [n m ] 0.7 P d/W Z T
Figure 10. UV-vis diffuse reflectance spectra of the calcined Pd promoted samples.
3.1.4. Discussion of the Catalyst Structure
TiO2-ZrO2 mixed oxide (1:1 mol ratio based on oxides) was prepared by a homogenous
coprecipitation of urea at 70oC. Formation of crystalline ZrTiO4 compound at a calcination
temperature of 600oC is observed. Based on the data of XRD and DR-UV-Vis spectra, very good mixing of oxides has been achieved with high surface area (118 m2/g) and small crystallite size (4.4 nm). The mixed hydroxide was tungstated with ammonium metatungstate solution.
Tungstation shifts crystallization to higher temperatures. In addition to ZrTiO4, Zr(WO4)2 and
WO3 phases are observed at high temperatures. 500oC calcined samples have paratungstate-type
polytungstate species forming intermediate WOx surface densities which can give rise to strong
Brønsted acidity. Pd containing samples were prepared by impregnation of ZT and WZT samples with Pd(NO3)2.2H2O solution. Isolated Pd2+ ions coordinated to surface oxygen atoms of support
indicate the fact that tungstated titania-zirconia support can stabilize dispersed Pd(II) similar to the acidic zeolites. For the FT-IR spectroscopy experiments, 500oC calcined samples were used since higher temperature calcination leads to formation of WO3 crystallites which can block the
active sites for the SCR-CH4.
3.1.5. FTIR Spectra of the activated samples
Figure 11 shows the FT-IR spectra of the activated samples together with pure titania and zirconia for comparison. In the spectrum of ZrO2 in the OH-stretching region (Figure 11B), there
are two strong absorptions at 3775 and 3670 cm-1 and a broad band between 3600 and 3200 cm-1. According to the literature [81], the band at 3775 cm-1 is assigned to terminal OH groups whereas the absorption at 3670 cm-1 is attributed to bridged OH groups of monoclinic zirconia. The broad band between 3600 and 3200 cm-1 is due to H-bonded tribridged hydroxyls.
The spectrum of TiO2 displays a pair of bands at 3718 and 3671 cm-1 with weak intensity.
These absorptions are characteristic of hydroxyl groups of anatase [82].
The spectrum of mixed oxide contains two sharp bands at 3775 and 3671 cm-1 corresponding to isolated hydroxyl groups. Population of hydrogen bonded hydroxyls in the 3600 – 2750 cm-1 region increases with respect to pure zirconia and titania. This fact indicates that mixed oxide could have higher Brønsted acidity with respect to the pure oxides.
The spectrum of 1.5Pd/ZT catalyst (Figure 11A) in the (OH) stretching region is different from that of ZT. The isolated and H-bonded hydroxyl groups disappear from the spectrum. This indicates that Pd2+ ions replace protons of the surface hydroxyls during the deposition process.
The spectrum of the WZT sample has sharp bands at 3745 and 3665 cm-1, attributed to isolated OH groups [81]. The broad band between 3515 and 2500 cm-1 region indicates the presence of H-bonded hydroxyls. The single band at 2013 cm-1 is assigned to the first overtone vibration of fundamental (W=O) mode. The fundamental (W=O) stretching vibration should be at around 1010 cm-1, however the self absorption of the catalyst makes it difficult to resolve this
band. The presence of single overtone band indicates that WZT sample contains one type of wolframyl groups of well-dispersed uniform WOx species.
4000 3500 3000 2500 2000 1500 1000
B
4000 3800 3600 3400 3200 3000 0.5 TiO2-ZrO2 TiO 2 ZrO2 Wavenumber[cm-1] 3775 3671 Abso rb anc e Wavenumber [cm=1] 3670 1534 1371 2013 3665 3515 3220 1596 3775 3671 ZT 1.5Pd/ZT WZT 1.5Pd/WZT 0.5A
3775Figure 11. (A) FTIR spectra of activated samples of ZT, WZT and 1.5Pd/WZT in the 4000 -1000
cm-1. (B) Spectra of ZT, TiO2 and ZrO2 in the OH-stretching region.
The spectrum of 1.5Pd/WZT catalyst is similar to the spectrum of 1.5Pd/ZT. Isolated hydroxyls are not observed. The overtone vibration of (W=O) disappears after the Pd deposition. This behaviour can be explained assuming that Pd2+ ions coordinate to the W=O species.
The absorptions at 1596, 1534 and 1371 cm-1 (Figure 11A) are due to surface carbonates. Such residual surface species are observed on zirconia and can not be removed by high temperature activation [74].
![Figure 1. Production of NO, CO and HCs over a wide range of air to fuel ratios [6].](https://thumb-eu.123doks.com/thumbv2/9libnet/5798506.118105/18.918.118.752.312.668/figure-production-hcs-wide-range-air-fuel-ratios.webp)
![Figure 2. Dual-bed emission control [7].](https://thumb-eu.123doks.com/thumbv2/9libnet/5798506.118105/19.918.119.712.697.883/figure-dual-bed-emission-control.webp)
![Figure 3. Typical SCR system with operating data [11].](https://thumb-eu.123doks.com/thumbv2/9libnet/5798506.118105/21.918.119.666.84.439/figure-typical-scr-operating-data.webp)
![Table 1. Solid superacids and their acid strength [64].](https://thumb-eu.123doks.com/thumbv2/9libnet/5798506.118105/26.918.108.614.124.419/table-solid-superacids-acid-strength.webp)
![Table 2. Frequencies of adsorbed NO x species observed on metal oxides [73].](https://thumb-eu.123doks.com/thumbv2/9libnet/5798506.118105/29.918.181.713.239.1022/table-frequencies-adsorbed-x-species-observed-metal-oxides.webp)