INVESTIGATION OF THE EFFECTS OF NICOTINE AND
LEVAMISOLE ON SW620 COLON ADENOCARCINOMA CELLS
USING A CUSTOMIZED R-ROUTINE FOR AUTOMATED
MICROARRAY ANALYSIS
A THESIS SUBMITTED TO
THE DEPARTMENT OF MOLECULAR BIOLOGY AND GENETICS AND INSTITUTE OF ENGINEERING AND SCIENCE OF
BILKENT UNIVERSITY
IN PARTIAL FULFILLMENT OF THE REQUIREMENTS FOR THE DEGREE OF MASTER OF SCIENCE
By Muammer ÜÇAL August 2010
ii
To my family
and to my daisy, Saniye
iii
ABSTRACT
INVESTIGATION OF THE EFFECTS OF NICOTINE AND LEVAMISOLE ON
SW620 COLON ADENOCARCINOMA CELLS USING A CUSTOMIZED
R-ROUTINE FOR AUTOMATED MICROARRAY ANALYSIS
Muammer ÜÇAL
MSc. in Molecular Biology and Genetics
Supervisor: Assoc. Prof. Dr. Özlen KONU
August 2010
Nicotine, the addictive component of tobacco, shows proliferative and antiapoptotic activity in cancer cells. Levamisole, an antihelmintic, on the other hand, has been tested as an additive chemotherapeutic agent and in treatment of nephrotic syndrome. Nicotine and levamisole are both agonists of nicotinic acetylcholine receptors; effects of these two agents have not been studied in colon cancer transcriptome. In this study, nicotine and levamisole exposed SW620 colon cancer cells, at a dose of 1 μM for 7 days, were studied with respect to changes in expression using microarrays. For data analysis, a custom R-routine which makes extensive use of open source R-BioConductor Project and associated packages has been written; and it is composed of three modules: QualCont module performs quality controls supported with several visual
iv
representations and normalization of the raw data; DEGidentifier module performs identification of differentially expressed genes (DEGs) supported with Heatmap and Venn Diagram; and finally FuncAnn module, composed of four main functions, performs functional annotation and analysis of the results in terms of Gene Ontology, pathway analysis, supported with graphics and pathway networks
All arrays passed the quality control criteria. In this study, we show that nicotine and levamisole treatments affect the transcriptome similarly in SW620 cells in terms of both the differential expression and functional analysis. Our findings implicate nicotine and levamisole in steroid biosynthesis, cholesterol biosynthesis and aminoacid degradation metabolisms. Confirmatory analyses have been performed by real time RT-PCR for a selected set of genes.
Keywords: nicotine, levamisole, SW620, colon cancer, custom R routine, automated microarray analysis
v
ÖZ
NİKOTİN VE LEVAMİSOLÜN SW620 KOLON ADENOKARSİNOM HÜCRELERİ ÜZERİNDEKİ ETKİLERİNİN ARAŞTIRILMASI VE OTOMATİK MİKRODİZİ ANALİZİ İÇİN ÖZEL R PROGRAM RUTİNİ
GELİŞTİRİLMESİ VE UYGULANMASI
Muammer ÜÇAL
Moleküler Biyoloji ve Genetik Yüksek Lisansı Tez danışmanı: Doç. Dr. Özlen KONU
August 2010
Sigaranın bağımlılık yapıcı madde olarak bileşeni nikotin, hücre çoğalımına neden olmak suretiyle kanserojen etki gösterir. Levamisol bir antihelmintik olarak
kullanımdaysa da kolon kanserinde bağışıklığı arttırmak amaçlı kemoterapi ajanı olarak ve steroid hassasiyeti olan nefrotik sendromlu hastalarda denenmiş ve kullanılmıştır. Bu çalışmada 1uM ve 7 gün boyunca uygulanan nikotin ve levamisolün SW620 kolon kanseri hücre hattı üzerindeki etkilerini mikrodizi analizi ile gerçekleştirilmiştir. Verilerin analizi için açık kodlu R-BioConductor projesi paketlerinin yoğun olarak kullanıldığı özel bir R program tasarlanıp uygulanmıştır. Program rutini üç ana modülden oluşmaktadır: QualCont modülü, mikrodizilerin ve verilerin kalite kontrol analizleri için grafik destekli sonuçlar üretir ve veri normalizasyonunu gerçekleştirir; DEGidentifier modülü, gruplar arasındaki ifade farkı gösteren genlerin tespitini yapar ve bu konudaki sonuçları Venn şeması ve gen ifade haritası ile birlikte sunar ve son olarak
vi
FuncAnn modülü dört ana fonksiyondan oluşmaktadır ve Gen Ontolojisi, yolak analizi bakımlarından verilerin işlevsel analiz ve açıklamalarını yapar, grafikler ve gen ağ sonuçları ile destekler.
Bu çalışma nikotin ve levamisolün SW620 hücreleri üzerinde hem gen ifade farklılaşması hem de işlevsel yolaklar bakımından oldukça benzer yanıtlar
oluşturduğunu göstermektedir. Bulgularımız, nikotin ve levamisolün steroid biyosentezi, kolesterol biyosentezi ve aminoasit yıkımı metabolizmalarında oldukça güçlü bir etkiye sahip oldukları yönünde olmuştur. Mikrodizi bulguları gerçek zamanlı RT-PCR
analizleri ile desteklenmiştir.
Anahtar sözcükler: nikotin, levamisol, SW620, kolon kanseri, özel R rutini, otomatik mikrodizi analizi
vii
ACKNOWLEDGEMENTS
I would like to convey my thanks to Assoc. Prof. Özlen Konu for her supervision, guidance and support through the period since 2006 summer and throughout this study. I have learned a lot from her experience and invaluable critics. I also would like to thank her for that I learned a lot on statistics, bioinformatics and analytical evaluation of large datasets while working with. It was a privilege for me to work with her.
I would like to thank Assoc. Prof. Işık Yuluğ and Assist. Prof. Özlem İlk for their helpful comments and constructive criticisms for my thesis study.
I am especially indebted to Ceren Sucularlı, Ahmet Raşit Öztürk, Onur Kaya and Rumeysa Bıyık and Melike Öztürk who had been very good friends either in or outside the lab. I have to express that I have learned a lot from them. I should also thank to Koray Doğan Kaya for his ideas discussions.
I would like to thank Gurbet Karahan, Nilüfer Sayar, Tamer Kahraman, Chigdem Aydın Mustafa, Şerif Şentürk, Zeynep Tokçaer Keskin and Tolca Acun for their nice friendship and for helping me out with many difficulties that I encounter in the lab.
I am grateful to Vedat Taş, Hamit Taş, Alper Kılıklı and Elif Aslan for their invaluable friendship and supports, for their smiles and for sharing with me this much.
I would like to thank to Fatih Semerci and Osman Mahmut Eryurt for their invaluable friendship and supports all the years since 2003. Without them, and their friendship I would be much less than I am.
My special thanks goes to my other half Saniye, without whom I believe neither this project nor this thesis could be possible for me to finish.
Undoubtedly, my deepest gratitude would be for my whole family for their unconditional love and support for my studies and decisions.
I would like to thank TÜBİTAK for supporting me with BIDEB-2210 scholarship during my M.Sc. research period.
viii
TABLE OF CONTENTS
ABSTRACT ... iii
ÖZ ... v
ACKNOWLEDGEMENTS ... vii
TABLE OF CONTENTS ... viii
LIST OF FIGURES ... x
LIST of TABLES ... xiii
1. INTRODUCTION ...1
1.1. Nicotine ...1
1.1.1. History of nicotine – A general overview ...1
1.1.2. Structure and Properties ...2
1.1.3. Metabolism ...2
1.1.4. NACHRS: Structure, function and localization ...7
1.1.5. nAChRs and Cancer in Human ...8
1.1.6. Nicotine and SW620 Cells ...9
1.2. Levamisole ...9
1.2.1. Structure, Properties and Antihelminthic Mode of Action ...9
1.2.2. Metabolism ... 11
1.2.3. L-AChRs: Structure, function, localization ... 11
1.2.4. Levamisole and Apoptosis ... 13
1.2.5. Levamisole, Colorectal Cancer and Cell Proliferation ... 14
1.2.6. Levamisole and Nephrotic Syndrome ... 15
1.3. Microarray Analysis Methods ... 16
1.3.1. Microarray Analysis Programs Based on R Environment ... 16
1.3.2. BioConductor ... 18
ix
2. AIM of THE STUDY ... 20
3. MATERIALS AND METHODS ... 22
3.1. Levamisol and Nicotine Treatment of Cells for Microarray and RT-PCR analysis ... 22
3.2. RNA extraction, cDNA synthesis and real-time PCR experiments ... 22
3.3. Microarray experiments ... 23
3.4. Quality Controls and Pre-processing of the microarray data ... 24
3.5. Determination of Differentially Expressed Genes ... 25
3.6. Functional Annotation and Analysis of Differentially Expressed Genes ... 28
4. RESULTS ... 30
4.1. Quality Control Assessment of Hybridization and Preprocessing of Microarray Data 30 4.2. IDENTIFICATION OF DIFFERENTIALLY EXPRESSED GENES ... 40
4.2.1. NICOTINE AND LEVAMISOLE ACT SIMILARLY ON SW620 COLON CANCER CELLS 42 4.3. FUNCTIONAL ANALYSIS ... 45
4.4. CONFIRMATORY REALTIME PCR RESULTS ... 55
5. CONCLUSION AND DISCUSSION ... 62
5.1. A Flexible and Expandable Custom R Routine Designed for Automated Microarray Analysis, From QC Assessment to Functional Analysis ... 62
5.2. Chronic Nicotine and Levamisole Treatment Affect SW620 Colon Cancer Cells Similarly 63 5.3. Chronic nicotine and levamisole treatments increase aminoacid degradation ... 65
5.4. Anti-apoptotic or proleferation inducing genes are down-regulated in chronic nicotine and levamisole exposure ... 66
6. FUTURE PERSPECTIVES ... 69
REFERENCES... 71
x
LIST OF FIGURES
Figure 1: Chemical structure of nicotine. Adapted from (Benowitz and Jacob, 1994) ...2
Figure 2: Chemical structure of levamisole. Adapted from (Roberts, IPCS INCHEM) ... 10
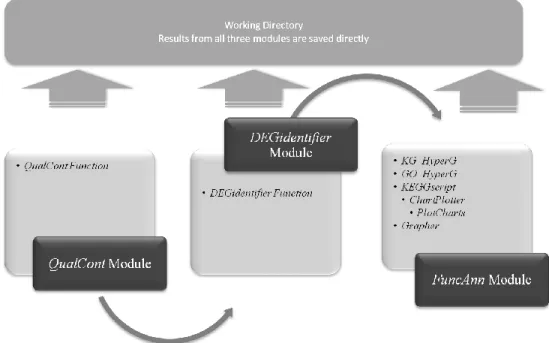
Figure 3: Workflow of the routine. The routine is composed of three modules, each of which is composed of related functions. At each step, results are automatically saved to the
user-defined directory, with appropriate denomination. ... 25
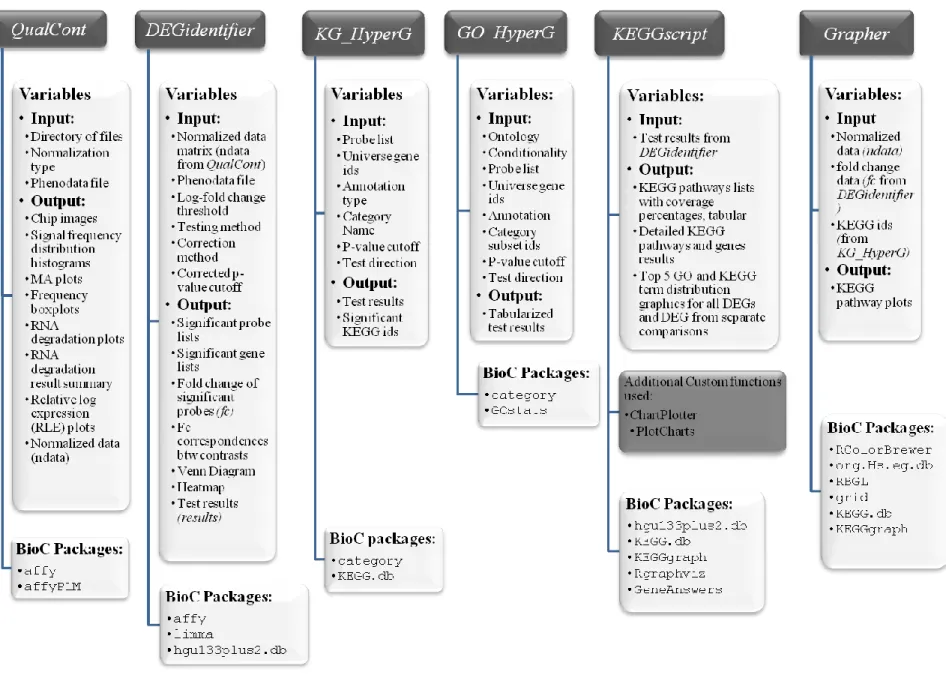
Figure 4: Detailed schematic view of routine components. Input values and output results for each function as well as used BioConductor packages are given. Additional Custom functions
ChartPlotter and PlotCharts are two functions modified from equivalent functions of package
GeneAnswers (Feng et al., 2001). Those modifications were necessary for us to ensure streamline flow of the routine. ... 27
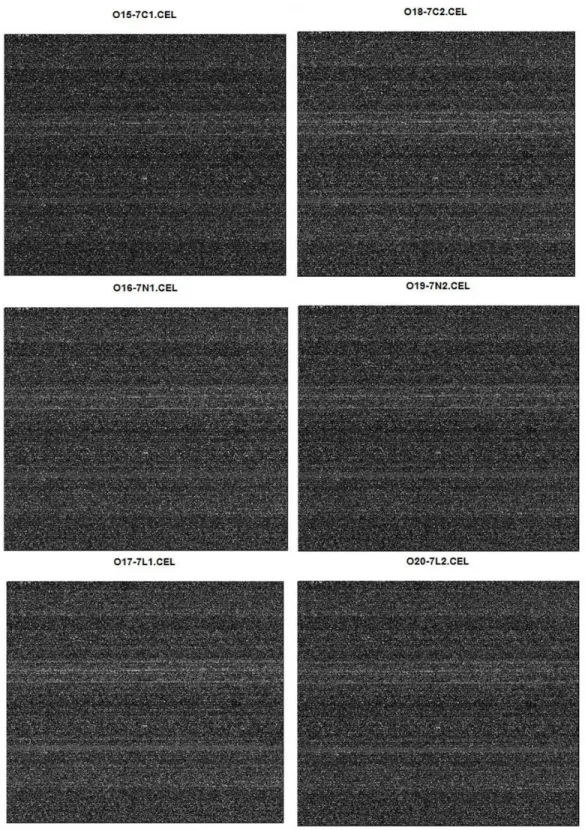
Figure 6: Photographs of array chips. Images were created with the help of image function of the graphics package (R_Development_Core_Team, 2010). ... 33
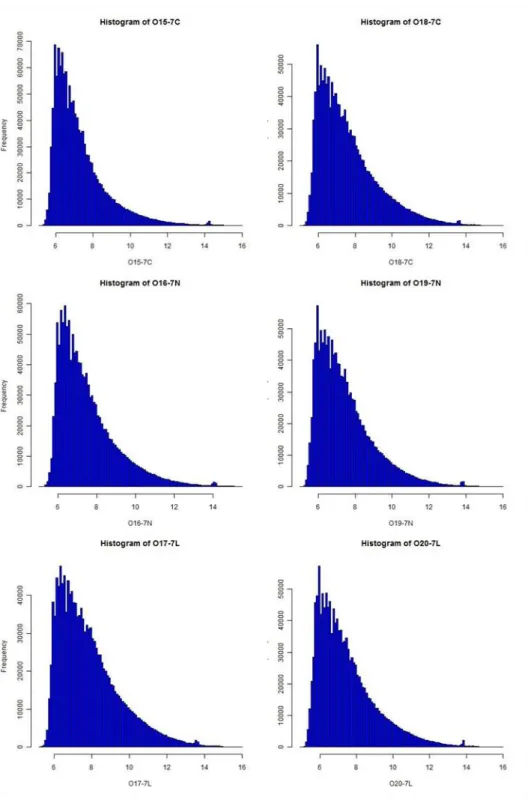
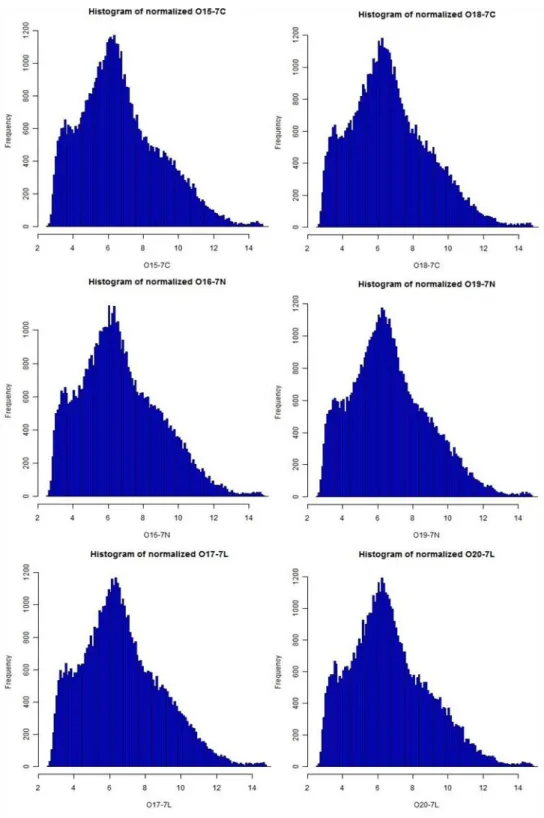
Figure 7: Frequencies of signal intensities along arrays. The plot shows the distribution of the signal intensity before normalization. Images were created with the help of hist function of the graphics package (R_Development_Core_Team, 2010). ... 34
Figure 8: Frequencies of signal intensities along the arrays after normalization. The plot demonstrates the new distribution of the data following normalization. Normalization
procedure simply approximates the data distribution to normal distribution on the grounds that following tests and analyses are based on the assumption that the data is distributed normally. Images were created with the help of hist function of the graphics package
(R_Development_Core_Team, 2010). ... 35
Figure 9: Box plot representation of data of each array before and after normalization. Represents intensity value distribution of arrays. To be analyzed together, all arrays should meet a very close mean value making the content comparable for differential expression analysis. y-axis shows signal intensity values (RMA normalization gives logged values of signal intensities). Images were created with the help of boxplot function of the graphics package (R_Development_Core_Team, 2010). ... 36
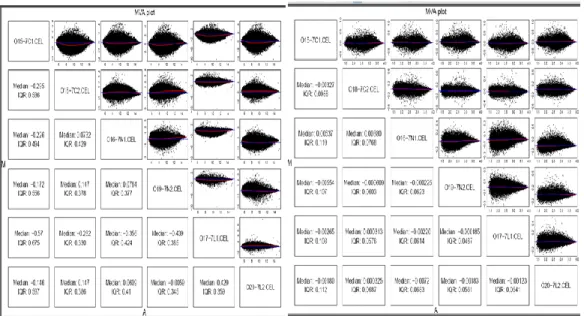
Figure 10 :MA Plots of arrays before and after normalization (from left to right). M (y-axis) is the intensity ratio; A (x-axis) is the average intensity for a dot in the plot. MA plot provides a quick overview of intensity-dependent ratio. Images were created with the help of
mva.pairs function of the affy package (Gautier et al., 2004). ... 36
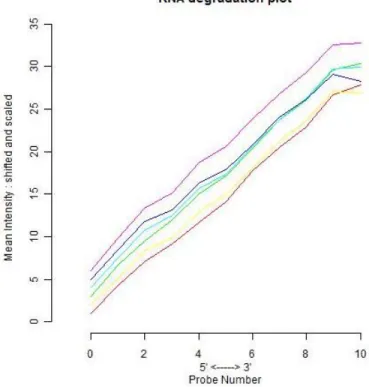
Figure 11: RNA degradation plot of arrays. Represents the mean intensity for 5’ to 3’ probes. Each line represents an array within the data. Agreement of slopes of all arrays indicates good
xi
quality and allows all arrays to be analyzed together. Image was generated with the help of plotAffyRNAdeg function of affy package (Gautier et al., 2004). ... 37
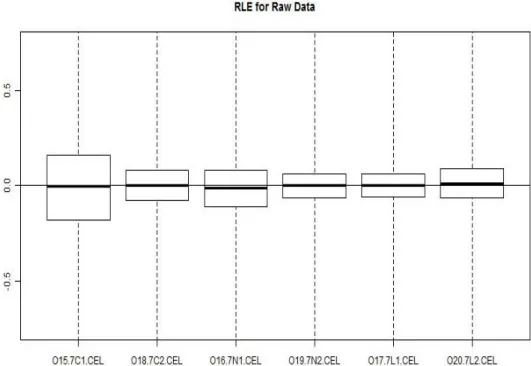
Figure 12: RLE (relative log expression) plots of arrays. Image was generated with the help of RLE function of the affyPLM package (Brettschneider et al., 2007). ... 39
Figure 13: Experiment descriptor (phenodata) file we used for our analysis. We provide a screenshot of the tab delimited text file in order to demonstrate how a phenodata file should be provided for proper working of function DEGidentifier. Function reads in the .CEL files in the same order with column ‘FileName’ and makes pairs of which file belongs to which group in accordance with the order given in phenodata file. Since the group contrasts are made
automatically by the routine according to the experiment description provided by the user, it is crucial to provide a properly prepared one to get reliable results. ... 40
Figure 14: Venn Diagram representation of probe numbers with significant differential expression between the given groups (p≤0.01). Diagram obtained by the routine with
VennDiagram function. ... 42
Figure 15: Heatmap generated with the expression values of significantly differentially expressed genes. Note the similarity between the levamisole- and nicotine-treated samples (p<=0.01) while both are contrasting with control samples. Red color: up-regulation; Blue color: down-regulation. Picture generated by the routine using heatplot function of the package made4 (Culhane). ... 43
Figure 16: Fold change correspondence between gene groups affected by nicotine and
levamisole in comparison with control. Image was generated with the help of plot function of the graphics package (R_Development_Core_Team, 2010). ... 44
Figure 17: Fold change correspondence between gene groups affected by either levamisole (left) or by nicotine versus gene groups that differ between nicotine and levamisole. Image was generated with the help of plot function of the graphics package
(R_Development_Core_Team, 2010). ... 45
Figure 18: Bar plots of top 5 categories in GO Biological Processes of DEGs up- or
down-regulated by nicotine. Generated by KEGGscript function. ChartPlotter and PlotCharts functions are used for plotting. Function benefits from GeneAnswers package of BioConductor. a)GO Processes in up-regulated DEGs by nicotine; b) GO Processes in down-regulated DEGs by nicotine. Images were generated by KEGGscript function with the help of ChartPlotter and
PlotCharts, two functions modified from equivalent functions of GeneAnswers package (Feng
et al., 2001). ... 52
Figure 19: GO Biological Processes of DEGs up-regulated by levamisole. Images was generated by KEGGscript function with the help of ChartPlotter and PlotCharts, two functions modified from equivalent functions of GeneAnswers package (Feng et al., 2001). ... 53
xii
Figure 20: Barplots of top 5 categories in KEGG Pathways of DEGs down-regulated by nicotine. Images was generated by KEGGscript function with the help of ChartPlotter and PlotCharts, two functions modified from equivalent functions of GeneAnswers package (Feng et al., 2001). 53
Figure 21: KEGG Pathways in DEGs up-regulated by levamisole. Images was generated by
KEGGscript function with the help of ChartPlotter and PlotCharts, two functions modified from
equivalent functions of GeneAnswers package (Feng et al., 2001). ... 54
Figure 22: GO Biological Processes of DEGs down-regulated by levamisole. Images was generated by KEGGscript function with the help of ChartPlotter and PlotCharts, two functions modified from equivalent functions of GeneAnswers package (Feng et al., 2001). ... 54
Figure 23: Efficiency curves for primers of the selected confirmation genes. The x-axis shows logged values of relative concentration points of the cDNA samples (1000 for undiluted standard cDNA; 100 for 1:10 dilution; 10 for 1:100 dilution and 1 for 1:10000 dilution) and the y-axis shows the Ct values... 58
Figure 24: Confirmatory real-time results of given genes. All except MKI67 are in line with the microarray data findings (see Table 10 for correlation analyses results). ... 59
Figure 25: Steroid biosynthesis pathway in group comparisons. Generated by Grapher function. Differences between the expression values and fold-change ratios are powerfully represented with supportive visual graphs. Grapher depicts the KEGG pathway information of a set of KEGG IDs, which is the union of separate subsets obtained from separate implementations
xiii
LIST of TABLES
Table 1: Major metabolites of nicotine and enzymes that take role in catalyzing those conversions. Human Affymetrix probe identifiers are given for HGU133Plus2 Chip. Adapted from Affymetrix website. ...6
Table 2: Sequences and efficiencies of the primers of the genes selected for confirmatory real-time PCR experiments. ... 23
Table 3: Summary of RNA degradation information of arrays. Note that slopes of all plots are comparable and below 3, the value advised by Affymetrix as a maximum. P value is calculated by AffyRNAdeg function internally from linear regression of means by number. ... 38
Table 4: Table showing the number of probes differentially expressed between groups. (*) Gene numbers are obtained by ID conversion. Probe IDs with no known gene symbols (NAs) are removed from gene lists. ... 43
Table 5: Detailed numbers of probes differentially expressed between groups. ... 44
Table 6: Hypergeometric testing results of GO terms of genes differentially expressed in response to nicotine. Table is generated by GO_HyperG function. There were about 200 significantly overrepresented GO terms (see Appendix). Top 15 are provided here (p≤0.05). .. 47
Table 7: Hypergeometric testing results of GO terms of genes differentially expressed in response to levamisole. Table is generated by GO_HyperG function. There were about 150 significantly overrepresented GO terms (see Appendix). Top 15 are provided here. p≤0.05. .... 48
Table 8: KEGG Pathways overrepresented in nicotine and levamisole data. Lists generated by
KG_HyperG function (p≤0.05). ... 49
Table 9: KEGG pathways effected by nicotine or levamisole treatment. All available KEGG pathways are evaluated in terms of genes and pathway coverage percentage values. Top results are provided here; for full result see Appendix. Table was generated by KEGGscript function. ... 50
Table 10: Fold changes of confirmation genes in microarray data and qPCR experiment. qPCR fold change values were calculated with ΔΔCt method (Pfaffl, 2001) and original results were logged. Note the similarity between profile pairs, except for MKI67. Correlation analyses between profiles from microarray fold-change and qPCR fold-change were performed: for nicotine ρ = 0.9175, p-value = 0.0099; for levamisole: ρ = 0.9652, p-value = 0.0018. (MKI67 was excluded from correlation analyses). ... 56
Table 11: Full KEGGscriıpt results. ... 82
1
1. INTRODUCTION
1.1. Nicotine
1.1.1. History of nicotine – A general overview
Although tobacco is known to have been consumed for over two thousand years, nicotine, the addictive component of tobacco, was discovered within the last two centuries. Initial isolation of nicotine dates back to 1807 yet nicotine was first purified and identified as an alkaloid with a molecular formula of C10H14N2, by Reimann and Posselt in 1828 (Borio, 1995-2010).
In the 20th century nicotine and nicotine containing compounds were used in agriculture and stock breeding as insecticides, and research records show that the scientists were interested in the effects of nicotine on nervous system, muscle irritability as well as agricultural aspects of its usage. The first study to investigate the role of nicotine in smoking habit came in 1945 (Finnegan et al., 1945). The first powerful links between smoking and lung cancer was not provided until 1950 when three different
epidemiologic studies, one published in Britain and two published in the United States, demonstrated an association (Doll and Hill, 1950; Levin et al., 1950; Wynder and Graham, 1950). In 1955, Essenberg et. al. published a study on experimental lung tumor incidence in mice exposed to tobacco smoke from cigarettes low in nicotine (Essenberg et al., 1955). In the second half of the century, nicotine and cancer relationship has been one of the most investigated aspects of nicotine effect on human health. By no means less important, such popularity brought the chance of broad investigation of nicotine
2
along the 20th and 21st centuries in all aspects of health and disease, including toxicity, pharmacology, neurobiology, development, and even in its therapeutic usage.
1.1.2. Structure and Properties
IUPAC (International Union of Pure and Applied Chemistry) name of the nicotine is 3-(1-methyl-2-pyrrolidinyl)pyridine. It is bicyclic compound with a pyridine cycle and a pyrrolidine cycle (Figure 1)
Elemental components of nicotine are carbon, hydrogen and nitrogen, and the molecular formula of nicotine is C5H4NC4H7NCH3 while the molecular weight is 162.23 grams per mole.
Nicotine, melting at -79oC and boiling at 247oC, is found in its liquid state at room temperature. It is miscible in water; very soluble in ethyl alcohol, ether, and chloroform (PMEP, 1985).
1.1.3. Metabolism
Nicotine is a weak base with a pKa of 8.0 (Fowler, 1954) and its absorption is reduced in its ionized form. Therefore, absorption of nicotine is dependent on the pH of the smoke: the more alkaline the smoke, the more unionized and the easier absorbed the nicotine in
Figure 1: Chemical structure of nicotine. Adapted from (Benowitz and Jacob, 1994)
3
mouth (Armitage et al., 1978; Brunnemann and Hoffmann, 1974; Gori et al., 1986; Sensabaugh and Cundiff, 1967). Being carried in basic tar droplets, a larger portion of the nicotine stays in unionized form which facilitates rapid pulmonary absorption (Hukkanen et al., 2005; Pankow, 2001; Pankow et al., 2003). After a puff, nicotine is rapidly absorbed in the fluid with a pH of 7.4 in the human lung and high levels of nicotine reaches to brain in 10 to 20 seconds (Benowitz, 1990; Hukkanen et al., 2005). Thus, nicotine‟s effects on the physiological state of an organism can be rapid and might depend on the dose and timing of the exposure.
Nicotine acts through binding nicotinic acetylcholine receptors (nAChRs) (discussed below) and exerts its effects through downstream effectors. From this route nicotine is able to enter to cell with endocytosis of desensitized receptors (Green and Millar, 1995; Kittler and Moss, 2001). On the other hand, nicotine can also enter to the cell itself; unlike for acetylcholine (ACh), membranes are readily permeable to nicotine, as it permeates at least through alveoli and capillary walls (Lester et al., 2009). Therefore, it is plausible that nicotine passes the cellular membrane also. As a matter of fact, it was shown that nicotine can promote assembly of α4β2 AChRs by inducing an active or desensitized conformation in the ER lumen (Kuryatov et al., 2005), which indicates nicotine, either permeating through the membrane or being internalized by endocytosis process, takes intracellular roles besides acting excitatory for nAChRs.
There are six major metabolites of nicotine. The most important of these is cotinine to which about 70 to 80% of the nicotine is converted (Benowitz and Jacob, 1994). In this transformation nicotine is first converted to nicotine iminium ion, by a cytochrome P450 system, primary enzyme being CYP2A6 (Murphy, 1973) and second iminium ion is
4
converted to cotinine by a cytoplasmic aldehyde oxidase (AOX1) (Brandange and Lindblom, 1979). Cotinine is then metabolized to trans-3‟-hydroxycotinine again by CYP2A6 (Nakajima et al., 1996). Another primary metabolite is nicotine N –oxide and this conversion is catalyzed by a flavin – containing monooxygenase 3 (FMO3)
(Cashman et al., 1992). A study in 1975 demonstrates that this metabolite is not further metabolized and rather is reduced back to nicotine (Dajani et al., 1975) while another indicates that this reduction takes place in large intestine (Beckett et al., 1970). These two metabolites, cotinine and nicotine N-oxide, are formed by oxidation of the pyrrolidine ring.
Two other metabolites are formed by a methylation and glucuronidation of the pyridine ring, respectively: nicotine isomethonium ion (N-methylnicotinium ion) (McKennis et al., 1963) and N-quaternary glucuronide (Benowitz and Jacob, 1994). Nicotine
isomethonium ion formation is likely to be catalyzed by indolethylamine methyltransferase (INMT) enzyme, which is also known as nicotine
N-methyltransferase. Dwoskin et al reported that nicotine isomethonium ion inhibits dopamine uptake in rat striatal slices and discussed that this point as to be explanatory for inverse relationship between smoking and Parkinsonism (Dwoskin et al., 1992). They further discussed that their structural relationship to neurotoxin MPP+ may be indicative of a possible protective role of N-methylated nicotine metabolites against Parkinson‟s Disease. N-quaternary glucuronide is formed via glucuronidation of the nicotine by uridine diphospate-glucuronosyltransferase (UGT) enzymes (Seaton et al., 1993) and 3 to 5% of the nicotine is known to be converted to this metabolite and excreted in urine. However, in later steps of nicotine metabolism, cotinine and
trans-3‟-5
hydroxycotinine also shown to be glucuronidated and excreted in urine as cotinine N-glucuronide and trans-3‟-hydroxycotinine O-N-glucuronide (Benowitz and Jacob, 1994; Byrd et al., 1992; Yamanaka et al., 2005b). Therefore, when cumulative effect is considered, glucuronidation becomes a major reaction in nicotine metabolism and enzymes catalyzing these conversions show extensive variation with differential contribution and selectivity (Berg et al., 2010; Kaivosaari et al., 2007; Kuehl and
Murphy, 2003; Lessov-Schlaggar et al., 2009). UGT enzymes take part in metabolism of not only nicotine but also in elimination of other drug toxicities and xenobiotic
compounds (Cecchin et al., 2009; Derby et al., 2009; Ritter, 2000; van der Bol et al., 2010) . These metabolic reactions take place in liver. Nevertheless, different tissues, particularly colon, also have expression of UGT enzymes and interestingly were found to be responsive to nicotine or drug treatments in terms of up-regulation or down-regulation of UGT enzymes (Kaivosaari et al., 2007; Kaya, 2009). Furthermore, one of these enzymes, UGT1A6, was found to be strongly upregulated, while UGT1A1, A3, -A4, -A5, A7, -A8, -A9 and –A10 were detectably up-regulated in SW620 colon cancer cells in response to serum starvation combined nicotine treatment (Kaya, 2009).
Fifth metabolite is nornicotine, by oxidative N-demethylation of nicotine (Neurath et al., 1991) and nicotine to nornicotine conversion was shown to be catalyzed by CYP2A6 and CYP2B6 in human liver (Yamanaka et al., 2005a). The last one is
2‟-Hydroxynicotine and this conversion is mediated by cytochrome P450 (CYP2A6) (Hecht et al., 2000).
Although there are several carcinogenic compounds, such as nicotine and alkaloids in tobacco smoke, like N'-Nitrosonornicotine (NNN),
4-(methylnitrosamino)-1-(3-pyridyl)-6
1-butanone (NNK), alcoholic derivative of the NNN (NNAL), and their metabolites (Hecht, 2002; Hoffmann et al., 2001), there is no study established to our knowledge showing carcinogenic effects of nicotine metabolites mentioned above. Furthermore, these carcinogenic compounds have been shown to be converted to non-carcinogenic metabolites and interestingly some of these derivatives are nicotine metabolites, like norcotinine and 3'-hydroxynorcotinine (Hatsukami et al., 2004; Hecht, 2002; Upadhyaya et al., 2002), which are further subjected to reactions given for nicotine metabolism. The enzymes involved in nicotine metabolism and glucuronidation are listed in Table 1
together with corresponding AffyIDs.
Table 1: Major metabolites of nicotine and enzymes that take role in catalyzing those conversions. Human Affymetrix probe identifiers are given for HGU133Plus2 Chip. Adapted from Affymetrix website.
Metabolite Enzyme catalyzing conversion from nicotine
Affy IDs for enzymes/enzyme groups on HGU133Plus2 Affy Chip
Cotinine CYP2A6, Aldehyde oxidase (AOX1) CYP2A6: 1494_f_at, 211295_x_at,
207244_x_at, 214320_x_at
AOX1: 205082_s_at, 205083_at Nicotine N-oxide flavin – containing monooxygenase 3
(FMO3) 206496_at, 40665_at Nicotine isomethonium (N-methylnicotinium) ion indolethylamine N-methyltransferase (INMT) 224061_at N-quaternary glucuronide diphospate-glucuronosyltransferase (UGT) enzymes 208596_s_at, 215125_s_at, 206094_x_at, 221304_at, 221305_s_at, 207126_x_at, 204532_x_at, 236597_at,
208358_s_at, 237572_at, 232654_s_at, 206505_at, 207958_at, 211682_x_at, 235904_at, 219948_x_at, 207245_at, 207392_x_at, 228956_at,
216687_x_at, 217175_at, 232655_at
Nornicotine CYP2A6, CYP2B6 CYP2B6: 217133_x_at, 206755_at,
206754_s_at
7
1.1.4. NACHRS: Structure, function and localization
The nicotinic acetylcholine receptors (nAChRs) are members of a superfamily of
receptors involved in ligand-gated ion transmission in both neural and muscular systems. Together with cholinergic muscarinic receptors, neuronal nAChRs have central role in mediating ACh message transduction. Their role in mediating fast actions of ACh in neuromuscular junctions and nervous system is well defined (Arias, 1997; Changeux and Edelstein, 1998; Gaimarri et al., 2007; Gotti and Clementi, 2004; Lena and Changeux, 1998). They have widespread expression in nervous system and they transduce
cholinergic signals in many brain areas and peripheral ganglia. nAChRs mainly have pre-synaptic localization in central nervous system and modulate neurotransmitter release, nevertheless in some areas they are localized post-synaptically and mediate fast synaptic transmission (Dajas-Bailador and Wonnacott, 2004; Gotti and Clementi, 2004; Jensen et al., 2005). Although originally classified as “neuronal” and “muscular”, later in time they are found to be expressed in a wide range of tissues including muscle,
lymphoid tissue, macrophages, skin, lung cells, vascular tissue, and astrocytes (Gotti and Clementi, 2004). Additionally, in previous studies we have shown colonic expression, in human SW620 colorectal cancer cells, and liver expression in zebrafish (unpublished data).
nAChRs are composed of homo- or heteropentamers of subunits, which are classified to five groups: α, β, γ, δ and ε. γ, δ and ε subunits are usually thought to be auxiliary subunits and a nAChR is denominated according to its α and β content on the grounds that these two subunits are important for pharmacological specificity and sensitivity of a complete receptor (Luetje and Patrick, 1991). Ten α-type (α1-α10) and four β-type
(β1-8
β4) subunits are identified in human to date, among which α1 and β1 are muscle type subunits and others are classified to be of neuronal type. All subunits have four transmembrane domains with an intracellular loop between third and fourth, and both amino- and carboxy-terminal portions are localized extracellularly.
Five subunits are needed to build up a fully functional receptor, and receptor
composition and subunit stochiometry is decisive for specificity and functionality. Only α7 and α9 subunits are capable of forming homopentamers, on the other hand receptors containing α2-α6 and β2-β4 subunits form only heteromeric receptors (Gotti and Clementi, 2004; Lindstrom, 2000).
1.1.5. nAChRs and Cancer in Human
Cholinergic signaling and nAChR involvement in several cancer types have been shown in previous studies (Schuller, 2009), since these receptors regulate neurotransmitter release which in turn might activate release of different growth factors. For instance, α7 homomeric receptors, shown not to be desensitized unlike heteromeric receptors (Kawai and Berg, 2001), release adrenaline and noradrenaline which in turn increases epidermal growth factor (Carlisle et al.), vascular endothelial growth factor (VEGF) and
arachidonic acid (AA) (Heeschen et al., 2002; Wong et al., 2007). On the other hand, α4β2 heteromeric receptors stimulate γ-aminobutyric acid (GABA) release (Al-Wadei and Schuller, 2009), which has been shown to inhibit tumor growth in colon (Joseph et al., 2002), breast (Drell et al., 2003), lung (Schuller et al., 2008b) and pancreas (Schuller et al., 2008a).
9
There is not much known about the association of muscle type nAChRs, α1 and β1, with cancer. Only one study has shown increased expression of these subunits in non-small cell lung cancer (NSCLC) (Carlisle et al., 2007). However, both of these subunits are involved in congenital myasthenic syndrome with mutations (Garchon et al., 1994; Quiram et al., 1999).
1.1.6. Nicotine and SW620 Cells
Previously, our group have investigated the effects of nicotine on colon cancer cells under serum deprivation (0.1% FBS) and normal growth conditions (Kaya, 2009). In that study it was shown that, when treated with serum deprivation, 1μM nicotine affected KEGG pathways such as cell cycle, calcium signaling and MAPK, cell adhesion and cell communication pathways, glucuronidation metabolism, coagulation cascade, ribosomal genes and purine-pyrimidine metabolism genes. Furthermore, that study have revealed that nicotine had the ability to relieve the cell proliferation from serum deprivation-induced suppression and saves the cells from starvation-deprivation-induced apoptosis. However, that study also have shown that nicotine when given to cells under normal growth conditions (10% FBS) for 2 days did not demonstrate such an effect. A 2 day treatment can perhaps be considered acute whereas 7 and 14 day treatments are rather chronic.
1.2. Levamisole
1.2.1. Structure, Properties and Antihelminthic Mode of Action
Levamisole, L-isomer of tetramisole, was originally discovered at Janssen Pharmaceutica in 1966 and it is a synthetic derivative of imidazothiazole
10
(HelminthInfections, 2010). Figure 2 is a drawing representing the chemical structure of levamisole. Levamisole is also a weak base, like nicotine, with pKa of 8.0 and generally sold as hydrochloride salt form on the market with a molecular weight of 241 grams per mole (Yakoub et al., 1995). Additionally, it is light sensitive and stable under ordinary conditions. It melts at about 230 to 233oC and is soluble in water (Yakoub et al., 1995).
Levamisole has a broad use as an antihelminthic in livestocks since it eliminates parasitic worms by paralysis. Other than the agricultural use, given the fact that over 1 billion people in the developing world are infected with intestinal nematodes (Bethony et al., 2006), levamisole is also important in solving public health problems.
Levamisole binds to acetylcholine receptors and causes body-wall muscle hypercontraction, spastic paralysis, and ultimately death of parasites (Lewis et al., 1987a; Lewis et al., 1987b). Levamisole is reported to be sensitive to receptors on nematode and that it does not activate the AChRs on the host (Rayes et al., 2004), and such difference was thought to be due, nevertheless biophysical similarities of receptors, to the pharmacological differences between the nematode and mammalian host.
However, molecular basis of such specificity was not elucidated enough. In a more recent study, Boulin et al showed that levamisole-specific AChRs were different from those bind nicotine (Boulin et al., 2008) and this may explain the specificity as to be not at the species level but at the molecular level. Nicotinic and levamisole-specific
acetylcholine receptors will be discussed in detail later.
11 1.2.2. Metabolism
Levamisole was found to have a fast absorption and metabolism in humans after oral administration so that unchanged drug peak was reported to be reached 2h after dosing of 3H-levamisole while at this time about 60% of the radioactivity was reported to be found in the form of metabolites (Roberts, IPCS INCHEM). Levamisole is extensively metabolized in humans and only about 4 to 5% is excreted unchanged. Experiments on levamisole metabolism were performed generally on isolated hepatocytes of dogs, sheep, cattle, pigs and human; and some on rats and monkeys. One of the two major pathways is dehydrogenation and subsequent sulfoxidation of the imidazolidine ring, while the second being aromatic hydroxylation. This p-hydroxy levamisole has a glucuronide conjugate and together they make up to 17% of the administered levamisole. These experiments were performed in Janssen Research Foundation and submitted to World Health Organization (WHO) as unpublished experimental and preclinical reports (Roberts, IPCS INCHEM).
1.2.3. L-AChRs: Structure, function, localization
L-AChRs (levamisole-sensitive AChRs) are acetylcholine receptors sensitive to levamisole and similar to nAChRs, they are ligand gated ion channels functioning as pentamers. These receptors have greatly been studied in worm species, especially in nematode C. elegans where most of the information about them came from. C. elegans has the most extensive subunit variation of acetylcholine receptors with 27 subunits identified and provided on WormBase, 10 of which were identified from levamisole-resistance or neuronal degeneration studies and 17 from functional genomics studies
12
after completion of its genome sequencing: unc-63/lev-7, unc-38, deg-3, des-2/acr4, acr5-12 and acr15-24 are alpha type; unc-29, lev-1, acr2, acr3, acr14 and acr25 are non-alpha type subunits (Ballivet et al., 1996; Baylis et al., 1997; Fleming et al., 1997; Jones and Sattelle, 2004; Mongan et al., 1998; Mongan et al., 2002; Squire et al., 1995; Treinin and Chalfie, 1995; Treinin et al., 1998; WormBase, 2010). Other than these AChR subunits, ric-3 (Halevi et al., 2002; Halevi et al., 2003), unc-50 (Eimer et al., 2007) and unc-74 (Lewis et al., 1980) are found to be required for in vivo expression of L-AChRs.
In C. elegans neuromuscular junctions, excitatory neurotransmission is mediated by L-AChRs and UNC-29, UNC-38 and UNC-63 were found to be absolutely required for a functionally active receptor (Boulin et al., 2008; Culetto et al., 2004; Fleming et al., 1997; Lewis et al., 1987b; Rayes et al., 2007).
One of the key points for safe usage of levamisole as medical and agricultural antihelmintic is the discrimination between the parasite and the host receptors. Acetylcholine receptors of human and other mammalians were investigated for
levamisole sensitivity and levamisole was found to be a weak agonist of human nAChRs (Levandoski et al., 2003; Rayes et al., 2004). Another study revealed that nicotine-sensitive and levamisole-nicotine-sensitive receptors of C. elegans were innicotine-sensitive to the ligands of each other (Boulin et al., 2008). Taken together, the data raised questions about the efficacy of levamisole in medical considerations other than soil transmitted helminth infections and antiparasitic in livestocks.
13
Two most important of medical conditions treatment with levamisole might be relevant to are nephrotic syndrome and adjuvant treatment of colon cancer in
combination with 5‟ fluorouracil. While levamisole could not strongly activate human nAChRs, how it could have systemic effects, such as remission of edema, oliguria (Dayal et al., 1994), disappearance of proteinuria in nephrotic syndrome (Rashid et al., 1996), increase in disease free and overall survival in colorectal cancer (Laurie et al., 1989; Moertel et al., 1990), in human is still a mystery.
Furthermore, despite levamisole effect on these diseases in human was successfully shown in many studies, limitations of both success-showing and failure-showing studies and additional inconsistencies between the limitations of those studies has made the issue much more complicated. Therefore, research of how levamisole exerts its effect on mammalian cells and systems has been overshadowed among the debate of presence or absence of such effect.
1.2.4. Levamisole and Apoptosis
In addition to antihelmintic activity of levamisole, it was also shown to act as an
apoptosis inducer. Investigation of such a role for levamisole was motivated by its usage in colorectal cancer chemotherapy, which will be discussed later in this study, as an adjuvant in combination with 5-Fluorouracil. One of the most detailed studies came from Artwohl et al in 2000 (Artwohl et al., 2000). In this study, levamisoleat 0.5 mM, 1 mM, 2 mM and 5 mM concentration levels was shown to be a strong apoptotic inducer in human umbilical vein endothelial cells, adult human venous endothelial cells, and human uterine microvascular endothelial cells; but not in fibroblasts. One study with
14
human hepatoblastoma (HepG2) cells shows that levamisole, by being an activator of cystic fibrosis transmembrane conductance regulator (CFTR) Cl- channels, inhibits the apoptosis induction by glibenclamide (Kim et al., 2001), which was also shown to induce apoptosis by inhibiting CTFR Cl- channels in HepG2 cells (Kim et al., 1999). Taken together, levamisole might have a controversial association with apoptosis and/or apoptotic machinery. It appears levamisole is actually not an apoptotic or anti-apoptotic agent per se, but may be involved in the process in a very indirect manner depending on the context of apoptosis (intrinsic or extrinsic pathways), on the receptor status of the cell for levamisole, and on the dose of application, and finally on the cell type itself. Such an interpretation is also in line with the fact that there is no study established to our knowledge that could able to show a more direct interaction between any of the
components of central apoptotic machineries and levamisole.
1.2.5. Levamisole, Colorectal Cancer and Cell Proliferation
Levamisole was considered for adjuvant chemotherapy for colon cancer in combination with 5‟Fluorouracil and it this chemotherapy was offered as standard for especially late stage colorectal cancer cases by National Cancer Institute Consensus Conference in 1990 (NIH_Consensus_Conference, 1990). Studies for levamisole usage in colorectal cancer therapy started after 1990 and have mostly been based on two studies, preceding the NIH Consensus Conference (Laurie et al., 1989; Moertel et al., 1990). Levamisole has been tried for immunomodulatory effect in colorectal cancer since its immune enhancing effect had been appreciated already (Dahl et al., 2009; Laurie et al., 1989; Leibovici et al., 2009). Levamisole‟s effect on cell proliferation is also based on findings showing an enhancement of Th1 immune response and increased number of natural killer (NK) cells
15
(Holcombe et al., 1998; Zhang et al., 2009). However, there had been many studies unable to verify an efficient role for levamisole either in disease free survival (DFS) or overall survival (OAS) in colorectal cancer (Cascinu et al., 2003; De Placido et al., 2005; O'Connell et al., 1998). At the end, the role of levamisole in colon cancer treatment remained inconclusive, and it was withdrawn from clinical usage. After 2003, Jansen-Cilag, pharmaceutical company that discovered levamisole in 1960s and produced since then, decided to stop production of ergamisol, the brand name for levamisole, for clinical usage (Davin and Merkus, 2005). Indeed, there is a need to decipher the role of
levamisole, which had been frequently used as an adjuvant therapy, without knowing downstream molecular effects.
1.2.6. Levamisole and Nephrotic Syndrome
Levamisole has been tried for steroid-sparing effect in nephrotic syndrome (Davin and Merkus, 2005; Tanphaichitr et al., 1980), which is a disorder with protein loss from blood to urine, with damaged kidneys. Since nephrotic syndrome treatment widely includes corticosteroids, with adverse effects in steroid-sensitive patients with nephrotic syndrome. Based on the study by Tanphaichitr et. al in 1980, levamisole was studied for sparing steroid from disease treatment, in other words, for reducing the steroid content of treatment. Although this issue has also remained inconclusive and overshadowed by the debates of presence or absence of a sufficient effect, there has not been any study to date questioning why levamisole should have such effect if any, and what could be the relationship between steroid metabolism and levamisole.
16
1.3. Microarray Analysis Methods
1.3.1. Microarray Analysis Programs Based on R Environment
Microarray studies have become widespread and enormous amounts of data have emerged and continue to do so. It is crucial for a transciptomics dataset to be correctly preprocessed, analyzed and interpreted since the quality of these steps has decisive role in making the findings of the study meaningful. The flourishing of microarray
experiments as a high throughput method has brought the necessity of designing tools for helping in handling and statistical evaluation of such large datasets, and functional interpretation of biologically relevant findings.
R, an open-source programming language and environment developed for statistical computing and graphics, provides a nice opportunity and beneficial means for analysis of microarray data (R_Development_Core_Team, 2010). Nevertheless, R has a script based environment and its interface, like all other programming environments, might be difficult to handle for inexperienced users without adequate mathematical, statistical and computational background. Such difficulties create the need for design and production of customized routines and/or software to ease analysis steps. Therefore, R has a unique place since it contains a large array of packages geared for microarray preprocessing and analysis, although others exist that are based on C, Java, and Matlab®.
Most of the web based services designed to perform multistep microarray analysis service provide mostly the statistical analysis of the data, with fixed parameters or with limited parametric options (http://crcview.hegroup.org,
17
always not be included in such analyses; yet quality control is of special importance because if any of the arrays is poor in quality then it exerts a bias on the following statistical analyses. Such shortcomings and fragmentation of the whole analysis makes working on such high throughput datasets tedious; thus customized routines written in R and geared toward the user‟s own experimental design and analysis requirements are usually needed.
One of the array analysis software based on R is BRB Array Tools, developed by Richard Simon and BRB-Array Tools Development Team, and works as an add-in with Microsoft© Excel® interface. This tool utilizes an Excel® frontend, which cannot be run under a Linux/Unix system, whose use might provide additional flexibility in integration of customized R routines into the analysis packages and larger memory options. In addition, functional analyses provided by BRB tools do not include gene network visualization. Other efficient R-based tools include Bionforx
(http://bioinforx.com/), which is proprietary, WebArray (Wang et al., 2009; Xia et al., 2005; Xia et al., 2009), EMAAS (https://www.emaas.org/EMAAS/), CARMAweb (Rainer et al., 2006); these serve the users online. Finally Babelomics team also employ a comprehensive microarray analysis service in their website based on analysis of gene lists, with Babelomics version 4.0 (www.babelomics.org). All of these tools and services are based on R environment and make use of BioConductor Project packages, especially in normalization and statistical analysis steps. Although such tools available and highly useful, having a customized R-routine to the user‟s experimental design, which is also modular and expandable, makes possible to add the most appropriate statistical design,
18
visualization and analysis tools as well as the recent algorithms and packages available in R environment.
1.3.2. BioConductor
BioConductor (www.bioconductor.org) is a software project with open source and open development features, and designed to produce tools for high-throughput genomic data analysis (Gentleman et al., 2004). Being primarily based on R programming language, most important part of the project is that it is composed of purposive R-packages, which can be downloaded via BioConductor‟s website and installed into R library. By
definition a „package‟ is designed to include related software components and
documentation for purposive objectives. Packaging system is well established in R and provides independent yet interoperable modules for usage in high-throughput data analysis to achieve various statistical analytic tasks and for visualization purposes. On the other hand, BioConductor provides annotation data packages, which ease mappings between different identifiers, such as affy IDs and Entrez genes, and such service enables association of array data to biological metadata from web databases. These annotation tools are beneficial for assembling and processing genomic annotation data from GenBank, Entrez genes, Unigene, Gene Ontology (GO) Consortium and USCS Human Genome Project. Since Bioconductor is an open source environment, microarray analysis packages available within the environment that range from quality control to differential expression and to functional analyses, can be easily integrated into the custom routines written in R.
19
Once microarray data has undergone processing procedures and statistical analyses, functional analyses of the genes that have been identified to be differentially expressed should be performed. This step is of crucial importance on the grounds that only then the holistic impact of the experiment on the cellular response could be evaluated. Questions regarding the cellular processes and pathways that are influenced from the experiment find their answers with the comprehensive functional analyses that allow a more complete understanding of the nature of the experiment.
There are several online software tools concerning functional analysis, all of which incorporate either Gene Ontology (GO) information or Kyoto Encyclopedia of Genes and Genomes (KEGG) pathways or enrichment analysis with predefined or customized gene sets. Some of these services are provided by DAVID
(http://david.abcc.ncifcrf.gov/), WebGestalt (http://bioinfo.vanderbilt.edu/webgestalt/), PathwayMiner (http://www.biorag.org/), GSEA (http://www.broadinstitute.org/gsea/), GSEA Molecular Signature Database (http://www.broadinstitute.org/gsea/msigdb/), Babelomics (www.babelomics.org), Ingenuity (http://www.ingenuity.com/).
20
2. AIM of THE STUDY
This study uses microarray analyses methods to understand the differences and similarities between the levamisole and nicotine, two of the cholinergic agents with medical implications, on the SW620 colon cancer cells.
Here in this study we aim to assess the influences of these two agonists of nAChRs on human cells in terms of transcriptome profiling and the interpretation of functional implications and indications based on their differential and similar responses. Although thought as a therapeutic agent in several human disorders including colorectal cancer and nephrotic syndrome, levamisole has previously not been investigated for its effect at the cellular level. Furthermore, there exists no study established to our knowledge assessing the effects of levamisole on global transcriptional profile of the cells. Given the fact that efficiency studies on disorders, for which levamisole has been concerned as a therapeutic agent, remained inconclusive, we believe that our study will shed much light to comprehend an exact role for levamisole in treatment of those disorders at the dose specified in our experiments. On the other hand, we approached to the issue with a comparative manner and we compared and contrasted the effects of levamisole with nicotine; this approach is sound because inasmuch as both compounds are agonists of nAChRs, there is not a levamisole-sensitive receptor subset in humans. Furthermore, nicotine is known to have different effects upon acute or chronic exposure. Previous studies (Onur Kaya, 2009 Ms. Thesis) in our lab showed that a short term treatment of SW620 cells with 1μM nicotine did not result in large numbers of genes being
21
levamisole for an extended period of 7 days at which the exposure could be called chronic (Pakkanen et al., 2006; Sun et al., 2003).
For data analysis, a customized R-routine was written using the available resources in BioConductor and related R packages to perform an automated analysis of one-factor experimental design of Affymetrix arrays (or any single-channel data) with two or more groups; the aim was to perform the analyses from the very beginning to the end,
seamlessly; so the steps included routines for array quality control assessment,
differential expression, functional analysis and annotation, in a streamlined manner. We provide a generic implementation to enable the usage of the routine in any expression data independent of the number of groups. Results are generated in R and saved to a user defined directory with a given denomination extracted from the experiment descriptor file. Accordingly, we aim to provide a useful, strong and easily handled and expandable tool for researchers inexperienced in the analysis of large datasets; for the experienced ones we aim to provide additional flexibility with several options in analysis parameters.
In general, our study aims to i) provide a streamlined routine for the analysis of one-factor experimental design of Affymetrix arrays using R programming language; ii) to generate list of genes similarly modulated by nicotine and levamisole; iii) to generate list of genes differentially modulated by nicotine and levamisole; iv) to perform functional analyses on these lists by the provided routine and finally v) to confirm the expression pattern obtained from array data of selected genes using real-time polymerase chain reaction (PCR) in SW620 cells exposed to levamisole or nicotine.
22
3. MATERIALS AND METHODS
3.1. Levamisol and Nicotine Treatment of Cells for Microarray and
RT-PCR analysis
SW620 colon cancer cells were seeded into the 75 cm2 flasks with a density of 1x10⁶ cells per flask in DMEM supplemented with 10% fetal bovine serum (FBS) and 0.1% penicillin/streptomycin (P/S) mixture. Cells left for 24h for attachment to the plate and then medium was replaced with 0.1% FBS-containing medium to make cells quiescent (synchronization). Media then were replaced with fresh media that contain 1 μM nicotine- or 1 μM levamisole Media with treatments were replenished every 3 days. Cells incubated at 37oC with 5% CO2. Cells were gathered from the plates at day 7 or 15. For detaching cells from plate, trypsin/EDTA was used which was then neutralized by growth medium. Cells were centrifuged at 1200 rpm for 3 minutes, washed with PBS and stored at -80oC. Microarray optimizations, cell culture experiments and sample preparations were performed by Onur Kaya, a former MS student at Bilkent University.
3.2. RNA extraction, cDNA synthesis and real-time PCR experiments
RNA extraction was performed with Promega SV Total RNA Isolation Kit according to the manufacturers protocols except for some of the cases, a second DNAse treatment step preceding elution was added (Z3100; Madison, USA). cDNA synthesis was performed with Fermentas RevertAid™ First Strand cDNA Synthesis Kit (K1631; Lithuania). For confirmatory real-time PCR experiments, DyNAmo HS SYBR Green qPCR Kit from Finnzymes (F410L, Espoo, Finland) was used and experiments were
23
carried on Bio-Rad iCycler machine. Primers were designed with Primer 3.0 (Rozen and Skaletsky, 2000). Real time PCR conditions for all primers were as follows: 95oC 10 min; 45 cycles 95oC 30 s, 60oC 30s, 72oC 30 s; 72oC 10 min. Real-time PCR experiment data were analyzed with Pfaffl method: ratio=[(Etarget)deltaCt target (control-treated) / (Eref)deltaCt ref (control-treated)
] (Pfaffl, 2001); reference gene was chosen as beta-actin, which showed no
difference both in our microarray data and real time PCR experiments.
Table 2: Sequences and efficiencies of the primers of the genes selected for confirmatory real-time PCR experiments.
Gene Primer Sequence Primer Efficiency ACTB 5' CCAACCGCGAGACGATGACC 3' 1.99 5' GGAGTCCATCACGATGCCAG 3' GULP1 5' CAGGCAGTATGACACCTAAG 3' 2.34 5' CAGGTCCCGTTTAATCTCAG 3' CHRNA1 5' GGCATCAAGTACATCGCAGA 3' 2.18 5' TCAATGAGTCGACCTGCAAA 3' CHRNB1 5' CCTGACGTGGTGCTACTGAA 3' 2.18 5' CAGCTGCTGCGATAGATGC 3' MKI67 5' GTGTCAAGAGGTGTGCAGAA 3' 2.28 5' GCCTTACTTACAGAATTCAC 3' XIAP 5' TCACTTGAGGTTCTGGTTGC 3' 2.22 5' CGCCTTAGCTGCTCTTCAGT 3' FOSL2 5' GGCCCAGTGTGCAAGATTAGCC 3' 2.03 5' TTTCACCACTACAGCGCCCACC 3' MAP1B 5' GTTGGAAGGAAAGGCTCAGT 3' 1.99 5' CTTGCTGTTTCTCATGGGTC 3' 3.3. Microarray experiments
Affymetrix GeneChip® U133 Plus2 arrays were used for sample hybridization; and 5μg RNA were used for each experiment (amplification/labeling/hybridization). Three different conditions were used for microarray experiments: 1) 1μM 7 days nicotine treatment, 2) 1μM 7 days levamisole treatment and 3) control; each group included two
24
replicates. Amplification, labeling and hybridizations were performed at the Genomics Core Facility of Bilkent university by the facility technician Bilge Kılıç under the supervision of Assoc. Prof. Dr. Işık Yuluğ according to the manufacturer‟s protocols. GeneChip Operating Software was used for preliminary probe-level quantification as previously described (Kaya, 2009).
3.4. Quality Controls and Pre-processing of the microarray data
For quality control and normalization of the data and for the determination of the differentially expressed genes followed by functional analysis, a streamlined R-routine was written (See Appendix). This R-routine basically has been composed of three different modules, first of which performs the quality control steps and data
normalization (QualCont) while the second identifies differentially expressed genes (DEGidentifier) and the third performs functional annotation and analysis of the results (FuncAnn) (Figure 3). All three modules extensively use BioConductor packages (Figure 4) (www.bioconductor.org).
QualCont reads the data in from .CEL files provided with a phenodata file, an
experiment descriptor file created by the user in a tab delimited text format, uploaded from a given directory. QualCont applies to the raw dataset a user-selected
normalization method (i.e., RMA, gcRMA or MAS5) using the affy package (Gautier et al., 2004) and generates files containing normalized results in a spreadsheet as well as image formats. The function also assigns some of the results into the global environment of R to make some of the results readily available to the user for further analyses in the following modules. The R packages used in the QualCont function are affy (Gautier et
25
al., 2004) and affyPLM (Bolstad, 2004; Bolstad et al., 2005; Brettschneider et al., 2007). QualCont function outputs include: photo images of the chips, normalized data files, histogram representation of the data distribution for the raw and normalized data, MA plots of the raw and normalized data and boxplots of raw and normalized data, and RNA degradation plot of the data (Figure 4). The function saves all these information in the directory provided by the user as the primary input to be used in other functions.
3.5. Determination of Differentially Expressed Genes
Differentially expressed genes were identified by the second function of the R-routine, DEGidentifier. This function has been designed as to apply a linear model and Bayesian statistics for the assessment of differential expression for one-factor randomized design experiment using the limma package in R (Smyth, 2005).
Figure 3: Workflow of the routine. The routine is composed of three modules, each of which is composed of related functions. At each step, results are automatically saved to the user-defined directory, with appropriate denomination.
26
Accordingly, the contrast groups are formed also by the function based on the experiment description phenodata file, location of which is provided by the user. Normalized data are then fitted to a linear model for each gene, and estimated
coefficients and standard errors are computed and finally differentially expressed genes are determined by empirical Bayesian methods. The R packages used in DEGidentifier module are: affy (Gautier et al., 2004), limma (Smyth, 2005) and
hgu133plus2.db (Carlson et al., R package version 2.4.1).
DEGidentifier provides differentially expressed genes between all paired groups in a given dataset and saves the retrieved information in different spreadsheets to a user defined directory. Outputs of the function are as follows: All probesets with significant differential expression between any two groups, separate up- or down-regulation lists for probesets, log-fold change of the intensities between groups. Additionally, it generates all the lists given above at the gene symbol level as well as at probe level, and creates Venn diagram and Heatmap representations for the comparisons between groups (Figure 13, Figure 14).
27
Figure 4: Detailed schematic view of routine components. Input values and output results for each function as well as used BioConductor packages are given. Additional Custom functions ChartPlotter and PlotCharts are two functions modified from equivalent functions of package GeneAnswers (Feng et al., 2001). Those modifications were necessary for us to ensure streamline flow of the routine.
28
3.6. Functional Annotation and Analysis of Differentially Expressed Genes
The third module of the R-routine, FuncAnn, performs functional annotation for differentially expressed genes in terms of Gene Ontology and KEGG (Kyoto
Encyclopedia of Genes and Genomes) Pathways (Figure 17-Figure 21 and Figure 24; Table 6-Table 9). FuncAnn is composed of four different functions, KG_HyperG, GO_HyperG, KEGGscript and Grapher, written by us and two functions, ChartPlotter and
PlotCharts, modified from the GeneAnswers package of BioConductor (Feng et al., 2001). This module makes use of following BioConductor packages: KEGG.db (Carlson et al.), KEGGgraph (Zhang and Wiemann, 2009), GeneAnswers (Feng et al., 2001) and RGraphviz (Gentry et al.).
KG_HyperG provides the results of hypergeometric testing of KEGG pathways in which the DEGs are involved. GO_HyperG function performs hypergeometric testing of GO terms for overrepresentation or underrepresentation of GO terms in a given significant probe list, independent of the chip platform as long as it is an Affymetrix human chip, in a given universal set of probe ids (default is all the probes defined on the chip).
KEGGscript function generates outputs of detailed KEGG analyses of the results, separately for each contrast, where the name of the pathway, the coverage percentage of the pathway, the names of genes differentially expressed in that pathway and whether those genes are up-regulated or down-regulated are provided as output, by making use of KEGGgraph package of BioConductor. A table with the same information also is generated and saved to the working directory in spreadsheet format. Furthermore, we included graphical results for gene annotation within KEGGscript function. Top GO
29
processes and top KEGG pathways, to which the data are related, are provided as piechart and barplot, with the help of GeneAnswers package. Finally, Grapher function generates graphical results for KEGG pathways with directed edges and color code for up-regulation and down-regulation using KEGGgraph package of
BioConductor.
All the output of this module also is automatically saved into the working directory in easily readable plain text formats, spreadsheet formats or as images; all automatically denominated in accordance with the contrast groups (e.g.,.
30
4. RESULTS
4.1. Quality Control Assessment of Hybridization and Preprocessing of
Microarray Data
The QualCont program was applied to 6 microarray .CEL files that belong to 3 groups, nicotine, levamisole, and control. Each group contained 2 samples.
QualCont (FilesPath,NormType,pdfile)
Here FilesPath is the directory where .CEL files and experiment descriptor file (pdfile) are located. Since the function was designed as to read all available .CEL files in the given directory, it is important to create a separate folder for separate analyses.
Furthermore, the directory given here is set as the working directory of the session, all the results are saved here from the beginning till the very end of the analysis. NormType is the normalization type (RMA, gcRMA or MAS5; all with lower letters) selected; and herein “rma” (Robust Multi-array Analysis) (Irizarry et al., 2003) was chosen as the normalization method. Pdfile is a descriptive text file explaining the experimental groups.
Quality control analyses showed that there was no physical defect the on hybridized chips, like smears, (Figure 5) and all samples had similar RNA degradation slopes (Figure 10), indicating that all the arrays were of adequate quality to be included in future analyses (Table 3).
Histograms (Figure 6, Figure 7), boxplots (Figure 8) and MA plots (Figure 9) of raw and normalized data were provided for comparison. Histograms demonstrated the signal
31
intensity distribution for the arrays. Post-normalization the distributions were more similar to normal distribution yet with a heavier right tail (Figure 7). Here we provide histograms, however Q-Q plots can also be very informative to see whether the signal intensity has normal distribution or not (R_Development_Core_Team, 2010). We should note here that for t-test assumptions, meeting of normality in distribution of signal intensities of “most probesets” across experiments is more important than satisfying normality of distribution of a single array, since we apply testing “between” arrays rather than “in” an array. Nevertheless, we found it useful to provide
in-array-distributions of signal intensities to get an idea about how general overview of signal distributions are seen in arrays. Additionally, it would be beneficial to keep in mind that with very low numbers of arrays (e.g. 6 in our data) it would not be easily possible to prove normality, since data with low sample size generally deviate from normal distribution. Thus use of tests such as limma are better suited for small sample size comparisons. Histogram representations were generated, denominated and saved automatically by the routine and hist function was used in the code.
Another quality control measure is provided with the MA (MvA; M versus A) plots where one can get a quick overview of the intensity-dependent ratios of arrays.
The basic assumption of microarray theory is that most of the genes do not show differential expression between the groups. For testing whether this assumption applies to a data we look for the ratios of signal intensities in arrays as pairs. According to the aforementioned rule, we expect to have mean of intensity ratios between arrays as 1 (0, when logged; log(1)=0). In a paired MA plot, this rule is visually checked as a quality control on the grounds that if there is much difference between two arrays, in other
32
words if the intensity ratio between arrays do not approximate to 1, that means the most of the genes in one of them shows differential expression. Such a result implies that the given array should be excluded from the analysis because it exerts a bias on the
normalization procedure, which in turn leads to a bias in the statistical analytic steps.
Therefore, in the streamline routine we included generation of MA plots of both raw and normalized data and we made use of mva.pairs function of affyPLM package of BioConductor.
33
Figure 5: Photographs of array chips. Images were created with the help of image function of the graphics package (R_Development_Core_Team, 2010).
34
Figure 6: Frequencies of signal intensities along arrays. The plot shows the distribution of the signal intensity before normalization. Images were created with the help of hist function of the graphics package (R_Development_Core_Team, 2010).
35
.
Figure 7: Frequencies of signal intensities along the arrays after normalization. The plot demonstrates the new distribution of the data following normalization. Normalization procedure simply approximates the data distribution to normal distribution on the grounds that following tests and analyses are based on the assumption that the data is distributed normally. Images were created with the help of hist function of the graphics package (R_Development_Core_Team, 2010).
36
Figure 9 shows the MA plots of both raw and normalized data indicating all arrays pass this quality control. The y-axis represents the „M‟ component, intensity-ratio; x-axis represents the „A‟ component, average ratio for a dot in the plot.
Figure 9 :MA Plots of arrays before and after normalization (from left to right). M (y-axis) is the intensity ratio; A (x-axis) is the average intensity for a dot in the plot. MA plot provides a quick overview of intensity-dependent ratio. Images were created with the help of mva.pairs function of the affy package (Gautier et al., 2004).
Figure 8: Box plot representation of data of each array before and after normalization. Represents intensity value distribution of arrays. To be analyzed together, all arrays should meet a very close mean value making the content comparable for differential expression analysis. y-axis shows signal intensity values (RMA normalization gives logged values of signal intensities). Images were created with the help of boxplot function of the graphics package (R_Development_Core_Team, 2010).