i
MERGERS AND ACQUISITIONS DURING FINANCIAL CRISES
A Ph.D. Dissertation
by
IŞIL SEVİLAY YILMAZ
Department of Management
İhsan Doğramacı Bilkent University
Ankara
September 2016
iii
iv
MERGERS AND ACQUISITIONS DURING FINANCIAL CRISES
The Graduate School of Economics and Social Sciences of
İhsan Doğramacı Bilkent University by
IŞIL SEVİLAY YILMAZ
In Partial Fulfillment of the Requirements for the Degree of DOCTOR OF PHILOSOPHY
in
THE DEPARTMENT OF MANAGEMENT
İHSAN DOĞRAMACI BİLKENT UNIVERSITY ANKARA
iii ABSTRACT
MERGERS AND ACQUISITIONS DURING FINANCIAL CRISES Yılmaz, Işıl Sevilay
Department of Management
Supervisor: Assist. Prof. Ayşe Başak Tanyeri
September 2016
This thesis investigates the effects of financial crises on mergers and acquisitions (M&A) activity. We investigate if M&A deals in crisis periods differ in terms of dollar volume and quantity of deals, target and bidder characteristics, cumulative abnormal returns (CAR) and deal premiums.
First, we describe global M&A activity across 47 countries over the period 1992 to 2011. We investigate how value is generated and distributed in M&A deals around the world. We find that M&A activity (particularly in deals where control rights are sold) generates value. We also find that the magnitudes of bidder and target CARs in developed countries are higher than those in emerging-market countries.
Second, we identify effects of financial crises based on a sample of 39 countries. We conclude that financial crisis in target country affects the value generated in M&A
iv
deals and how the generated value is distributed between target and bidder shareholders. Moreover, a typical crisis affects the value generated and the
distribution of value differently in developed and emerging countries. In particular, crisis time M&A deals generate more value if the target is from a developed country.
Finally, financial crises may affect the type of deals that are undertaken and/or affect the pricing of deals. We investigate if differences in deal characteristics account for differences in the value generated and distributed. We conclude that targets operating in countries, which experience crisis, enjoy higher CARs in the full sample even after accounting for the differences in deal specifics.
v ÖZET ………
FİNANSAL KRİZ DÖNEMLERİNDE ŞİRKET BİRLEŞME VE SATIN ALMALARI
Yılmaz, Işıl Sevilay Doktora, İşletme Bölümü
Tez Yöneticisi: Yrd. Doç. Dr. Ayşe Başak Tanyeri
Eylül 2016
Bu tez finansal krizlerin şirket birleşme ve satın alma aktivitesi üzerindeki etkisini araştırmaktadır. Kriz dönemlerinde gerçekleşen şirket birleşme ve satın almalarının kriz olmayan dönemlerde gerçekleşen işlemlerden işlem hacmi, işlem sayısı, hedef şirket ve alıcı (talip) şirket özellikleri, hedef şirket ve talip şirket hissedarları
tarafından elde edilen kümülatif anormal getiri ve talip şirket tarafından ödenen prim açısından farklı olup olmadığı araştırılmıştır.
Öncelikle küresel şirket birleşme ve satın alma aktivitesi 47 ülkenin 1992-2011 dönemindeki işlemleri ile araştırılmıştır. Bulgularımız şirket birleşme ve satın alma işlemlerinin (özellikle kontrol haklarının el değiştirdiği durumlarda) değer yaratan işlemler olduğunu göstermektedir. Ayrıca gelişmiş ülkelerde talip ve hedef şirket kümülatif anormal getiri miktarlarının gelişmekte olan piyasa ülkelerine oranla daha yüksek olduğu bulunmuştur.
vi
İkinci olarak, kriz dönemlerinin şirket birleşme ve satın alma işlemleri üzerindeki etkisinin araştırılması için 39 ülkedeki işlemler kullanılmıştır. Hedef firma ülkesinde kriz olması durumunun şirket birleşme ve satın alma aktivitesi ile yaratılan değeri ve yaratılan değerin talip ve hedef şirket hissedarları arasında paylaşımını anlamlı ölçüde etkilediği sonucuna varılmıştır. Ayrıca hedef ülkenin gelişmiş ya da gelişmekte olan ülke olması durumunda finansal kriz etkilerinin farklı olduğu gösterilmiştir. Kriz dönemi işlemleri hedef şirketin gelişmiş ülke olması durumunda daha yüksek değer yaratmaktadır.
Son olarak, finansal krizler gerçekleşen işlemlerin türünü ve/veya fiyatlanmasını etkileyebilir. Kriz zamanı işlemlerindeki farkların yaratılan ve dağıtılan değer için rapor edilen farklılıkları açıklamakta yeterli olup olmadığı araştırılmıştır. Hedef firma ülkesinde kriz olması durumunun kriz zamanı işlemlerindeki farklar göz önüne alındıktan sonra bile yaratılan değeri ve yaratılan değerin talip ve hedef şirket hissedarları arasında paylaşımını anlamlı ölçüde etkilediği sonucuna varılmıştır.
Anahtar Kelimeler: Finansal Kriz, Kısmi Satışlar, Olay Çalışması, Şirket Birleşme ve Satın Almaları
vii
ACKNOWLEDGMENTS
I would like to express my sincere appreciation to my supervisor Assist. Prof. Dr. Başak Tanyeri for her valuable guidance and inspiration. I am deeply indebted to her for stimulating suggestions and encouragement. Her deep knowledge in finance and outstanding talent in asking the most fundamental and challenging questions contributed a lot to this study. I am grateful for the time and effort she has devoted to this study. Sincere thanks are also extended to the other members of the examining committee, Prof. Dr. Kürşat Aydoğan and Assoc. Prof. Dr. Taner Yiğit, for their helpful suggestions and the encouragement they have provided. I am also thankful to Prof. Dr. Doğan Tırtıroğlu, Assist. Prof. Dr. Engin Küçükkaya and Assoc. Prof. Dr. Aslıhan Salih for their valuable contributions to the final version of the study.
I would also like to thank The Scientific and Technological Research Council of Turkey (TUBITAK) for the scholarship they provided during my graduate study.
I am also thankful to other graduate students in the department for the friendly atmosphere they have provided. Special thanks are extended to my office mates Naime Geredeli Usul, Burze Yaşar and İdil Ayberk for sharing with me all the
viii
faculty staff, especially Rabia Hırlakoğlu and Remin Tantoğlu for their help and constant support.
Last but not least, I would also like to thank my parents Şerafettin and Mukadder Yılmaz, my sister Işın Tülay Yılmaz, my brother Mehmet Yılmaz, my brother in-law Levent Ertürk and sister in-law Özlem Çelik Yılmaz for their
unconditional love and encouragement throughout this study. My beloved father has always been there for me during the ups and the downs of thesis writing experience. I wish he could have seen the completion of this thesis.
ix TABLE OF CONTENTS ABSTRACT ... iii ÖZET ……… ... v ACKNOWLEDGMENTS ... vii TABLE OF CONTENTS ... ix
LIST OF TABLES ... xiii
LIST OF FIGURES ... xx
CHAPTER 1 : INTRODUCTION AND MOTIVATION OF THE STUDY ... 1
1.1 Summary of Findings ... 6
1.2 Organization of this study ... 8
CHAPTER 2 : LITERATURE REVIEW AND CONTRIBUTIONS OF THIS STUDY ... 10
2.1 Literature Review on Merger Motives ... 11
2.1.1 Value Generation (Synergy) ... 11
2.1.2 Market Misvaluation (Mispricing) ... 19
2.1.3 Agency Conflicts ... 20
2.1.4 Behavioral Models ... 21
2.1.5 Mixed Studies ... 21
2.2 Literature Review on Financial Crisis... 23
2.3 Financial Crisis and M&A Activity ... 27
x
2.3.2 M&A and Recent 2007 U.S. Sub-prime mortgage crisis ... 32
2.3.3 Dynamic Models of M&A Crisis Relationship ... 33
2.4 Literature Review on Cross Border Mergers ... 33
2.5 Contribution of This Study ... 37
CHAPTER 3 : HYPOTHESES ON FINANCIAL CRISES AND MERGER MOTIVES ... 39
3.1 Volume of Mergers in Financial Crises ... 39
3.2 Distribution of Value between Target and Bidder Shareholders during Financial Crises ... 41
3.2.1 Merger Premium during Financial Crises ... 41
3.2.2 Target and Bidder CARs During Financial Crises ... 42
3.3 Value Generation in M&A Deals During Financial Crises ... 43
CHAPTER 4 : SAMPLING FRAME ... 45
4.1 Sampling of the M&A Activity... 45
4.2 Sample Restrictions Arising from the Availability of Share Prices ... 48
4.3 Identifying Crisis across Countries ... 51
4.4. Sample Restrictions Arising from the Availability of Merger Premiums . 52 4.5 Country, Firm and Deal Level Variables ... 56
CHAPTER 5 : DESCRIBING GLOBAL M&A ACTIVITY THROUGH TIME AND ACROSS COUNTRIES ... 59
5.1 Distribution of M&A Value: Bidder and Target Cumulative Abnormal Returns (CAR) ... 65
5.2 Cross-country Differences in Bidder and Target CARs ... 70
CHAPTER 6 : HOW DOES CRISIS AFFECT M&A VOLUME? ... 78
6.1 Univariate Analysis for Volume Effects by Target Nation ... 79
xi
CHAPTER 7 : HOW DOES CRISIS AFFECT THE DISTRIBUTION OF VALUE
BETWEEN BIDDER AND TARGET SHAREHOLDERS? ... 92
7.1 Measuring Distribution of Value between Bidder and Target Shareholders Using Premiums ... 92
7.1.1 Univariate Analysis for Merger Premium ... 92
7.1.2 Multivariate Analysis for Merger Premium ... 102
7.2 Measuring Distribution of Value between Bidder and Target Shareholders Using CARs ... 118
7.2.1 Univariate Analysis for Target and Bidder Cumulative Abnormal Returns (CARs) ... 118
7.2.2 Multivariate Analysis for Target and Bidder Cumulative Abnormal Returns (CARs) ... 127
CHAPTER 8 : HOW DOES CRISIS AFFECT THE VALUE GENERATED IN M&A ACTIVITY? ... 151
8.1 Univariate Analysis for Combined Cumulative Abnormal Returns (CARs) ... 152
8.2 Multivariate Analysis for Combined Cumulative Abnormal Returns (CARs) ... 161
CHAPTER 9 : EXPLAINING DIFFERENCES IN M&A DEALS -CRISIS VS. NON-CRISIS- ... 171
9.1 Analysis of Differences in Deal Size ... 172
9.2 Analysis of Differences in Relative Size ... 174
9.3 Analysis of Differences in Bidder Size ... 175
9.4 Analysis of Differences in Target Size ... 176
9.5 Analysis of Differences in Deal Type (Acquisition vs. partial sale) ... 177
9.6 Analysis of Differences in Payment Method (All Cash vs. Not-all cash) 177 9.7 Analysis of Differences in Competition (Competitive vs. Not-competitive) ... 178
9.8 Analysis of Differences in Industry (Focusing vs. Diversifying) ... 179
9.9 Analysis of Differences in Geographical Scope (Cross-Border vs. Domestic) ... 179
xii
9.10 Analysis of Differences in Bidder and Target Legal Status (Public vs.
Private) ... 180
9.11 Analysis of Differences in Deal Status (Successfully Completed or Not) ... 181
9.12 Analysis of Differences in Deal Attitude (Hostile or Not) ... 181
CHAPTER 10 : ROBUSTNESS TESTS ... 215
10.1 Robustness for Merger Volume ... 215
10.1.1 First Alternative Merger Intensity Measure for Volume ... 215
10.1.2 Second Alternative Merger Intensity Measure for Volume ... 217
10.2 Robustness for Merger Premiums ... 219
10.3 Robustness for Cumulative Abnormal Returns... 220
CHAPTER 11 : CONCLUSION AND DISCUSSION ... 222
APPENDICES ... 226
Appendix 1: Laeven and Valencia Crises Database ... 226
Appendix 2: Laeven and Valencia Banking Crisis Start and End Dates ... 230
Appendix 3: Variable List ... 235
Appendix 4: Robustness for Volume ... 244
A4_a. Robustness for Volume (Alternative 1-percentage share) ... 244
A4_b. Robustness for Volume (Alternative 2-Cross-border) ... 252
Appendix 5: Robustness for Merger Premium... 260
Appendix 6: Regression results for 1-day and 1-week premiums ... 273
xiii
LIST OF TABLES
1. M&A Literature on Value Creation (3-Day CARs) ... 15
2. Findings of Literature on Crisis and M&A Relationship ... 31
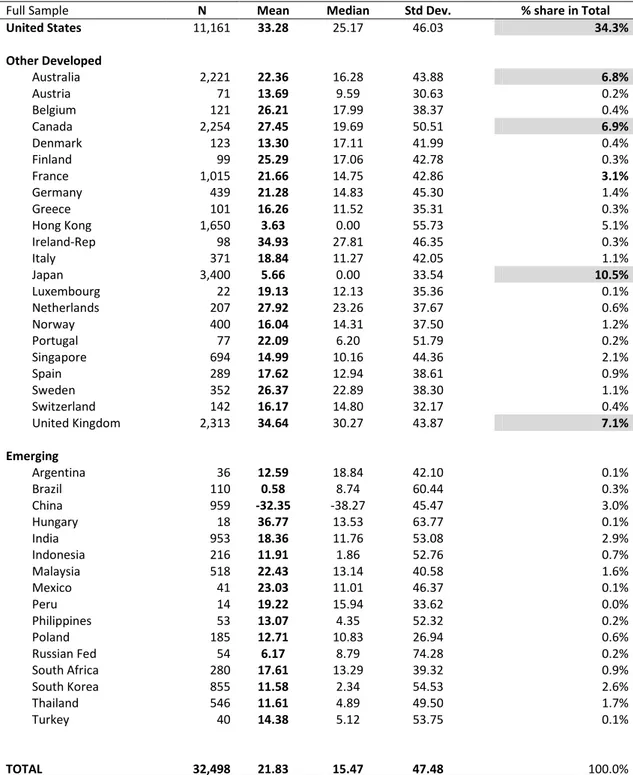
3. Describing the Sample of M&As: 1992-2011 ... 47
4. Number of Crisis Identified during 1992-2011 ... 53
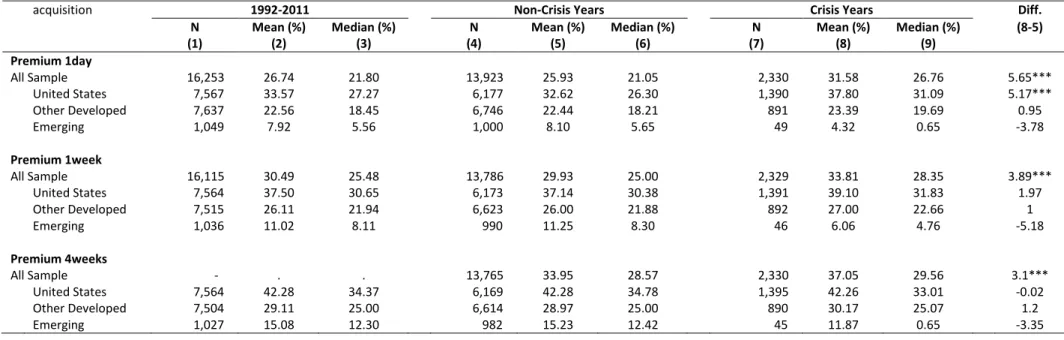
5. 4-week Premiums by Target Nation ... 55
6. Description of Variables ... 57
7. Volume of Deals over time by Target Nation (Quantity and Dollar Value)... 63
8. 3-day Bidder and Target CARs ... 67
9. 3-day Bidder, Target and Combined CARs ... 69
10. Merger Intensity across Crisis versus Non-crisis Years ... 81
11. Common Population Tests for Volume ... 82
12. Merger Intensity in Crisis versus Non-crisis (TARGET OR BIDDER) ... 86
13. Merger Intensity Defined as Quantity Regressions (TARGET) ... 87
14. Merger Intensity Defined as Quantity Regressions (BIDDER) ... 88
15. Merger Intensity Defined as Dollar Volume Regressions (TARGET OR BIDDER) ... 89
16 Merger Intensity Defined as Dollar Volume Regressions (TARGET) ... 90
17. Merger Intensity Defined as Dollar Volume Regressions (BIDDER) ... 91
18. Univariate Tests for Merger Premiums (Crisis vs. Non-crisis)-FULL SAMPLE 95 19. Univariate Tests for Merger Premiums (Crisis vs. Non-crisis)-DOMESTIC M&A ... 96
20. Univariate Tests for Merger Premiums (Crisis vs. Non-crisis)-CROSS BORDER M&A ... 97
21. Univariate Tests for Merger Premiums (Crisis vs. Non-crisis)-ACQUISITIONS (CONTROL CHANGING) ... 98
xiv
22. Univariate Tests for Merger Premiums (Crisis vs. Non-crisis)-COMPLETED .. 99
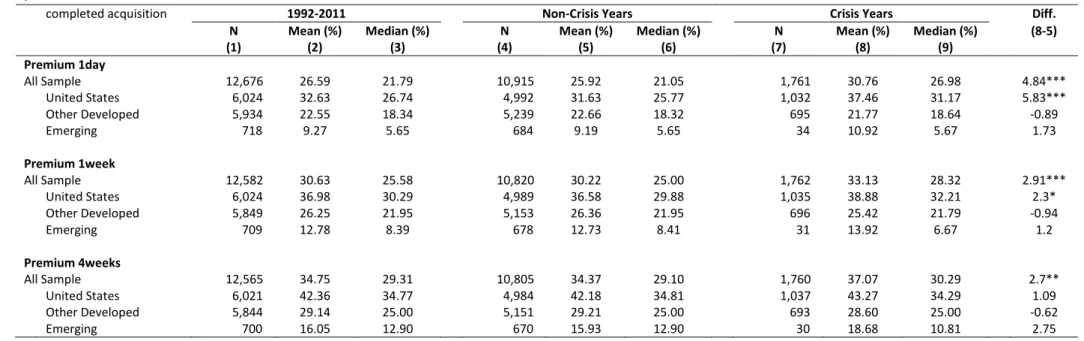
23. Univariate Tests for Merger Premiums (Crisis vs. Non-crisis) - COMPLETED ACQUISITIONS ... 100
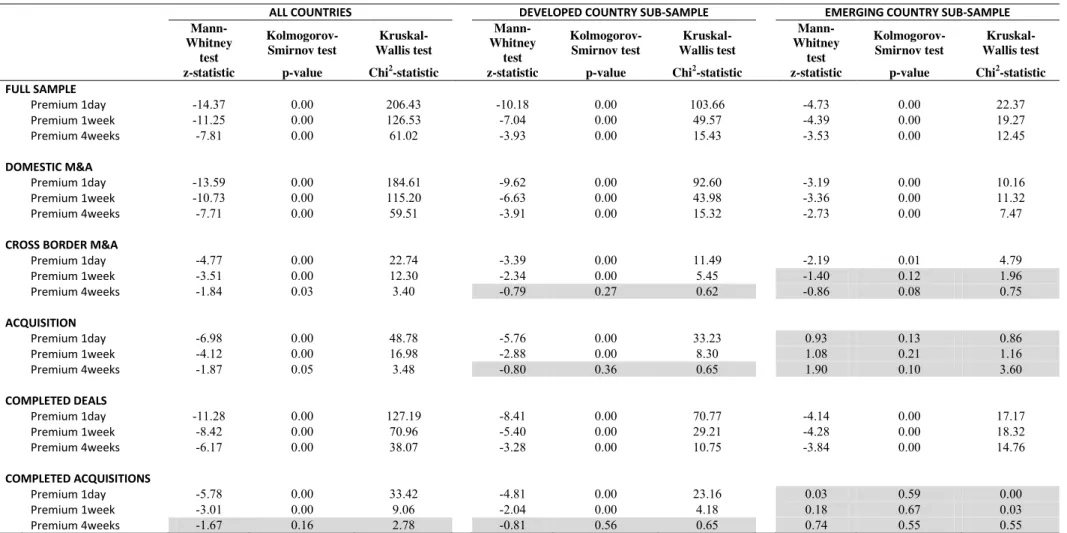
24. Common Population Tests for Merger Premiums ... 101
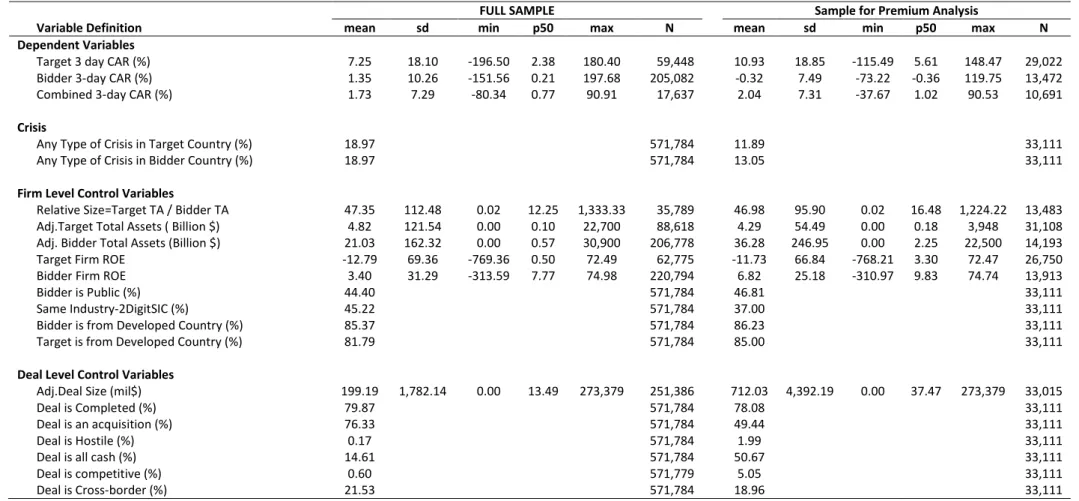
25. Comparative Summary of Variables Used in Premium Analysis (when premium is non-missing) ... 110
26. 4-weeks Premium Regressions (FULL SAMPLE) ... 111
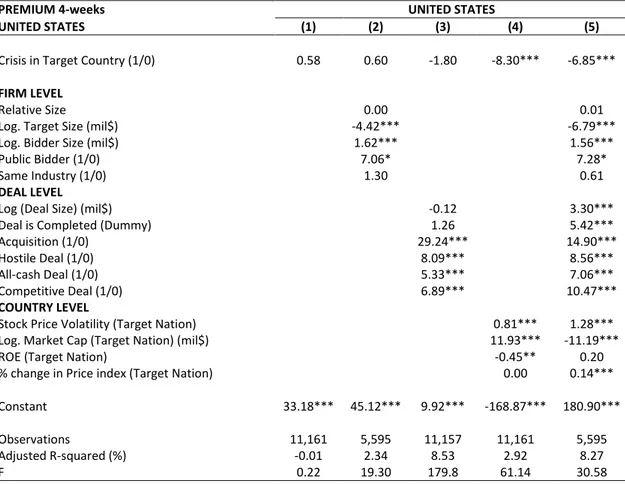
27. 4-weeks Premium Regressions (UNITED STATES) ... 112
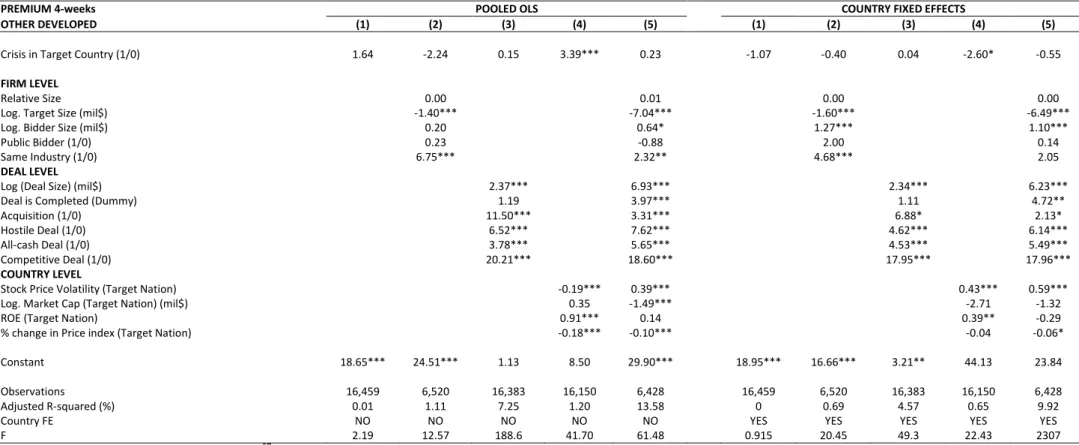
28. 4-weeks Premium Regressions (OTHER DEVELOPED) ... 113
29. 4-weeks Premium Regressions (EMERGING) ... 114
30. 4-weeks Premium Regressions (DOMESTIC) ... 115
31. 4-weeks Premium Regressions (CROSS-BORDER) ... 116
32. Summary of Findings on Premium (4weeks) Regressions ... 117
33. Univariate Tests for Bidder and Target Cumulative Abnormal Returns (Crisis vs. Non-crisis)-FULL SAMPLE ... 120
34. Univariate Tests for Bidder and Target Cumulative Abnormal Returns (Crisis vs. Non-crisis)-DOMESTIC M&A ... 121
35. Univariate Tests for Bidder and Target Cumulative Abnormal Returns (Crisis vs. Non-crisis)-CROSS BORDER M&A ... 122
36. Univariate Tests for Bidder and Target Cumulative Abnormal Returns (Crisis vs. Non-crisis)-ACQUISITION... 123
37. Univariate Tests for Bidder and Target Cumulative Abnormal Returns (Crisis vs. Non-crisis)-COMPLETED ... 124
38. Univariate Tests for Bidder and Target Cumulative Abnormal Returns (Crisis vs. Non-crisis) - COMPLETED ACQUISITION ... 125
39: Common Population Tests for Bidder and Target Cumulative Abnormal Returns ... 126
40. Comparative Summary of Variables Used in CAR Analysis (when at least one of target or bidder car is non-missing) ... 136
41. 3-day Target CAR Regressions (Full Sample) ... 137
42. 3-day Target CAR Regressions (United States) ... 138
43. 3-day Target CAR Regressions (Other Developed) ... 139
44. 3-day Target CAR Regressions (Emerging) ... 140
xv
46. 3-day Target CAR Regressions (Cross-Border) ... 142
47. 3-day Bidder CAR Regressions (Full Sample) ... 143
48. 3-day Bidder CAR Regressions (Target Nation is United States) ... 144
49. 3-day Bidder CAR Regressions (Target Nation is a Developed Country-other than US-) ... 145
50. 3-day Bidder CAR Regressions (Target Nation is an Emerging Country) ... 146
51. 3-day Bidder CAR Regressions (Domestic) ... 147
52. 3-day Bidder CAR Regressions (Cross-Border) ... 148
53. Summary of Findings on Target CAR Regressions ... 149
54. Summary of Findings on Bidder CAR Regressions ... 150
55. Univariate Tests for Combined Cumulative Abnormal Returns (Crisis vs. Non-crisis)-FULL SAMPLE ... 154
56. Univariate Tests for Combined Cumulative Abnormal Returns (Crisis vs. Non-crisis)-DOMESTIC M&A ... 155
57. Univariate Tests for Combined Cumulative Abnormal Returns (Crisis vs. Non-crisis)-CROSS BORDER M&A ... 156
58. Univariate Tests for Combined Cumulative Abnormal Returns (Crisis vs. Non-crisis)-ACQUISITION ... 157
59. Univariate Tests for Combined Cumulative Abnormal Returns (Crisis vs. Non-crisis)-COMPLETED ... 158
60. Univariate Tests for Combined Cumulative Abnormal Returns (Crisis vs. Non-crisis) - COMPLETED ACQUISITION ... 159
61. Common Population Tests for Combined Cumulative Abnormal Returns ... 160
62. 3-day Combined CAR Regressions (Full Sample) ... 164
63. 3-day Combined CAR Regressions (United States) ... 165
64. 3-day Combined CAR Regressions (Other Developed) ... 166
65. 3-day Combined CAR Regressions (Emerging) ... 167
66. 3-day Combined CAR Regressions (Domestic) ... 168
67. 3-day Combined CAR Regressions (Cross-Border) ... 169
68. Summary of Findings on Combined CAR Regressions ... 170
69. Summary Table for CARs and Premiums ... 182
70. Summary Table for Crisis vs. Non-crisis Deal Specifics ... 183
71. Summary of Dependent and Control Variables (BOTH DOMESTIC AND CROSS-BORDER DEALS) ... 184
xvi
72. Summary of Dependent and Control Variables (ONLY DOMESTIC DEALS)
... 186
73. Summary of Dependent and Control Variables (ONLY CROSS-BORDER DEALS) ... 188
74. Distribution of Deal Size (mil. $) in US, Other Developed Countries and Emerging Countries ... 190
75. Distribution of Deal Size (mil. $) - UNITED STATES ... 191
76. Distribution of Deal Size (mil. $) - OTHER DEVELOPED ... 192
77. Distribution of Deal Size (mil. $) - EMERGING ... 193
78. Distribution of Relative Size in US, Other Developed Countries and Emerging Countries ... 194
79. Distribution of Relative Size- UNITED STATES ... 195
80. Distribution of Relative Size - OTHER DEVELOPED ... 196
81. Distribution of Relative Size – EMERGING ... 197
82. Distribution of Adjusted Bidder Size in US, Other Developed Countries and Emerging Countries ... 198
83. Distribution of Adjusted Bidder Size- UNITED STATES ... 199
84. Distribution of Adjusted Bidder Size - OTHER DEVELOPED ... 200
85. Distribution of Adjusted Bidder Size – EMERGING ... 201
86. Distribution of Adjusted Target Size in US, Other Developed Countries and Emerging Countries ... 202
87. Distribution of Adjusted Target Size- UNITED STATES ... 203
88. Distribution of Adjusted Target Size - OTHER DEVELOPED ... 204
89. Distribution of Adjusted Target Size – EMERGING ... 205
90. Distribution of Deal Type (Acquisition vs. partial sale) - UNITED STATES, DEVELOPED, EMERGING ... 206
91. Distribution of Payment Method (All Cash vs. Not-all cash) - UNITED STATES, DEVELOPED, EMERGING ... 207
92. Distribution of Competition (Competitive vs. Not-competitive) - US, DEVELOPED, EMERGING ... 208
93. Distribution of Industry (Focusing vs. Diversifying) - UNITED STATES, OTHER DEVELOPED, EMERGING ... 209
94. Distribution of Geographical Scope (Cross-Border vs. Domestic) - US, OTHER DEVELOPED, EMERGING ... 210
xvii
95. Distribution of Bidder Legal Status (Public vs. Private) – UNITED STATES,
OTHER DEVELOPED, EMERGING ... 211
96. Distribution of Target Legal Status (Public vs. Private) - UNITED STATES, OTHER DEVELOPED, EMERGING ... 212
97. Distribution of Deal Status (Successfully Completed or Not) - UNITED STATES, OTHER DEVELOPED, EMERGING ... 213
98. Distribution of Deal Attitude (Hostile or Not) - UNITED STATES, OTHER DEVELOPED, EMERGING ... 214
99. Robustness When Different Filters Are Used to Detect Outliers in Returns ... 221
100. Laeven and Valencia Crises Database ... 226
101. Laeven and Valencia Banking Crisis Start and End Dates ... 230
102. Financial Crises Dummies created in SDC Data using Laeven Valencia... 232
103. MERGER INTENSITY MEASURES FOR VOLUME (QUANTITY and DOLLAR VALUE) ... 235
104. COUNTRY LEVEL VARIABLES ... 237
105. FIRM LEVEL VARIABLES ... 239
106. DEAL LEVEL VARIABLES ... 240
107. ROBUSTNESS-Merger Intensity across crisis versus non-crisis years ... 244
108. ROBUSTNESS-Common Population Tests For Volume ... 245
109. ROBUSTNESS-Merger Intensity Defined as Quantity Regressions (TARGET OR BIDDER) ... 246
110. ROBUSTNESS-Merger Intensity Defined as Quantity Regressions (TARGET) ... 247
111. ROBUSTNESS--Merger Intensity Defined as Quantity Regressions (BIDDER) ... 248
112. ROBUSTNESS-Merger Intensity Defined as Dollar Volume Regressions (TARGET OR BIDDER) ... 249
113. ROBUSTNESS-Merger Intensity Defined as Dollar Volume Regressions (TARGET) ... 250
114. ROBUSTNESS-Merger Intensity Defined as Dollar Volume Regressions (BIDDER) ... 251
115. ROBUSTNESS-Merger Intensity across crisis versus non-crisis years ... 252
xviii
117. ROBUSTNESS-Merger Intensity Defined as Quantity Regressions (TARGET
OR BIDDER) ... 254
118. ROBUSTNESS-Merger Intensity Defined as Quantity Regressions (TARGET) ... 255
119. ROBUSTNESS--Merger Intensity Defined as Quantity Regressions (BIDDER) ... 256
120. ROBUSTNESS-Merger Intensity Defined as Dollar Volume Regressions (TARGET OR BIDDER) ... 257
121. ROBUSTNESS-Merger Intensity Defined as Dollar Volume Regressions (TARGET) ... 258
122. ROBUSTNESS-Merger Intensity Defined as Dollar Volume Regressions (BIDDER) ... 259
123. Robustness for Univariate Tests of Merger Premiums (Crisis vs. Non-crisis)-FULL SAMPLE ... 260
124. Robustness for Univariate Tests of Merger Premiums (Crisis vs. Non-crisis)-DOMESTIC ... 261
125. Robustness for Univariate Tests of Merger Premiums (Crisis vs. Non-crisis)-CROSS BORDER ... 262
126. Robustness for Univariate Tests of Merger Premiums (Crisis vs. Non-crisis)-COMPLETED ... 263
127. Robustness for Univariate Tests of Merger Premiums (Crisis vs. Non-crisis)-ACQUISITION ... 264
128. Robustness for Univariate Tests of Merger Premiums (Crisis vs. Non-crisis)-COMPLETED ACQUISITION ... 265
129. Robustness for Common Population Tests of Merger Premiums ... 266
130. Robustness for 4-weeks Premium Regressions (FULL SAMPLE) ... 267
131. Robustness for 4-weeks Premium Regressions (UNITED STATES) ... 268
132. Robustness for 4-weeks Premium Regressions (OTHER DEVELOPED) ... 269
133. Robustness for 4-weeks Premium Regressions (EMERGING) ... 270
134. Robustness for 4-weeks Premium Regressions (DOMESTIC) ... 271
135. Robustness for 4-weeks Premium Regressions (CROSS BORDER) ... 272
136. 1-week Premium Regressions (FULL SAMPLE) ... 273
137. 1-week Premium Regressions (UNITED STATES) ... 274
xix
139. 1-week Premium Regressions (EMERGING) ... 276 140. 1-week Premium Regressions (DOMESTIC) ... 277 141. 1-week Premium Regressions (CROSS-BORDER) ... 278 142. 1-day Premium Regressions (FULL SAMPLE) ... 279 143. 1-day Premium Regressions (UNITED STATES) ... 280 144. 1-day Premium Regressions (OTHER DEVELOPED) ... 281 145. 1-day Premium Regressions (EMERGING) ... 282 146. 1-day Premium Regressions (DOMESTIC) ... 283 147. 1-day Premium Regressions (CROSS-BORDER) ... 284
xx
LIST OF FIGURES
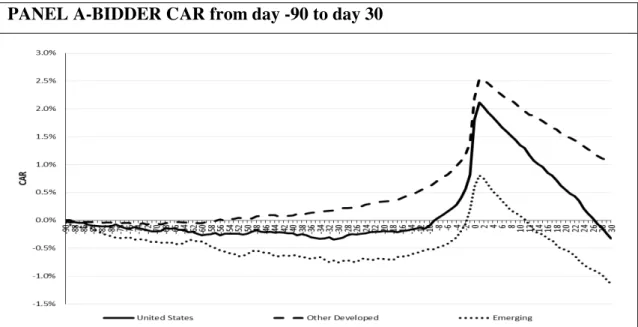
1. Distribution of Crises over Time ... 53 2. Volume of Deals over time by Target Nation (Quantity and Dollar value) ... 62 3. Event Study Timeline. ... 65 4. 3-day CARs for Acquisitions by Country (1992-2011) ... 71 5. Bidder and Target Cumulative Abnormal Returns (CAR) in the 121 (-90, 30)
1
CHAPTER 1
:
INTRODUCTION AND MOTIVATION OF THE STUDY
This study investigates the effects of financial crises on mergers and acquisitions (M&A) activity. We investigate if M&A deals in crisis periods differ in terms of volume (both quantity and dollar volume) of deals, target and bidder characteristics, cumulative abnormal returns (henceforth CAR) and deal premiums. We study deals across 39 countries over the period from 1992 to 2011. A review of the M&A literature shows that the effect of crises on global M&A activity is distinctly
understudied compared to the enormous literature on M&As. The existing studies are time and country/region specific and do not present a big picture view of M&A behavior during financial crises. A group of studies focus on 1997-1998 Asian Crisis (Acharya, Shin, & Yorulmazer, 2011; Aguiar & Gopinath, 2005; Shen & Lin, 2011). Some other researchers focus on 2007 U.S. Sub-prime mortgage crisis (Cernat-Gruici, Constantin, & Iamandi, 2010; Ravichandran, 2009). Moreover, studies on M&A activity during 2007 U.S. sub-prime mortgage crisis are descriptive in nature.
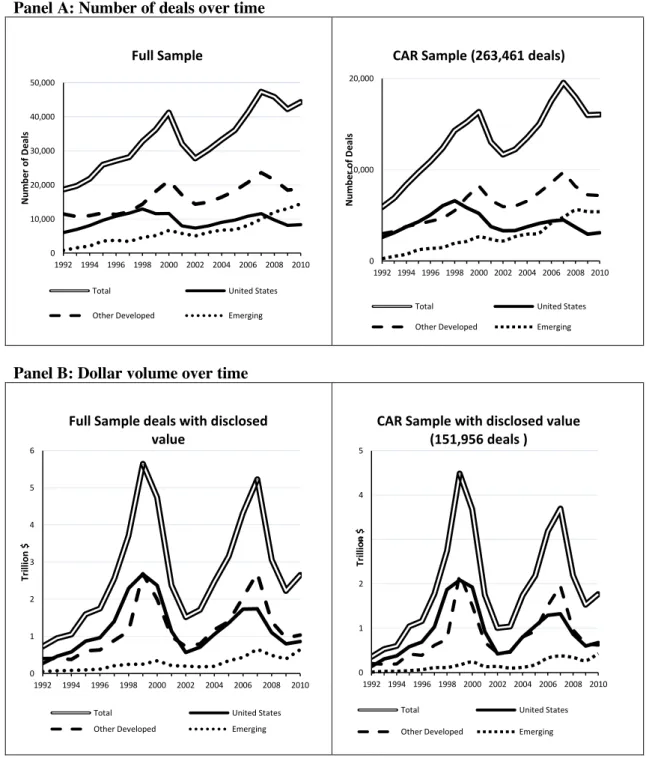
When we analyze global M&A activity over the period from 1992 to 2011 we identify two spikes, one prior to the downturn in the technology sector in 2000 and one prior
2
to the onset of the sub-prime mortgage crisis in 2007. Both quantity and dollar value of M&As peak before 2000 and 2007 stock market crashes and rebounds only after the overall economy recovers1. This pattern in total volume is the result of dominance of developed nations in M&A market. Approximately 80 percent of targets and bidders are from developed countries (including United States) over the 1992 to 2011 period. We observe 24, 13, 11 and 15 percent decline in years 2001, 2002, 2008 and 2009, respectively in the number of deals in which a developed country is target. However, we do not observe this cyclicality especially for 2007 global downturn for the subsample of emerging countries. In 2001 and 2002, the number of deals with targets from an emerging country decreases by 14 and 12 percent, respectively. However, we observe an increase of 20 and 8 percent in years 2008 and 2009, respectively. Overall, we observe an increasing trend in both quantity and dollar volume in emerging market M&A deals. Through time, the share of developed market countries in total M&A volume is diminishing while that of emerging market
countries is increasing. This difference between developed market and emerging market country subsamples regarding M&A activity during financial crisis motivates us to study the effects of financial crisis in a global sample.
The change in M&A activity during financial crises might reflect financial and managerial effects of crisis on both bidder and target firms. Decreasing access to financing especially for large transactions and/or increasing risk-aversion of managers during crisis times may motivate the decrease in developed country M&A activity during financial crisis. Baghai, Smit and Viguerie (2008) study financial crisis
investment activity of 200 global companies and state that 60 percent of companies in
1 This pattern in global M&A activity supports merger waves as put forth by studies focusing on US
M&A activity (Andrade et al, 2001; Gort, 1969; Mitchell and Mulherin, 1996; Rhoades-Kropf et al., 2004, 2005 and Harford, 2005).
3
their sample froze their portfolio moves in downturns while 40 percent made no moves in upturns. They also argue that for many companies the decision not to invest during crisis times is not just related to restricted financial resources.
A strand of literature focuses on the financial status of target firms while investigating the effect of financial crisis on M&A activity. Krugman (2000) is the first to introduce the “Fire Sale Theory”, which states that the firms in crisis countries are credit
constrained and are forced to sell their firms below their “true” value. This theory predicts an increase in cross-border mergers where the firms from crisis-hit countries are targets and firms from non-crisis countries are acquirers during crisis times. In case of a global crisis, which affects nearly all countries worldwide, it is unlikely to see such financial transactions among countries. For example, Calderon and Didier (2009) point out that 2007 sub-prime mortgage crisis originated from the United States and then spread to both developed and emerging countries2. It is different from previous crises in the sense that the past crises showed stability regarding foreign direct investment (FDI) flows associated with an increase in M&A transactions, reflecting "fire-sale FDI3” whereas the present crisis may constrain the purchasing ability of acquiring firms. Calderon and Didier (2009) document that: “the number of cross-border M&A deals starts to fall in the first quarter of 2008 and has followed a downward trend since then, decreasing almost 70% in the last quarter of 2008 vis-à-vis the second quarter of 2007.” Similarly, Poulsen and Hufbauer (2011) state that the global drop in FDI can be attributed to the decrease in cross-border M&A deals of developed-country companies since 2007, which has led to a 67 percent decline in
2 Please see Bekaert, Harvey and Ng (2005), Masson (1998), Kaminsky and Reinhart (2000),
Rijckeghem and Weder (2001) for a detailed discussion about contagion in crisis periods and channels of contagion.
3 Krugman (2000), Aguiar and Gopinath (2005),Acharya et al.(2011), Ang and Mauck (2011), Alquist
4
cross-border M&As worldwide (despite a slight M&A rebound in 2010). Poulsen and Hufbauer (2011) underline that crisis periods are an important determinant of FDI and state that as expected FDI flows to and from developed countries have declined during the present financial crisis. The financial sector is particularly affected and many M&A transactions are cancelled, postponed, or downscaled. Since the only financial crisis period in US that corresponds to our sample period is the subprime mortgage crisis, the US findings of our study represent effects of this particular crisis on US targets.
The empirical evidence on the validity of ‘fire-sale FDI’ theory in explaining merger activity during times of financial crises is inconclusive. On one hand, Aguiar and Gopinath (2005) and Acharya et al. (2011) document large foreign purchases of East Asian firms during the 1997-1998 East Asian Financial Crisis, their findings support the idea that firms from developed countries tend to buy firms in countries where the effects of the crisis is severe and lower prices compared to fundamental values. On the other hand, Makaew (2012) argues the opposite and states that cross-border mergers come in waves that are highly correlated with business cycles and most cross-border mergers occur when both the acquirer and the target are in booming economies (even after eliminating the effects of global booms), based on M&A transactions data in emerging economies over the period 1988 to 2008. He concludes that “fire sale" mergers, in which acquirers from developed countries may take advantage of liquidity-constrained targets, can happen under a specific circumstance; however, most mergers do not follow this pattern. Thus, he advocates the theory that “firms invest in other countries to gain access to new markets and new investment opportunities and that it is better to enter the target countries when the demand is
5
strong, the productivity is high, and the business environment is good”. Alquist, Mukherjee and Tesar (2016) document that crisis time foreign acquisitions of emerging market targets are not fundamentally different from non-crisis time acquisitions in terms of their industry composition (same industry versus different industry), average size of stakes acquired, likelihood of subsequent divestiture during market recovery and probability of being resold to a domestic buyer. These findings are contrary to expectations of Fire-Sale theory.
This empirical controversy regarding the M&A activity in crisis periods and the discussions that nature of the subprime mortgage crisis differs considerably from previous ones set up the main motivation to study the M&A transactions in the
financial crisis. In our global sample, our findings do not support expectations of
fire-sale theory. The volume of merger activity (as measured by merger intensity4) does not change significantly during crises.
We also investigate if the value generated in mergers and the distribution of this value between target and bidder shareholders differs during crisis. Existing studies look at value generation during merger waves and overwhelmingly limited to mergers of US and UK firms (Alexandridis, 2012; Goel &Thakor, 2010; Martynova & Renneboog, 2011; Moeller, Schlingemann, & Stulz, 2005). Goel and Thakor (2010) show that earlier mergers in a merger wave generate higher bidder abnormal returns compared to later mergers in the sample of US deals from 1979 to 2006. Saikevicius (2014)
4 We define merger intensity (in terms of quantity and dollar value ) as a standardized measure of
volume that makes it possible to compare volume across countries. Quantity merger intensity is ratio of number of all listed firms that engage in merger activity -as targets or bidders, as targets and as bidders- to number of listed companies. Dollar volume merger intensity is the ratio of number of all listed firms that engage in merger activity -as targets or bidders, as targets and as bidders- to number of listed companies.
6
study the last takeover wave in the period from 2001 to 2009 for New Member States of European Union. He concludes that crisis time deals do not create more value than those in the pre-crisis time frame. For emerging markets, Acharya, Shin, &
Yorulmazer (2011), Aguiar & Gopinath (2005), Shen & Lin (2011) test the fire-sale theory using 1997-1998 Asian Crisis.
To the best of our knowledge, this thesis is the first in asking how M&A activity generates and distributes value around the world during financial crises. Unlike other papers that study certain periods and limited number of countries, we use a worldwide sample of firms during the period from 1992 to 2011. Moreover, we do not limit the study to returns to either target or bidder shareholders and analyze both target and
bidder abnormal returns as well as returns to hypothetically combined bidder and
target firms.
1.1 Summary of Findings
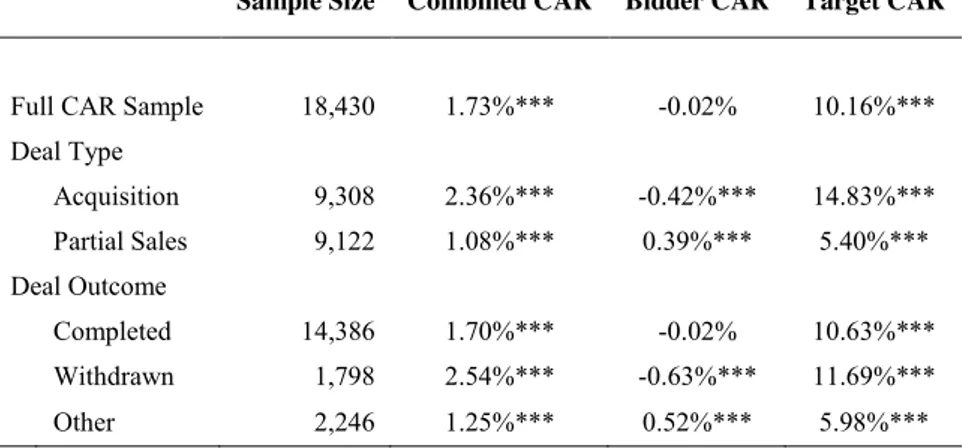
We find that the value that M&A deals generate differs in crisis and non-crisis times. We proxy for the value generated in M&A deals by analyzing the combined CAR to the hypothetically merged firm. We define combined CAR as the asset weighted 3-day CARs of bidders and targets. The combined CAR in 2,472 deals that are announced in times of financial crisis average 2.36 percent and are significantly different than the combined CAR in 15,165 deals that average 1.63 percent in normal times. Results indicate that in times of crisis M&A deals generate more value for the shareholders of the hypothetically combined firm.
7
We also show that there are significant differences in how crisis M&A deals generate value in developed versus emerging market countries. In US, the combined CARs average 2.86 percent in times of crisis and are significantly different from the 2.04 percent in normal times. In developed countries (other than US), the combined CARs average 2.37 percent in times of crisis and are significantly different than combined CARs of 1.60 percent in normal times. In emerging market countries, the combined CARs also prove higher in times of crisis relative to normal times (1.06 versus 0.95 percent). The difference, however, is insignificant.
The higher and significant combined CARs in times of crisis are driven by the higher CARs that target and bidder shareholders enjoy in times of crisis. Target CARs average 8.61 percent in times of crisis and prove significantly higher than the CARs of 7.02 percent in normal times. Bidder CARs are also higher in times of crisis (1.48 percent versus 1.33 percent) however the magnitude of difference is smaller. Results indicate that the distribution of value between target and bidder shareholders also varies between crisis and non-crisis times.
The difference in value generation and distribution of value in M&A deals in times of crisis and normal times may be due to differences in the types of deals undertaken and/or differences in the pricing of deals. First, we contrast the terms of deals undertaken in times of crisis and in normal times. We find that crisis deals are significantly larger acquisitions that are more likely to be successfully completed. Furthermore, in times of crisis, a smaller proportion of bidders and targets are public. Finally, in times of crisis 10 percent of deals are paid in cash whereas in normal times 16 percent of deals are paid in cash. We find that differences in deal terms partially
8
explain the higher magnitude of value generated in M&A deals. When we control for differences in deal terms, the difference in how M&A deals generate and distribute value in crisis versus normal times still persists.
1.2 Organization of this study
Chapter 2 provides an overview of the related M&A literature and studies about financial crises and discusses the contribution of this study to the existing literature. We contribute to the literature by: (i) showing that the existence of financial crisis in target country affects the value generated in mergers and distribution of value between target and bidder shareholders; (ii) documenting the cross-country
differences in the effects of financial crisis for developed (US and other developed countries) versus emerging market countries and; (iii) using a worldwide sample of firms during the period from 1992 to 2011.
Chapter 3 develops the main hypothesis to be tested in this study. We discuss the three theories on merger motives and their predictions on M&A activity during financial crises. We identify volume, cumulative abnormal returns and merger premiums as the main areas to investigate.
Chapter 4 describes the sample and explains the data sources used in this study. We introduce the filters applied and data restrictions imposed by different databases. Chapter 5 presents an overview of global M&A activity from 1992 to 2011. We also investigate cross-country differences in cumulative abnormal returns (CARs) to bidder and target firms.
9
Chapter 6 investigates the effects of financial crises on merger volume. Chapter 7 investigates the effects of financial crises on distribution of value between target and bidder shareholders. We study target premium, target CARs and bidder CARs as measures of distribution of value between target and bidder shareholders. Chapter 8 explores the effects of financial crises on value generation. We use the abnormal returns for hypothetically combined firms as the proxy for value generated in a merger. Chapter 9 presents a detailed analysis of differences in types of M&A deals during crisis versus non-crisis periods. Chapter 10 summarizes the results of
robustness tests. Chapter 11 concludes by summarizing the main findings and identifying possible future research questions that stem from findings of this study.
10
CHAPTER 2
:
LITERATURE REVIEW AND CONTRIBUTIONS OF THIS
STUDY
This thesis investigates the effects of financial crisis on the worldwide M&A market. In particular, we investigate if M&A deals in crisis periods differ in terms of target and bidder characteristics, M&A volume, value generation and distribution of value between target and bidder firm shareholders. This chapter relates the M&A literature with the financial crises literature. We identify if there are some links between the motivations underlying the M&A decisions (i.e., the forces that drive merger waves) and financial crises. Thus in order to formulate our hypotheses, we first review the literature on merger motives and financial crises.
We use a multi-country setting in the study and our sample covers both domestic and cross-border deals. In section 2.4 we present the findings of selected cross-border M&A studies in order to identify the additional complexities of working with international data.
11 2.1 Literature Review on Merger Motives
The extant literature on motivations for M&As can be classified under three main theories: value generation, misvaluation and agency conflicts. We summarize the leading studies of each theory in sections 2.1.1, 2.1.2 and 2.1.3 respectively.
In addition to these main theories, some studies emphasize the behavioral aspects of mergers. In particular, these studies, as summarized in section 2.1.4, claim that the overconfidence of managers might drive merger activity (Ferris, Jayaraman &
Sabherwal, 2013; Roll, 1986). Finally, some recent studies develop mixed models that incorporate ideas from different theories on merger motivation (Cornett, Tanyeri & Tehranian, 2011; Gorton, Kahl &Rosen, 2009).
2.1.1 Value Generation (Synergy)
The first group of studies focuses on operating, financial or managerial synergies as the main motivation for a merger decision. Damodaran (2005) defines synergy as the additional value generated by combining two firms. This synergy creates
opportunities that would not been available to these firms operating independently. Damodaran (2005) argues that “operating synergies affect the operations of the combined firm and include economies of scale; increasing pricing power and higher growth potential.” and “financial synergies are more focused and include tax benefits, diversification, a higher debt capacity and uses for excess cash.” Operating synergy increases the productivity of the combined entity (Jovanovich and Rousseau, 2002). Financial synergy enables the combined entity to invest in projects, which are not
12
available to them as stand-alone firms (Fluck and Lynch, 1999). Managerial synergy is possible if the combined entity is better at solving strategic, organizational and operational problems compared to individual target and bidder firms.
According to this group, companies should pursue an M&A activity only if it creates value (also named as Neoclassical Theory). The empirical literature on the value generation effects of M&A deals mainly examines the abnormal returns to shareholders in the period surrounding the announcement (Andrade, Mitchell, & Stafford, 2001; Cheng & Leung, 2004; Eckbo & Thorburn, 2000; Loughran & Vijh, 1997; Scherer, 1988; Smith & Kim, 1994; Tse and Soufani, 2001). Merger studies which use different samples conclude that the target firm's shareholders enjoy significant and positive returns and M&A deals deliver a premium return to target firm's shareholders. For the acquiring firm's shareholders, the findings are less conclusive. Studies that investigate target and bidder cumulative abnormal returns overwhelmingly focus on merger activity in US (Alexandridis, Mavrovitis, & Travlos, 2012; Alexandridis, Fuller, & Terhaar, 2013; Andrade et al., 2001; Bradley &
Sundaram, 2006; Fuller, Netter, & Stegemoller, 2002; Moeller, Schlingemann, & Stulz, 2004, 2005). A few articles focus on deals in a specific country/region (Campa & Hernando, 2004, 2006; Craninckx & Huyghebaert, 2011; Goergen & Renneboog, 2004; Ma, Pagan, & Chu, 2009; Martynova & Renneboog, 2011) and some on cross-border deals (Chari, Ouimet, & Tesar, 2010; Dutta, Saadi, & Zhu, 2013; Erel, Liao, & Weisbach, 2012).
The above cited studies and many others, which analyze value generation effects of M&A deals, use event-study methodology. These event studies employ financial
13
market data to measure the impact of the merger announcements on the value of target and bidder firms. Methodologically, event studies in the merger literature estimate the ‘expected stock returns5’ of the target/bidder firms at the announcement date and several days before and after the announcement date (also called as the event window) based on an estimation window prior to the announcement date. Then, the method calculates 'abnormal returns' as the difference between ‘expected returns’ and the 'actual returns'. In an efficient market, the effects will be reflected immediately on stock prices, following a merger announcement. Hence, most of M&A studies use
short horizon (from 1-month before to 1-month after the event) event windows. The most common event windows are 3-days, 5 days and 10 days surrounding
announcement.
Table 1 presents a summary of findings in this literature on 3-day target and bidder CARs and CARs for hypothetically combined bidder and target firms surrounding announcements. We summarize 16 studies for US deals, 5 for European deals, 6 for emerging countries and 1 for developed emerging country paired deals. In US studies 12 out of 16 report negative bidder returns and all report positive target returns
ranging from 13 percent to 23 percent. There are 9 studies that report combined 3-day CARs and all document positive CARs ranging from 0.7 percent to 3.5 percent. In Europe studies, target CARs range from 3 to 13 percent and bidder CARs range from -0.9 to 0.8 percent. Combined 3-day CARs in Europe are around 1 percent. For
5 Expected return determination in different studies is based on different specifications. The most
widely used model is the 'market model’. Market model uses an estimation window prior to the event date to derive the typical relationship between the firm's stock and a reference index through
a regression analysis. Based on the regression coefficients, the expected returns are estimated and used to calculate the abnormal returns. Some studies use Capital Asset Pricing Model (CAPM) and mean
14
emerging markets, Ma et al. (2009) reports 1.28 percent bidder CAR for 10 emerging markets, Selcuk and Kıymaz (2015) report significant (0.89 percent) bidder returns in Turkey. Hekimoglu and Tanyeri (2011) and Arslan and Şimşir (2013) report Turkish target CARs as 4.88 and 2.5 percent, respectively.
Some studies try to identify the value effects of M&A deals by examining changes in cash flow returns (Healy, Palepu, & Ruback, 1992; Ramaswamy & Waegelein, 2003), changes in market share (Mueller,1985) and changes in financial ratios like return on assets (ROA) and return on equity (ROE) (Mantravadi & Reddy, 2008).
Starting with Gort (1969) and expanded by Mitchell and Mulherin (1996), a group of studies on merger waves support the idea that firms merge as a response to regime shifts. Harford (2005) presents additional evidence that merger waves are driven by economic, regulatory and technological shocks.
Gort (1969) is the first to claim that discrepancies in valuation can determine variations in merger rates among industries and over time. He proposes that the valuation differentials are triggered by economic disturbances. He identifies rapid changes in technology and movements in security prices as main shocks. Other factors affecting merger rate in his model are barriers to entry by new firms (expects higher merger frequency when barriers are high) and growth in demand. He
documents a positive relationship between merger rate and growth using a sample taken from manufacturing industries during 1951-1959 period from FTC (Federal Trade Commission) records.
15
Table 1: M&A Literature on Value Creation (3-Day CARs)
Study Country Sample Size & Selection Criteria Sample
Period Bidder CAR (%) Target CAR (%) Combined CAR (%)
Alexandridis et al. (2012) USA N=3,206 bidders & 2,509 targets
Control Changing, Completed, Deal size>$1mil 1993-2007 -1.5*** 19.47*** 1.12*** Mulherin & Boone (2000) USA N=281 bidders & targets
Completed, Control Changing
1990-1999 -0,37 20.2*** 3.56***
Bauguess. Moeller, Schlingemann, & Zutter (2009)
USA N= 1,182 bidders & 1,668 targets
Control Changing, Completed 1996-2005 -1.75 21.66 0.69
Andrade et al. (2001) USA N=3,688 bidders & targets
Control Changing, Completed 1973–1998 -0.7 16.0** 1.8 **
Moeller et al. (2004 &
2005) USA N=12,023 bidders &1967 Combined Control Changing, Completed , Deal size>$1mil 1980–2001 1.10*** NA 1.35*** Netter et al. (2011) USA N=67,256 bidders & 4,047 targets
Control Changing, Completed
1992-2009 1.1*** 20.4*** NA
Alexandridis et al. (2013) USA N=3,035 bidders
Control Changing, Completed, Deal size>$1mil 1990-2007 -1.51*** NA NA
Cai, Song, & Walkling (2011)
USA N=6,930 bidders
Control Changing, Deal size>$10mil
1985-2009 0.71*** NA NA
Jacobsen (2014) USA N= 516 bidders. Withdrawn, Control Changing,
Deal value >=$10 mil. 1990-2007 -0.6*** NA NA
Hackbarth & Morellec
(2008) USA N=1,086 bidders & targets 1985-2002 -2.26*** 18.21*** NA
Harford, Jenter, & Li (2011) USA N=3,540 Control Changing, Completed 1984-2006 -1.3 19.4 1.9
16
Table 1 (cont’d),
Study Country Sample Size & Selection Criteria Sample
Period Bidder CAR (%) Target CAR (%) Combined CAR (%)
Becher et al. (2012) USA N=234 targets&337 bidders
Control Changing 1980-2004 -0.8*** 13*** 2.3***
Akbulut(2013) USA N=2,778
Control Changing
1993-2009 NA NA 1.42***
Li(2013) USA N=1,430 bidders & targets
Control Changing, Completed 1981-2002 -0.2 23.3
Ishii & Xuan(2014) USA N=539 bidders & 519 targets
Completed 199-2007 -1.97*** 20.06*** 1.04***
Craninckx & Huyghebaert (2011)
Europe N=267 with public targets& 336 with private targets (Bidder & target are non-financial EU firms) Completed, Control changing
1997-2006 0.16 (public targets) 0.78***(private
target)
7.56*** 1.1***
Campa & Hernando (2004) Europe N=262 targets & bidders ( listed EU firms)
Completed 1998-2000 0.44 3.93** 1.04**
Campa & Hernando (2006) Europe N=172 targets & bidders (public EU financial institutions)
/Control Changing 1998-2002 -0.87** 3.24**
Goergen & Renneboog (2004)
Europe N=142 bidders, 136 targets Deal size>=$100 mil
1993-2000 0.70*** 9.01*** NA
Martynova & Renneboog
(2011) Europe
6 N=2,109 bidders & 760 targets
Non-financial firms, control changing 1993-2001 0.72*** 12.47*** NA
Sehgal, Banerjee, &
Deisting (2012) BRICS countries7 N=214 bidders (percent acquired >15%) Completed M&As of BRICS countries 2005-2009 1.95 NA NA
Hekimoglu & Tanyeri
(2011) Turkey N=125 Turkish non-financial targets 1991-2009 NA 4.88*** NA
6 28 European Countries(UK and Continental Europe)
17
Table 1 (cont’d),
Study Country Sample Size & Selection Criteria Sample
Period Bidder CAR (%) Target CAR (%) Combined CAR (%)
Arslan & Şimşir (2016) Turkey N=105 Turkish targets, Completed 2005-2011 NA 2.5*** NA
Akben Selcuk & Kıymaz
(2015) Turkey N=98 Turkish bidders ,Completed 2000-2011 0.89* NA NA
Ma et al. (2009) 10 emerging
Asian markets8 N=1,477 bidders Bidder & target from 10 emerging Asian markets
Control Changing, Completed
2000-2005 1.28 NA NA
Bhagat Malhotra & Zhu
(2011) 8 emerging countries9 N=698 bidders. Cross border, Control Changing bidder is from 8 emerging countries 1991-2008 1.72***
Chari et al. (2010) 9 developed & 42 emerging countries10
N=348 Control Changing(CC) & 246 Not CC Completed, Deal size>$10 mil, developed bidder & emerging target (DM-EM)
1986–2006 1.16*** (CC) -0.02***(Not CC)
Notes: Table summarizes the findings of M&A papers that compute 3-day CARs around announcement date, in different samples. The symbols ***, **, and * denote statistical significance at the 1%, 5%, and 10% level, respectively.
8 10 emerging Asian markets studied by Ma et al. (2009): China, India, Hong Kong, Indonesia, Malaysia, Philippines, Singapore, South Korea, Taiwan, Thailand 9 8 emerging countries studied by Bhagat et al. (2011): Brazil, China, India, Malaysia, Mexico, Philippines, Russia, and South Africa
10 9 developed countries studied by Chari et al. (2010): Canada, France, Germany, Italy, Japan, the Netherlands, Spain, the United Kingdom, and the United States. 42
emerging countries: Antigua, Argentina, Barbados, Bolivia, Brazil, Cameroon, Chile, China, Colombia, Costa Rica, Ecuador, Egypt, Gabon, Guatemala, Honduras, India, Indonesia, Iran, Jamaica, Jordan, Kenya, Malaysia, Mauritania, Mauritius, Mexico, Morocco, Namibia, Nicaragua, Nigeria, Panama, Peru, Philippines, Republic of Congo, Saudi Arabia, South Africa, South Korea, Taiwan, Thailand, Uruguay, the United Arab Emirates, Venezuela, and Vietnam.
18
Mitchell and Mulherin (1996) broadens the idea of Gort (1969) by introducing a model where M&A’s are least cost means for industry structure to respond to economic shocks (deregulation, changes in input costs, innovations in financing technology). They test their hypothesis based on a sample of 1,064 firms from 51 Industries during 1982-1989 period and find that variation in takeover activity in each industry is significant compared to the entire sample. They also document that the takeovers in a given industry tend to cluster in a subsample of years compared to the entire distribution. Finally, they also show that sales shocks and employment shocks are positively related to takeover activity.
Harford (2005) also finds evidence that merger waves are driven by economic, regulatory and technological shocks. However he states that shocks can only generate merger waves if there is sufficient capital liquidity to be used in the transactions. He admits that market timing can be effective for managers while taking the merging decision but also states that such mergers do not cause merger waves. His findings are obtained from a sample of merger or tender offer bids from 1981-2000 period in which he has identified 35 waves from 28 industries.
Fluck and Lynch (1999) develop an alternative theory of mergers and divestitures, which is only applicable if one of the firms is a financially distressed firm with agency problems. They claim that the inability of individual firms to finance marginally profitable and possibly short horizon projects is the motivation for
mergers. Since the merger is only a tool to invest in the project, the financing synergy ends as profitability improves which in turn leads the acquirer to divest assets. Their study does not involve any empirical evidence.
19
As an extension of neoclassical theory of mergers, Jovanovic and Rousseau (2002) present a broader version of “Q-theory of investment”11 to the mergers. They treat mergers as used capital trade since merger is re-allocative. In other words, high productivity firms acquire low productivity firms so as to make their assets more profitable. In their model, the gap between the qs of potential acquiring and target firms can create a merger wave.
2.1.2 Market Misvaluation (Mispricing)
Some researchers focus on market imperfections as the main merger motivation. Myers and Majluf (1984) show that managers with insider information may alter their investment decisions accordingly if their firms’ shares are mispriced. The informatıon asymmetry between managers and investors puts managers at an advantageous
position in merger decisions. Overvalued stocks may motivate managers to engage in mergers as bidders and pay with stock.12
Shleifer and Vishny (2003) claim that stock market misvaluations of the combining firms may lead to merger activity. In their model, some firms are valued incorrectly and the managers of bidding firms are rational players so they take advantage of these inefficiencies in their merger decisions. According to misvaluation theory, wave-like clustering can be result of aggregate overvaluation. Rhoades-Kroft and Viswanathan (2004) also develop a model where rational managers without perfect information overestimate synergies during valuation waves and this misvaluation creates merger
11
Q-theory of investment: q is defined as market value of existing shares divided by replacement cost of physical assets and additional investment makes sense when q>1.
12 Cornett, Tanyeri and Tehranian (2011) argue that managers may utilize their information advantage
to serve shareholders or to protect opportunistic benefits. On the one hand, they may try to generate long run value for pre-merger shareholders at the expense of post-merger shareholders (Hansen (1987), Schwert (1996), and Betton et al. (2009)). On the other hand, managers may only look for their opportunistic benefits at the expense of both pre- and post-merger shareholders (Jensen (2005)).
20
waves. Rhoades-Kroft, Robinson and Viswanathan (2005) provide empirical evidence for the misvaluation theory by decomposing the M/B ratio into three components that are firm-level, sector level and a component for long-run growth opportunities. Based on a sample from 1978-2001, they confirm that higher M/B firms tend to acquire lower M/B firms in the short run. However, the long-run behavior is just the reverse and they also document larger market to book differences between bidder and target compared to completed deals.
2.1.3 Agency Conflicts
A group of researchers emphasize the agency problems as the main driver of mergers. The agency theory states that managers look after their own self-interest instead of shareholders. (Goel & Thakor, 2010; Jensen & Meckling, 1976; Jensen, 2005) The M&A decisions of these managers may reflect their desire to build empires even if little or no value is associated with the deal. Managers may also use M&As to accomplish their growth and earnings targets, without paying attention to the effects on shareholder value.
Goel and Thakor (2010) develop a formal model where envy among CEOs of bidder firms can generate merger waves even when the first firm in the wave only has idiosyncratic shock. They also empirically test some of the predictions of their model based on a sample of acquisitions realized by US-listed firms where the acquirer obtains at least 50% of target shares during a merger wave for 1979 to 2006 period. In particular they verify that earlier mergers in a merger wave involve smaller targets,
21
create higher abnormal returns for bidders and result in larger compensation for top management compared to later mergers in the wave.
2.1.4 Behavioral Models
Roll (1986) introduced the concept of managerial ‘hubris’, which means that the managers are likely to be overconfident in their ability to negotiate a good deal for their shareholders and then run the combined entity. This overconfidence leads these managers to overpay for their acquisitions. Ferris, Jayaraman and Sabherwal (2013) present evidence that overconfidence of Chief Executive Officers (CEO) influences the number of offers made, the frequencies of non-diversifying and diversifying acquisitions, and the use of cash rather than equity as the primary financing vehicle. They also argue that overconfidence of managers play role in explaining international M&As. The degree of overconfidence in different countries is shaped by their
cultures. In particular, as the degree of individualism increase in a given country, the degree of overconfidence increases. Their empirical results are based on a sample drawn from mergers during 2000 to 2006 executed by 500 largest non-financial companies ranked by Fortune magazine. The overconfidence data is constructed using Factiva database.
2.1.5 Mixed Studies
Recently some studies presented models acknowledging that merger decision is a combination of different factors. The study of Gorton, Kahl and Rosen (2009) introduced as “eat or be eaten theory” is based on the idea that “the desire not to be acquired is an important managerial motive”. In their model, managers can reduce the
22
chance of being acquired by increasing the size of their firm through acquiring another firm (even by unprofitable defensive actions). They claim that anticipation of merger opportunities can lead to defensive13 or "positioning" acquisitions and the industry structure matters in the decisions. They empirically test their hypothesis based on a sample of US firms that are in both the CRSP and Compustat databases during 1982-1999 period and they detect two things: “First, the profitability of acquisitions increases in the ratio of the size of the largest firm in the acquirer's
industry to the size of other firms in its industry, all else equal. Second, the quantity of mergers increases in the proportion of medium-size firms in an industry, all else equal.”
Cornett, Tanyeri and Tehranian (2011) develop a model of investor anticipations of both bidder and target firm candidacy by incorporating multiple merger motives (generate shareholder value and generate opportunistic benefits for managers) using a two-stage framework. They investigate if investors can anticipate bidder and target merger candidacy. They also examine if investor anticipations about candidacy affect the stock price responses to merger announcements and hence distribution of value between bidder and target firm shareholders. They use a sample of non-financial US merging and non-merging firms for 26 years from 1979 to 2004. Mergers used in the study are completed deals that transfer control rights from the target to the bidder firm in which at least one of the two firms are publicly traded. A firm is identified as a bidder (target) in a given year if it proposes (solicits) at least one bid in the next year. Their final sample is 98,554 firm years (4,964 firm years for bidder subsample; 2,830
13
Defensive merger is defined as value reducing merger for shareholders but provides the managers of acquiring firms to retain their jobs.
23
firm years for target subsample and 90,760 firm years for non-merging subsample). In their model investors cannot directly observe managerial motives. Instead, they observe merger announcements. They find that investors predict bidder firms more accurately than target firms. This asymmetry in investor anticipations about merger candidacy causes disparity in bidder and target firm announcement period abnormal returns. The difference in merger anticipation may account for documented higher magnitude of target firm CARs than bidder CARs.
2.2 Literature Review on Financial Crisis
Mishkin (1992) defines a financial crisis as “a disruption to financial markets in which adverse selection and moral hazard problems become much worse, so that financial markets are unable to efficiently channel funds to those who have the most productive investment opportunities”
Most of the studies related to financial crises try to answer three main questions: (i) what are the causes of financial crises? (ii) What are the consequences of a crisis? and (iii) what are the possible action plans for countries experiencing crises?
Studies, which investigate the causes of crisis and potential early indicators, are generally categorized as first generation models, second-generation models and other models in the literature. The First Generation Models, which are also known as exogenous -policy models (Flood & Garber, 1984; Krugman, 1979), are mainly based on experiences of Latin American Economies in 1970s, 1980s. In these models, crises are an unavoidable outcome of a deterioration of the fundamentals, typically due to
24
inconsistency of economic policies and the main indicator of crisis is runs on FX Reserves at the Central Bank. Early warning indicators identified in this group of studies are decline in FX reserves, budget deficits and growth in domestic credit.
The Second Generation Models (Krugman, 1999; Obstfeld, 1997) are introduced after the European Monetary System (EMS) Currency Crisis in 1992-93 since some
countries with adequate FX Reserves, manageable domestic credit and low fiscal deficit are affected. These models present a game theoretic approach for government’s optimizing decisions on whether to keep fixed exchange rate regime. Early indicators identified by this group are public debt, maturity mismatches of banks and real interest rates.
As the 1997-1998 Asian-Crisis has exploded, additional models of financial crises are introduced in order to further investigate the crisis issue. The “moral hazard models” as introduced by Allen and Gale (2000) claim that “Liquidity Shocks” can explain financial crises. This claim is based on the idea that moral hazard problems of banks due to investment using debt-financed money are the main underlying reason for crises. Thus, fragile financial system accounts for observed crises and according to these studies an index of financial system fragility may act as an early warning indicator. Another group of additional models is the Information Cascade Models (Drazen, 2000). These models are based on the idea that expectations are formed under the context of imperfect and asymmetric information. In these models, large expectation shifts may occur due to small injection of new, possibly wrong
information. These large expectation shifts mainly stem from the so-called herding behavior among investors (Bikhchandani & Sharma, 2000).
25
An important line of study in crisis literature investigates how financial crises can spread to other sectors and countries. These are known as “contagion models”. Masson (1998) identifies monsoonal effects (common external shocks to countries), spillover effects (effects on trading partners or competitors) and pure contagion effect (spread of crises based on market sentiment or herding behavior). Channels for contagion are also widely studied (Bekaert, Harvey, & Ng, 2005; Kaminsky & Reinhart, 2000; Van Rijckeghem & Weder, 2001). The main channels identified are financial channels such as banks, mutual funds, pension funds and insurance
companies and trade channels. These channels transmit crises across countries.
An important consideration when studying financial crises is to understand different types of crises. Laeven and Valencia (2008, 2010) compile a worldwide crises
database for the period 1970 to 2009 where dates of systemic banking crises, currency crises and debt crises are identified for various countries. Two conditions for systemic banking crisis in their study are: significant signs of financial distress in the banking system (as indicated by significant bank runs, losses in the banking system, and bank liquidations) and significant banking policy intervention measures in response to significant losses in the banking system. They detect a currency crisis when nominal depreciation of the currency is at least 30 %, and if this depreciation simultaneously satisfies the condition of min 10 % increase in the rate of depreciation, compared to the year before. Their 2008 study identified 208 currency crises worldwide for 1970-2007.Their debt crisis identification is based on Beim and Calomiris (2001), World Bank (2002), Sturzenegger and Zettelmeyer (2006), and IMF Staff reports and the database includes 63 cases since 1970. Laeven and Valencia (2012) extends the crisis
26
database so as to include the subprime mortgage crisis14 and their final database covers crises up to 2011.
Reinhart and Rogoff (2009) also provide a comprehensive study of financial crises by analyzing various crises from 12th century to today. Their well-known book presents a history of financial crises for 66 countries over 8 centuries. They identify banking crisis, sovereign debt crisis, inflation crises and currency crashes as different types of crises. Banking crisis and sovereign debt crisis are classified under “crisis defined by events” while inflation crises and currency crashes are classified under “crisis defined by quantitative thresholds”. They label certain times as “banking crises” when a significant part of banking sector has become insolvent after heavy investment losses, banking panics or both. Banking crises are observed in both poor and rich countries. When a government fails to meet payments on its external or domestic debt
obligations or both, then we are facing a “sovereign debt crisis”. A sovereign debt crisis is an issue for emerging market countries. “Inflation crisis” happens when annual inflation rate is higher than 20% (extreme case threshold is 40%)15. “Currency crashes” are characterized as times when we observe annual depreciation versus US dollar of 15% or more. They also point out that it is uncommon to observe one type of crises at a time and crises often occur in clusters.
However, we have to be very careful while using above mentioned financial crises databases or any other comprehensive database, which defines crisis periods as binary variables of crisis versus no-crisis periods while conducting empirical studies.
14The term ‘subprime mortgage crisis’ refers to U.S. recession of December 2007 – June 2009.It is named after the collapse of a housing bubble in US, which triggered a large decline in home prices and marked the beginning of a deep financial crisis in US.