Preparation, surface state and band structure studies of SrTi
(1
− x)
Fe
(x)
O
(3
− δ)
(x = 0
–1) perovskite-type nano structure by X-ray and ultraviolet
photoelectron spectroscopy
Mohammad Ghaffari
a,b,c,⁎
, Mark Shannon
b, H. Hui
a, Ooi Kiang Tan
a, Ahmad Irannejad
d aSchool of Electrical and Electronic Engineering, Nanyang Technological University, 50 Nanyang Avenue, Singapore 639798, Singaporeb
Mechanical Science and Engineering, University of Illinois at Urbana-Champaign, Urbana, Illinois 61801, USA
c
Department of Electrical and Electronics Engineering, UNAM - National Institute of Materials Science and Nanotechnology, Bilkent University, Ankara 06800, Turkey
d
Department of Materials Science and Engineering, School of Engineering, Shahid Bahonar University of Kerman, Kerman, Iran
a b s t r a c t
a r t i c l e i n f o
Article history: Received 29 August 2011 Accepted 19 December 2011 Available online 27 December 2011 Keywords:
SrTi(1− x)Fe(x)O(3− δ)(STFx)
Perovskite
High temperature solid state reaction EXAFS
XPS UPS
In this report, SrTi(1− x)Fe(x)O(3− δ)photocatalyst powder was synthesized by a high temperature solid state reaction method. The morphology, crystalline structures of obtained samples, was characterized by X-ray dif-fraction (XRD), scanning electron microscope (SEM), and transmission electron microscopy (TEM), respec-tively. The electronic properties and local structure of the perovskite STFx(0≤x≤1) systems have been probed by extended X-ray absorptionfine structure (EXAFS) spectroscopy. The effects of iron doping level x (x = 0–1) on the crystal structure and chemical state of the STFxhave been investigated by X-ray photoelec-tron spectroscopy and the valence band edges for elecphotoelec-tronic band gaps were obtained for STFxby ultraviolet photoelectron spectroscopy (UPS). A single cubic perovskite phase of STFxoxide was successfully obtained at 1200 °C for 24 h by the solid state reaction method. The XPS results showed that the iron present in the STFx perovskite structure is composed of a mixture of Fe3+and Fe4+(SrTi
(1− x)[Fe3+, Fe4+](x)O(3− δ)). When the content x of iron doping was increased, the amount of Fe3+and Fe4+increased significantly and the oxygen lattice decreased on the surface of STFxoxide. The UPS data has confirmed that with more substitution of iron, the position of the valence band decreased.
© 2011 Elsevier B.V. All rights reserved.
1. Introduction
The perovskite-type oxides are well known among the metal oxide photocatalysts for having the important characteristics of par-tial substitution of the cations at both the A and B sites of ABO3and
the ability to maintain stable mixed oxidation states or unusual oxi-dation states in the crystal structure. For example if the Cr (Fe) cat-ions are alternatively doped at the Sr2+site rather than the Ti4+
site, different photo physical and photocatalytic properties would be obtained. A wide range of cations and valences can be accommodated in this simple crystal structure due to the susceptibility of partial sub-stitution at both the A and B sites, and so rendering perovskite to var-iousflexible chemical tailoring[1]. As a typical ABO3type perovskite,
SrTiO3has been known as a photocatalyst capable of decomposing
H2O into H2 and O2 without applying an external bias potential
[2,3]. In recent years, many perovskite materials were studied, and the results of these reports on the ABO3that contained transition
metal ions (B) presented an interesting range of electrical properties.
Perovskite structure material are used in a wide range of applications such as catalysis[1,4], photocatalysis[5,6], fuel cells[7], magneto-optics[8,9], and in spin valves[10]. The stability of perovskite mate-rials at high temperatures and in chemically aggressive atmospheres has made these materials such as SrTiO3and BrTiO3suitable as
gas-sensor materials[11,12].
Strontium Titanate Ferrite, STFx, has a continuous solid state
solu-tion between strontium ferrite, SrFeO3and strontium titanate, SrTiO3.
The existence of oxygen vacancies in STFxis unavoidable because in
this structure, when the iron atoms were replaced with the titanium atom and due to the difference in their preferential oxidation states (+4 for Ti and + 3 for Fe), oxygen vacancies were formed in order to maintain charge balance in the system[13,14]. STFx has found
vast applications in oxygen sensor [14–16], hydrocarbon sensor
[17], fuel cell[16,18], oxygen separation membranes[19]and phase shifters in communication systems[20], however the STFxcompound
is yet to be fully understood and more research is needed.
This paper describes a simple procedure for the synthesis of STFx
series (x = 0~1), with x at 0.2 interval, by a high temperature solid state reaction process (1200 °C, two cycles in oxygen ambient with flow rate of 150 sccm). Next, the surface chemical states of the syn-thesized STFxsamples were characterized by XPS and UPS in order
to elucidate the structure with a different doping of iron in the
⁎ Corresponding author at: School of Electrical and Electronic Engineering, Nanyang Technological University, 50 Nanyang Avenue, Singapore 639798, Singapore. Tel.: + 65 935 395 47.
E-mail addresses:[email protected],[email protected](M. Ghaffari). 0039-6028/$– see front matter © 2011 Elsevier B.V. All rights reserved.
doi:10.1016/j.susc.2011.12.013
Contents lists available atSciVerse ScienceDirect
Surface Science
SrTiO3perovskite structure. The crystal structure was examined with
quantitative X-ray diffraction (XRD). 2. Experimental
Strontium carbonates (SrCO3, 99.9%), iron oxide (α-Fe2O3, 98.9%)
and titanium dioxide (anatase TiO2, 99.9%) were commercially
obtained and supplied by Aldrich. The synthesis of STFx powders
(x = 0, 0.2, 0.4, 0.6, 0.8 and 1) was carried out with high temperature solid state reaction technique. First, strontium carbonate, iron oxide and titanium dioxide powders were prepared according to the x value, and then mixed manually in an agate mortar for 15 min. The mixture was calcinated at 1200 °C for 24 h in oxygen ambient, with aflow rate of 150 sccm. Next, furnace cooled to room temperature down and grinded again manually in the agate mortar for 15 min. The ground powder was further calcinated at 1200 °C for another 24 h and furnace cooled to room temperature in oxygen ambient.
The phase structure of the powders was identified using a Shi-madzu Laboratory XRD-6000 instrument. Powder XRD patterns were collected over the angular range of 20–80° 2theta using Bragg–Brentano geometry (Cu Kα source, primary and secondary Sol-ler slits, 0.1 mm divergence slits, 0.3 mm receiving slit and secondary graphite monochromator). The diffractometer was calibrated using a laboratory standard (NIST SRM 660a). The surface chemical composi-tion of the powders was monitored by X-ray Photoelectron spectros-copy (XPS) measurements, performed with a Kratos Axis ULTRA X-ray Photoelectron Spectrometer and an Mg Kα anode (1253.6 eV photon energy, 15 kV, 300 W) at a take-off angle of 45°. Valence band UPS experiments were performed using He I (21.22) eV and Al Kα (1486.6) eV photon lines. Binding energies were calibrated by measuring the Fermi step position and the Au 4f7/2core level of a
clean goldfilm.
3. Results and discussion
3.1. Structure and microstructure analysis
The XRD analysis was performed for STFxpowders for x varying
from 0 to 1 and shown inFig. 1(a). All peaks were indexed, indicating that Fe is dissolved within the crystal lattice of the SrTiO3compound.
All the diffraction peaks can be indexed by standard card number of 91062-ICSD, indicating the continuous solid solution of Fe in SrTiO3.
The XRD peaks shift to a higher diffraction angle with increasing Fe concentrations, which is evidence for the increasing substitutional doping of Fe in STFx(Fig. 1(b)). The ionic radius of Fe3+(0.585 ) is
smaller than Ti4+(0.605 ), hence doping of Fe leads to a decreased
lattice parameters and interplanar spacing in STF[21].
The Rietveld refinements of the XRD data were carried out using the perovskite structure (space group: PM3M) and the 91062-ICSD stan-dard card number to measure the crystallite size, lattice parameter, strain and oxygen vacancy. Rietveld analysis is a semi-quantitative method of analyzing the whole diffraction pattern of X-ray or neutron powder diffraction. For extracting more precise information, a single-number integrated intensity Iobsis replaced (i.e. spread out) by a peak
with heights yialong the points of a step scan in 2-theta[22].Fig. 2
shows the Rietveld pattern determined from X-ray powder diffraction data for SrFeO3. Plots denote observed data, the red line denotes
calcu-lated profiles, and the green line denotes the difference. The vertical lines indicate possible Bragg peaks of the monoclinic SrFeO3phase.
Table 1shows the values of the crystallite size, lattice parameter, oxy-gen vacancy, lattice strain and R-Bragg of STFxcompositions obtained
with Rietveld refinement. The doping of Fe can induce a high tendency of oxidization. Thus, the crystallites size increases as well. Moreover, the lattice parameter of the samples due to difference of the ionic radius of the Fe and Ti, decrease from 3.9083 (Å) to 3.8601 (Å). oxygen vacancy (δ) is a result of charge neutrality. The oxygen vacancy (δ) must
decrease with increasing doping content of Fe to maintain the charge neutrality of the compound. This is also confirmed by XPS analysis that will be explained later. The local lattice strain shows afluctuation that can be explained by increasing the distortion and mismatch of the structure with Fe doping.
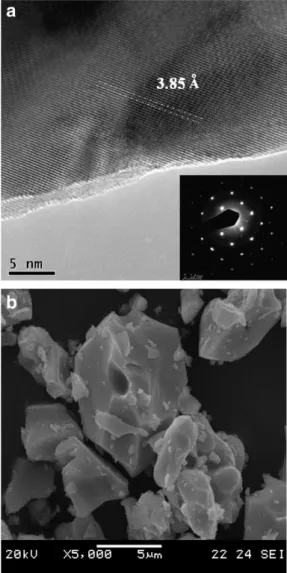
Fig. 3(a), (b) shows the TEM and SEM images of SrFeO3(SFO)
par-ticles respectively. Selected area electron diffraction (SAED) patterns confirm the strontium ferrite crystallite (Fig. 3(a)).Fig. 3(a) present the indexing of SrFeO3(SFO) powder with [111] zone axis.
3.2. XAFS study
The coordination chemistry of iron (titanium) was of particular in-terest. Information about the pre-edge features of the X-ray absorp-tion near the edge structure (XANES) region was related to the d-electron configuration and local symmetry of iron (titanium). The extended X-ray absorptionfine structure (EXAFS) region was used to probe local geometric structures up to several coordination shells around iron (titanium) ions, where the Fe–O (Ti–O) distance was of interest in connection with the valence state of iron. The Fe and Ti K-edge XANES spectra for the STFxsamples at various x (0, 0.2, 0.4,
0.6, 0.8 and 1) are shown inFig. 4(a) and (b), the standard Fe and Ti foils are also presented.Fig. 5shows a schematic representation
10 20 30 40 50 60 70 80 90 2 (degree) (221) (031) (222) (022) (211) (021) (002) (111) (011)
STF 1.0
STF 0.8
STF 0.6
STF 0.4
STF 0.2
STF 0.0
Intensity (a.u) (001) 31 32 33 34 35STF 0.0
STF 1.0
STF 0.8
STF 0.6
STF 0.4
STF 0.2
Intensity (a.b.u)a
b
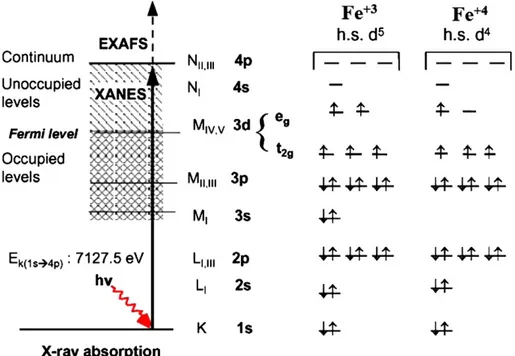
2 (degree)of the atomic orbitals for Fe+ 3and Fe+ 4and the expected K-edge XAS
transitions to half occupied or empty orbitals and into the continuum. In an octahedral crystalfield, the t2gorbitals occur at lower energy than
the egorbitals. This is a reflection of the orientation of the orbitals
since the t2gare directed between bond axes while the egpoint along
bond axes. The Jahn–Teller Theorem predicts that distortions should occur for any degenerate state, including degeneracy of the t2glevel,
however distortions in bond lengths are much more distinctive when the degenerate electrons are in the eglevel[23,24].
At the K-edge X-ray excitation, electrons of 1s orbitals are trans-ferred to partially occupied or empty states (XANES region) nearby the Fermi level (3d and 4p-related orbitals), at higher energy X-rays electrons jump to the continuum (EXAFS region, where the outgoing electrons are scattered by neighboring atoms) [25–27]. Structural data on cubic perovskite AB3(A = Sr, B = Ti, Fe) suggests that 6 oxygen
atoms are observed in the cationfirst coordination sphere in position B. The second and third coordination spheres contain 8 strontium atoms and 6 metal atoms, respectively[28]. The pre-edge peaks A and B, main peaks C and D inFig. 4(a) can be identified.
The pre-edge peaks were related to a pure quadrupole origin due to 1s→3d transitions in transitional metal oxides [29–31]. Under careful observation, the peak A for SrTiO3 appears to be actually
made of two peaks. As reported earlier[32,33], A1is a pure
quadrupo-lar (E2), A2is partial quadrupolar (and partial dipolar), B is pure
dipo-lar (E1). Even in SrTiO3, a high distortion in TiO6was observed. A is
lowest for the perfect octahedral TiO6(Oh symmetry) and can be
en-hanced by a distortion to Oh due to the loss of centro-symmetry. It was suggested that the intensity of the peak B is proportional to a dis-placement of Ti atoms from the center of the TiO6octahedra[30]but
inversely related to the Ti–O bond length. The peak C is a 4p-related “shape resonance” in the continuum part of the spectrum and the peak D is attributed to more delocalized states[34,35]. The XANES spectra show almost no edge shift as a function of x but its intensity and shape change systematically with x.
The spectra with low Fe content exhibit the lowest pre-edge peak A intensities inFig. 4(a), with increasing Fe contents. Peak A is stron-ger and not resolved into two peaks, while peak B shifts slightly to high energy. The peak C also slightly shifts toward high energy. Within the accuracy limit of XANES, any changes or splitting with the peak A inFig. 4(b) is not observable. This may be due to the more closely
Table 1
Crystallite size, lattice parameter, oxygen vacancy, lattice strain and R-Bragg values of STFxpowders calculated from Rietveld refinement.
x in STFx Crystallite size (nm) Lattice parameter (Å) Oxygen vacancy (δ) Lattice strain (%) 0 243.6 3.908 0.0207 0.0116 (L)* 0.2 280.4 3.901 0.0735 0.3519 (L)* 0.4 320.2 3.894 0.1554 0.6372 (L)* 0.6 350.5 3.884 0.2067 0.4981 (L)* 0.8 378.3 3.874 0.2466 0.2377 (L)* 1 445.8 3.860 0.2566 0.3348 (L)*
*Strain L means Lorentzian (This described the symmetrical part of an X-ray diffraction peak). 110 105 100 95 90 85 80 75 70 65 60 55 50 45 40 35 30 25 20 15 10 6,000 5,000 4,000 3,000 2,000 1,000 0 -1,000 SrFeO3 100.00 % Red Line Green Line
(a)
(b)
(c)
Fig. 2. Rietveld pattern determined from X-ray powder diffraction data for SrFeO3.
Fig. 3. (a) TEM micrographs of SrFeO(3− δ)and SAED patterns could be indexed as
strontium ferrite with [111] zone axis and (b) SEM micrograph of the strontium ferrite particles at 1200 °C temperatures × 10,000.
packed FeO6 clusters and highly symmetry because of the smaller
atomic radius for Fe. With increasing Fe dopant, the intensities of B1
and B2and their ratios change continuously. No significant shift for
the main peak was observed inFig. 4(b). 3.3. XPS studies
The surface composition of the STFxseries samples was
character-ized by XPS technique. All XPS spectral peaks were fitted with CASAXPS software. The data analysis involved spectra normalization, Shirley background subtraction, and curve-fitting Gaussian–Lorent-zian (30% LorentGaussian–Lorent-zian) line shapes [36]. Best fits were evaluated using a root-mean-square measure where line shape, peak width (full width at half maximum, or FWHM) and binding energy were ad-justable parameters. Shirley backgrounds were used in allfits to narrow scan spectra[37]. As required by theory, O 1s and C 1s spectral lines con-sist of a single peak (a singlet) whereas the Fe 2p, Ti 2p and Sr 3d spec-trum consist of two peaks, a spin-orbit doublet. The C 1s spectral line was standardized to 285.0 eV and the O 1s, Fe 2p, Ti 2p and Sr 3d spectra were adjusted to this energy.
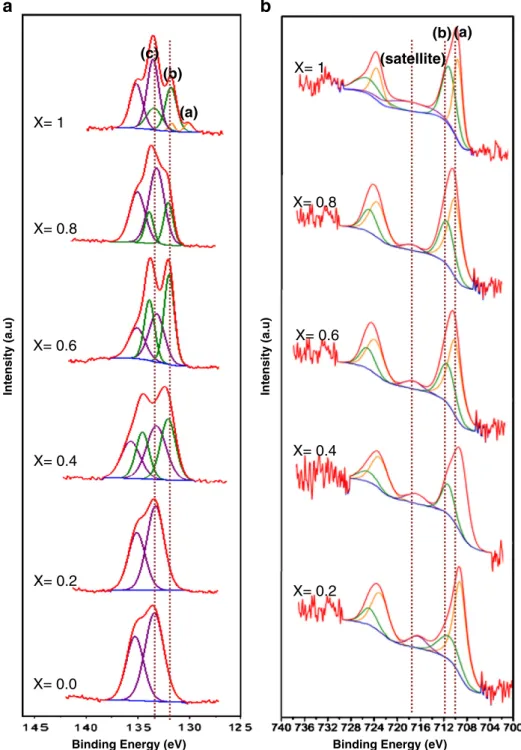
To illustrate the spectral features of the STFxseries samples, the O
1s, C 1s, Sr 3d, Fe2p and Ti 2p peaks are summarized inFigs. 6 and 7, respectively. Deconvolution of the O 1s spectra yields three peaks, namely O 1s a (529.0 eV), O 1s b (531.2 eV) and O 1s c (532.9 eV). From the literature, the peak at the 532.9 eV is probably due to the water and hydroxide absorbed on the surface[38–41], while the peaks at 531.2 eV correspond to carbonate compounds and chemical Adsorption[42–51]. The main peaks at 529.0 eV (O 1s a) correspond to the oxygen lattice[19,20,50]. Quantitative analysis has shown that with increasing iron content in STFxseries, the amount of the oxygen
lattice decreases. This observation can be attributed to the partial sub-stitution of Fe with Ti, iron participation with mixed oxidation state of Fe3+to Fe4+and the formation of oxygen vacancy that consequently
led to the reduction of the amount of oxygen lattice. The ratio of O 1s a is presented inTable 2, shows that with increasing iron content this ratio decreased. This can be explained by the formation of the oxygen vacancy with Fe occupying the Ti site.Fig. 6(b) shows the detailed peak scan for C 1s. Three peaks were observed, namely C 1s a (285 eV), C 1s b (286.1 eV) and C 1s c (289.1 eV). The low binding en-ergy peak at 285 eV with strong intensity is the result of the presence SrTi1-xFexO3 0.0 0.2 0.4 0.6 0.8 Ti 4.96 4.97 4.98 4.99 5.00 5.01 5.02 5.03 0.0 0.3 0.6 0.9 1.2 1.5 4.968 4.971 4.974 4.977 4.980 4.983 0.0 0.1 0.2 0.3 D C B A
Normalized absorption (a.u.)
Energy (keV) A2 A1 B A B 1 B2 SrTi1-xFexO3 0.2 0.4 0.6 0.8 1.0 Fe 7.10 7.12 7.14 7.16 7.18 7.20 7.22 0.0 0.3 0.6 0.9 1.2 1.5 D C B2 B1 A
Normalized absorption (a.u.)
Energy (keV) 7.108 7.112 7.116 7.120 0.05 0.10 A
A
b
a
Fig. 4. Ti K-edge (a) and Fe K-edge (b) XANES spectra of the SrFexTi(1− x)O3samples at
x = 0, 0.2, 0.4, 0.6, 0.8, 1. The inset in (a) is pre-edge peaks for Ti edge and (b) Fe K-edge.
Fig. 5. Molecular orbital scheme of Fe+ 3
and Fe+ 4
of adventitious carbon (C–H)[44,45,50], which is due to atmospheric contamination and is always present on a solid surface that is used as the calibration reference. The higher binding energy at 286.1 eV is possibly due to the CO like species (C–O) [44]. The well-defined peak at 289.1 eV is related to carbonates (O–C–O and/or C=O)
[42,50,52]as a result of the perovskite thermal treatment.
The Sr 3d spectrum can befitted with three spin-orbital doublet pairs that originate from different chemical coordination of Sr, name-ly Sr 3d (a), Sr 3d (b) and Sr 3d (c). The Sr 3d regions werefitted by doublets withfixed spectroscopic parameters, spin-orbital separation (1.8 eV) and 3d3/2:3d5/2branching ratio of 0.667, but with
indepen-dent and variable full width half maximum (fwhm), positions and in-tensities, as optimized by thefitting program. The Sr 3d3/2and 3d5/2
spectrum presents two doublets. The first is at binding energies
132.6 and 130.8, the second at 133.7 eV and 131.9 eV, and the third at 135.6 eV and 133.8 eV (Fig. 7(a)). The main doublet feature centered at ~133.8 eV is the characteristic of perovskite crystal, while the other features shift toward lower energy by ~1.8 eV can be attributed to to SrCO3and the peak. The peak of Sr 3d (a) at 130.8 eV was observed
only for STF1which can be attributed to the Sr ions surrounded by
va-cancies in the oxygen-deficient perovskite structure that is similar to that of SrO(1− x). This phenomenon can be explained by the dramatic
increase of Fe3+and Fe4+in SrTi(1− x)[Fe3+, Fe4+](x)O(3− δ)perovskite
structure[45,53,54]. The peaks at 131.9 eV Sr 3d (b) observed for all samples correspond to SrCO3and the peak at 133.80 eV, Sr 3d (c)
ob-served corresponds to Sr (Perovskite) respectively (Fig. 6(a))
[26–28,34]. The Sr/Fe ratio is higher by more than 3-fold than the stoi-chiometric Sr/Fe = 1 value for STF0, and it decreases slightly with
X= 1
X= 0.8
X= 0.6
X= 0.4
X= 0.2
X= 0.0
(a)
(b)
(c)
Binding Energy (eV)
Intensity (a.u)
X= 1
X= 0.8
X= 0.6
X= 0.4
X= 0.2
X= 0.0
(a)
(b)
(c)
Binding Energy (eV)
Intensity
(a.u)
a
b
540 535 530 525 520 296 294 292 290 288 286 284 282
decreasing O content of the STFxperovskite. This result indicates that Sr
is segregated toward the surface of the samples. It was found that a Gaussian–Lorentzian (GL) ratio of 30 in the fitting parameters give the best goodness offit, χ2 is close to 1. Moreover in Strantium peak fitting we can assign Sr(a) peak that only for STF1and if added any other third
peak the Sr(a) and Sr (b) overlapping in the same position.
The nature of the iron species in the STF samples can be deter-mined by deconvoluting the XPS spectra of the Fe 2p spectral regions (Fig. 7(b)). In all the cases it can be observed the presence of a main band centered at 710.1 eV accompanied by a secondary one displaced 13.7 eV to higher binding energy (723.8 eV), in addition to a satellite peak around 719.9 eV confirming the presence of Fe3+species in the
surface of all STF samples[55–58].
The Fe 2p XPS region (Fig. 7(b)) shows a doublet of 2p3/2 and 2p1/2. By deconvoluting the Fe 2p spectra, two components can be
obtained. The Gaussianfitting of the peaks into the component of Fe3+and Fe4+is also indicated inFig. 7(b). The peaks at 710.0 eV
(Fe 2p (a)) and 723.9 eV are similar to those reported for Fe 2p study and the shake-up contribution at about 719.9 eV is consistent with the presence of Fe3+. The second doublet peaks appeared at
711.9 eV (Fe 2p (b)) and 725.6 eV could be assigned to Fe4+.
Thefitting results and the ratio of Fe3+and Fe4+are presented in
Table 2. It was obvious that iron in STFxperovskite structure
participat-ed in the mixture of Fe3+and Fe4+(SrTi
(1− x)[Fe3+, Fe4+](x)O(3− δ))
and with increasing iron dopant the amount of Fe3+and Fe4+ in-creased significantly. Bocquet et al. investigated the electronic struc-ture of the Fe4+perovskite oxide SrFeO
3by XPS, and concluded that
the large increase in charge at the Fe site led to a chemical shift to a higher binding energy[56,58,59]. Moreover with an increasing amount of Fe4+, the shape of the satellite also changed. P. Mills et al.[41]and
X= 1
X= 0.8
X= 0.6
X= 0.4
X= 0.2
X= 0.0
(a)
(b)
(c)
Binding Energy (eV)
Intensity (a.u)
(b) (a)
X= 1
X= 0.8
X= 0.6
X= 0.4
X= 0.2
Binding Energy (eV)
Intensity (a.u)
(satellite)
a
b
other researchers[42]presented that the position of the satellite state is the key andfinger print to detect the oxidation state of Fe. The sur-face oxidation can also be changed by increasing the oxidation state. Forα-Fe2O3, the shake-up satellite peaks located at around 718.2 eV
were approximately 8 eV higher than that of Fe 2p3/2 peak, whereas the satellite peak for FeO was approximately 6 eV from Fe 2p3/2peak.
There is no satellite peak observed for Fe3O4[56,58].
A. E. Bocquet et al.[39]used a p-d charge-transfer cluster-model calculation to interpret the Fe 2p core levels. They defined the charge transfer energyΔeffwith respect to the lowest multiplet levels of the
d4and d5L configurations and showed that the charge transfer energy
Δeffis negative. They presented that the shape of the satellite can be
used to detect the oxidation state of Fe. For the Fe 2p core-levels XPS spectra, strong satellite features were observed for the d5
com-pounds with an apparently weaker satellite present for SrFeO3.
Simi-larly, the spectrum for SrFeO3was primarily composed of main peaks
due to the screened cd5L states and satellite structure from mixed cd4
and cd6L2states[59].
The XPS spectra of Ti 2p was also deconvoluted with a pair of peaks at 457.3 eV and 462.8 eV that attributed to Ti 2p 3/2 and Ti 2p 1/2 respectively and they are separated from each other by 5.7 eV. The XPS studies have also shown that titanium was involved in this compound as (+ 4) oxidation state.
3.4. UPS studies
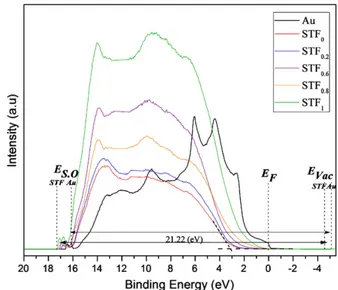
Valence band UPS and core level XPS experiments were per-formed using He I (21.22) eV and Al Kα (1486.6) eV photon lines. Binding energies were calibrated by measuring the Fermi step posi-tion and the Au 4f 7/2 core level of a clean goldfilm. The determina-tion of the posidetermina-tion of the valence band (EVB) from the UPS data was
done by using the intersection of the linear extrapolation of the lead-ing edge of the EVBspectrum with the base line. The relationship
be-tween the energy levels (EVB, EF, and Evac) and the UPS spectrum of
STFxand Au are shown inFig. 8. Thefigure shows the scale of binding
energy with the Fermi level of Au set at 0 V. The vacuum level (Evac)
should be located at 21.22 eV above the cutoff energy of the spec-trum. The work functions of Au based on this definition were estimat-ed to be 5.1 eV, respectively. According to the UPS spectrum, the value of the valence band maximum (EVB) is located at 3.19 eV,
2.91 eV, 2.79 eV, 2.39 eV, 1.84 eV below the Fermi level (EB) (0 eV)
for x = 0, 0.2, 0.6, 0.8 and 1 respectively, determined byfitting a straight line into the leading edge. The secondary electron onset
(SO) on the left side of the spectra was measured between 16.4, 16.9 eV, and 17.2 eV for Au, STO and SFO respectively. The work func-tion of SrTiO3was calculated to be 4.32 (±0.1) eV by subtracting the
secondary electron onset position of the He I UPS spectra from the ex-citation energy (21.2 eV)[60–65].
A. Rothschild et.al[65,66]reported that with increasing Fe dopant the UPS spectra, in the range of low binding energies (b25 eV), showed that the valence band of STFxis broader than that for SrTiO3
and extended closer to the conduction band edge, which corre-sponded to the reduction in the band-gap energy of these composi-tions[65,66].Table 3presents the analyzed data and results of UPS measurement.
4. Conclusions
The SrTi(1− x)Fe(x)O(3− δ)(STFx) powders for photo catalyst
appli-cation have been prepared by the high temperature solid state pro-cess. The XRD pattern indicated that a single cubic perovskite phase of STFxpowders with x varying from 0 to 1 was successfully
synthe-sized after calcination at 1200 °C for 24 h. The lattice parameter of STFx calculated from XRD, were in the range of 3.8601 (Å) for
STFx = 0and 3.9083 (Å) for STFx = 1. The local electronic structure of
SrFexTi(1− x)O3(0≤x≤1.0) investigated by XANES showed a
depen-dence on composition as well as on iron oxidation state. The pedge features of the X-ray absorption near pedge structure (XANES) re-gion and local symmetry of iron (titanium) was successfully studied. XPS results showed that Sr ions were in 2+ oxidation state and the ex-istence of SrCO3on the surface of samples in addition to SrO(1− x)on the
surface of STFx = 1was observed. Moreover, the analysis showed that
iron in STFxperovskite structure participated as a mixture of Fe3+and
Fe4+(SrTi
(1− x)[Fe3+, Fe4+](x)O(3− δ)). With increasing Fe content, the
amount of Fe3+ and Fe4+ increases significantly resulting in the for-mation of the oxygen vacancy. Consequently, with increasing oxygen vacancy, the amount of oxygen lattice would reduce. The valence
Table 2
Atomic concentrations calculated from XPS results for STF powders with x = 0 ~ 1. Elements Sample Atomic concentrations (%) for SrTi(1− x)Fe(x)O(3− δ)@
different x
x = 0 x = 0.2 x = 0.4 x = 0.6 x = 0.8 x = 1 Binding energy (eV)
Fe 2p a (Fe3+ ) 710.1 0 1.34 1.96 3.46 5.02 5.36 Fe 2p b (Fe4+ ) 711.8 0 0.47 0.79 1.69 3.87 4.19 Fe Satt 718.2 0 0.249 0.14 0.27 0.19 0.33 O 1s a 529 20.61 11.3 9.8 5.15 2.82 1.62 O 1s b 531.2 12.45 18.3 19.23 20.16 20.85 23.74 O 1s c 532.9 1.4 2.1 1.83 2.15 2.83 1.6 Ti 2p (Ti4+ ) 457.3 5.31 5.42 5.03 3.7 2.24 0 C 1s a 285 14.85 29.45 37.1 36.7 38.9 40.03 C 1s b 286.1 29.96 18.74 5.7 10.69 4.8 5.8 C 1s c 289.1 1.79 2.22 5 3.45 5.07 3.9 Sr 3d a 130.8 0 0 0 0 0 0.58 Sr 3d b 131.9 0 0 7.44 7 5.03 5.6 Sr 3d c 133.8 13.7 10.48 6.04 5.58 8.39 7.26 Total - 100.0 100.0 100.07 100.0 100.0 100.0 Elements Ratio Ti/Fe - 0 2.65 1.75 0.67 0.25 0 Fe+ 3 /Fe+ 4 - 0 2.83 2.48 2.05 1.31 1.28
Fig. 8. Ultraviolet photoelectron spectra (He I) for the surface of SrTi(1− x)Fe(x)O(3− δ).
Table 3
The analyzed data and results of UPS measurement. x in STFx EVB[with respect to
Fermi level] (eV)
ESO(eV) EVac(eV) EVB[with respect
to EVac] (eV) 0 3.19 16.4 −4.8 −7.79 0.2 2.91 16.48 −4.7 −7.63 0.6 2.79 16.71 −4.5 −7.28 0.8 2.39 16.8 −4.4 −6.79 1 1.84 16.9 −4.3 −6.14
band positions of STF were determined by UPS. The value of SrTiO3
va-lence band position (EVB) was reasonably consistent with the results of
previous reported works. Moreover, the change in the band positions of UPS analysis was in good agreement with the modeling data reported by A. Rothschild and et.al[65,66]. UPS results further showed that the Fermi level in the Fe-doped samples was located at 4.82 (±0.1) (for STFx = 1)–4.32 (±0.1) (for STFx = 0) eV which is below the EVac.
References
[1] M.A. Peña, J.L.G. Fierro, Chem. Rev. 101 (2001) 1981.
[2] L. Tejuca, J. Fierro, Properties and Applications of Perovskite-type Oxides, CRC, 1993.
[3] M.S. Wrighton, A.B. Ellis, P.T. Wolczanski, D.L. Morse, H.B. Abrahamson, D.S. Ginley, J. Am. Chem. Soc. 98 (1976) 2774.
[4] J. Fernandes, D. Melo, L. Zinner, C. Salustiano, Z. Silva, A. Martinelli, M. Cerqueira, C. Alves Junior, E. Longo, M. Bernardi, Mater. Lett. 53 (2002) 122.
[5] X. Niu, H. Li, G. Liu, J. Mol. Catal. A: Chem. 232 (2005) 89.
[6] M. Ghaffari, P.Y. Tan, M.E. Oruc, O.K. Tan, M.S. Tse, M. Shannon, Catal. Today 161 (2011) 70.
[7] N. Minh, Solid State Ionics 174 (2004) 271.
[8] N. Keller, J. Mistrík, S. Visnovský, D. Schmool, Y. Dumont, P. Renaudin, M. Guyot, R. Krishnan, Eur. Phys. J. B 21 (2001) 67.
[9] N. Kojima, K. Tsushima, Low Temp. Phys. 28 (2002) 480.
[10] H. Sakakima, M. Satomi, E. Hirota, H. Adachi, IEEE Trans. Magn. 35 (2002) 2958. [11] C. Alcock, R. Doshi, Y. Shen, Solid State Ionics 51 (1992) 281.
[12] R. Eglitis, S. Piskunov, E. Heifets, E. Kotomin, G. Borstel, Ceram. Int. 30 (2004) 1989. [13] L.H. Brixner, Mater. Res. Bull. 3 (1968) 299.
[14] K. Sahner, D. Schonauer, R. Moos, M. Matam, M. Post, J. Mater. Sci. 41 (2010). [15] W. Menesklou, H.-J. Schreiner, K.H. Härdtl, E. Ivers-Tiffée, Sens. Actuators, B 59
(1999) 184.
[16] S. Steinsvik, R. Bugge, J.O.N. GjØNnes, J. TaftØ, T. Norby, J. Phys. Chem. Solids 58 (1997) 969.
[17] K. Sahner, R. Moos, M. Matam, J.J. Tunney, M. Post, Sens. Actuators, B 108 (2005) 102. [18] S.J. Skinner, J.A. Kilner, Mater. Today 6 (2003) 30.
[19] J.R. Jurado, F.M. Figueiredo, B. Gharbage, J.R. Frade, Solid State Ionics 118 (1999) 89. [20] V. Varadan, D. Ghodgaonkar, V. Varadan, J. Kelly, P. Glikerdas, Microw. J. 35
(1992) 116.
[21] A. Verma, A. Kumar, S. Bhardwaj, Phys. Status Solidi B 245 (2008) 1520. [22] L.B. McCusker, R.B. Von Dreele, D.E. Cox, D. Louer, P. Scardi, J. Appl. Crystallogr. 32
(1999) 36.
[23] I. Bersuker, I.B. Bersuker, The Jahn–Teller Effect, Cambridge Univ Pr, 2006. [24] A. Millis, B.I. Shraiman, R. Mueller, Phys. Rev. Lett. 77 (1996) 175.
[25] M. Abbate, F. De Groot, J. Fuggle, A. Fujimori, O. Strebel, F. Lopez, M. Domke, G. Kaindl, G. Sawatzky, M. Takano, Phys. Rev. B 46 (1992) 4511.
[26] O. Haas, F. Holzer, S. Müller, J. McBreen, X. Yang, X. Sun, M. Balasubramanian, Electrochim. Acta 47 (2002) 3211.
[27] I.R. Shein, V.L. Kozhevnikov, A.L. Ivanovskii, J. Phys. Chem. Solids 67 (2006) 1436. [28] V. Kriventsov, D. Kochubey, Z. Ismagilov, O. Podyacheva, A. Nemudry, Phys. Scr.
2005 (2005) 740.
[29] Y. Joly, D. Cabaret, H. Renevier, C. Natoli, Phys. Rev. Lett. 82 (1999) 2398. [30] R. Vedrinskii, V. Kraizman, A. Novakovich, P. Demekhin, S. Urazhdin, J. Phys. Condens.
Matter 10 (1998) 9561.
[31] T. Yamamoto, T. Mizoguchi, I. Tanaka, Phys. Rev. B 71 (2005) 245113. [32] D. Cabaret, B. Couzinet, A. Flank, J. Itie, P. Lagarde, A. Polian, XAFS 13 (882) (2007)
120.
[33] M. Vracar, A. Kuzmin, R. Merkle, J. Purans, E. Kotomin, J. Maier, O. Mathon, Phys. Rev. B: Condens. Matter 76 (2007) 174107-174107.
[34] M. Belli, A. Scafati, Solid State Commun. 35 (1980) 355.
[35] F. Bridges, C.H. Booth, M. Anderson, G.H. Kwei, J.J. Neumeier, J. Snyder, J. Mitchell, J.S. Gardner, E. Brosha, Phys. Rev. B 63 (2001) 214405.
[36] V.P. Zakaznova-Herzog, H.W. Nesbitt, G.M. Bancroft, J.S. Tse, Surf. Sci. 600 (2006) 3175.
[37] D.A. Shirley, Phys. Rev. B 5 (1972) 4709.
[38] D. Briggs, M. Seah, Practical surface analysis by Auger and X-ray photoelectron spectroscopy, in: D. Briggs, M.P. Seah (Eds.), John Wiley & Sons, Chichester, 1983, xiv+ 533 (1983).
[39] B. Löchel, H. Strehblow, M. Sakashita, J. Electrochem. Soc. 131 (1984) 522. [40] C. Wagner, D. Zatko, R. Raymond, Anal. Chem. 52 (1980) 1445. [41] Q. Wu, M. Liu, W. Jaegermann, Mater. Lett. 59 (2005) 1480. [42] N. Batis, P. Delichere, H. Batis, Appl. Catal. Gen. 282 (2005) 173.
[43] D. Fino, N. Russo, E. Cauda, G. Saracco, V. Specchia, Catal. Today 114 (2006) 31. [44] S.M. Lima, J.M. Assaf, M.A. Peña, J.L.G. Fierro, Appl. Catal. Gen. 311 (2006) 94. [45] B. Liu, Y. Zhang, L. Tang, Int. J. Hydrogen Energy 34 (2009) 435.
[46] N. Merino, B. Barbero, P. Eloy, L. Cadús, Appl. Surf. Sci. 253 (2006) 1489. [47] S. Petrovic, L. Karanovic, P. Stefanov, M. Zdujic, A. Terlecki-Baricevic, Appl. Catal.,
B 58 (2005) 133.
[48] M. Sosulnikov, Y. Teterin, J. Electron Spectrosc. Relat. Phenom. 59 (1992) 111. [49] R. Vasquez, J. Electron Spectrosc. Relat. Phenom. 56 (1991) 217.
[50] A. Yan, V. Maragou, A. Arico, M. Cheng, P. Tsiakaras, Appl. Catal., B 76 (2007) 320. [51] V. Young, T. Otagawa, Appl. Surf. Sci. 20 (1985) 228.
[52] R. Vasquez, Surf. Sci. Spectra 1 (1992) 112.
[53] M. Machkova, N. Brashkova, P. Ivanov, J. Carda, V. Kozhukharov, Appl. Surf. Sci. 119 (1997) 127.
[54] R. Polini, A. Falsetti, E. Traversa, O. Schäf, P. Knauth, J. Eur. Ceram. Soc. 27 (2007) 4291.
[55] A.E. Bocquet, A. Fujimori, T. Mizokawa, T. Saitoh, H. Namatame, S. Suga, N. Kimizuka, Y. Takeda, M. Takano, Phys. Rev. B 45 (1992) 1561.
[56] R.J. Lad, V.E. Henrich, Surf. Sci. 193 (1988) 81. [57] P. Mills, J. Sullivan, J. Phys. D: Appl. Phys. 16 (1983) 723.
[58] H. Yamashita, Y. Ichihashi, M. Takeuchi, S. Kishiguchi, M. Anpo, J. Synchrotron Radiat. 6 (1999) 451.
[59] A.E. Bocquet, A. Fujimori, T. Mizokawa, T. Saitoh, H. Namatame, S. Suga, N. Kimizuka, Y. Takeda, M. Takano, Phys. Rev. B 45 (1992) 1561.
[60] F. Amy, A. Wan, A. Kahn, F. Walker, R. Mckee, J. Appl. Phys. 96 (2004) 1635. [61] D. Cahen, G. Hodes, M. Gratzel, J. Guillemoless, I. Riess, J. Phys. Chem. B 104
(2000) 2053.
[62] W.-J. Chun, A. Ishikawa, H. Fujisawa, T. Takata, J.N. Kondo, M. Hara, M. Kawai, Y. Matsumoto, K. Domen, J. Phys. Chem. B 107 (2003) 1798.
[63] G. Liu, W. Jaegermann, J. He, V. Sundström, L. Sun, J. Phys. Chem. B 106 (2002) 5814.
[64] J. Robertson, J. Vac. Sci. Technol., B 18 (2000) 1785.
[65] A. Rothschild, W. Menesklou, H.L. Tuller, E. Ivers-Tiffée, Chem. Mater. 18 (2006) 3651.
[66] A. Rothschild, S.J. Litzelman, H.L. Tuller, W. Menesklou, T. Schneider, E. Ivers-Tiffée, Sens. Actuators, B 108 (2005) 223.