Journal of Clinical and Analytical Medicine |
r
A a
l
þ
a
t
n
ý
i
r
j
m
ir
a
O
O
h
r
c
i
r
g
a
in
e
s
e R
l
a
1 Gülizar Demirok1, Ahmet Gül2, Erol Turaçlı1, Sertaç Öztürk1, Ahmet Şengün1 1Eye Deparment, 2Psychiatric Clinic, Ufuk University, Faculty of Medicine, Dr Rıdvan Ege Hospital, Ankara, TurkeyA Tipi Kişiliklerde OKT Bulguları / OCT Findings of Type A Behavior Pattern
Choroidal and Ganglion Cell Complex Thicknesses in Subjects with
Type A Behavior Pattern: An Optical Coherence Tomography Study
A Tipi Kişilik Yapısına Sahip Bireylerde Koroid ve Ganglion Hücre
Kompleks Kalınlıkları: Optik Koherens Tomografi Çalışması
DOI: 10.4328/JCAM.3253 Received: 21.01.2015 Accepted: 08.02.2015 Published Online: 08.02.2015
Corresponding Author: Gülizar Demirok, Kızılırmak Street. 1425. Avenue. Hayat Sebla Apartment Number 30/37, Çukurambar, Ankara, Turkey. T.: +90 3122044000 F.: +90 3122041212 E-Mail address: [email protected]
Özet
Amaç: A tipi kişilik (ATK) yapısına sahip bireylerde spektral domain optik koherens tomografi (SD-OKT) ile koroid kalınlıkları (KK) ve ganglion hücre kompleks (GHK) kalınlıklarının değerlendirilmesi amaçlandı. Gereç ve Yöntem: Otuzsekiz sağlıklı kontrolün 38 gözü ile 38 ATK hastasının 38 gözü çalışma-ya alındı. Her katılımcıçalışma-ya SD-OKT çekimi öncesi kapsamlı oftalmik muaye-ne yapıldı. Koroid kalınlıkları fovea merkezinde (subfoveal) ve foveaya 1500 µm temporalde (T1,T2,T3) ve nazalde (N1,N2,N3) 500 µm aralıklarla Enhan-ced Depth Imaging (EDI ) modu ile manuel olarak ölçüldü. GHK kalınlıkları ise otomatik olarak minimum ve ortalama kalınlıklar şeklinde değerlendirildi. Pa-rametreler gruplar arasında kıyaslandı. Bulgular: ATK grubunda yaş ortala-ması 38.7±13.8 yıl, kontrol grubunda yaş ortalaortala-ması 40.3±11.5 yıl idi. Grup-lar arasında ortalama yaş, cinsiyet dağılımı, göziçi basınçGrup-ları ve sferik ekiva-lanları açısından fark yoktu (p>0.05). Ortalama koroid kalınlıkları her 7 nokta için (subfoveal, N1, N2, N3, T1, T2, T3) ATK grubunda sırasıyla 325.4±45.1, 301.3±39.4, 284.6±35.2, 269.5±41.9, 293.2±40.7, 274.5±43.8, 260.5±44.3 µm idi. Kontrol grubunun KK ortalamaları ise sırasıyla 322.9±27.9, 301.8±33.2, 288.5±35.0, 278.1±33.4, 297.2±31.5, 285.1±33.0, 271.4±39.5 µm idi. Gruplar arasında her 7 nokta için KK ölçümleri arasında anlamlı fark yoktu (p>0.05). ATK grubunda GHK ortalaması ve minimum değerleri sırasıy-la 82.2±5.3 µm ve 79.0±6.4 µm idi. Kontrol grubunun değerleri ise sırasıysırasıy-la 86.3±7.2µm ve 83.5±6.0 µm idi. Gruplar arasında ortalama ve minimum GHK kalınlıkları açısından istatistiksel olarak anlamlı fark vardı (p>0.05). Tartış-ma: KK açısından gruplar arasında fark saptanmamasına rağmen; ortalama ve minimum GHK kalınlık değerleri A tipi kişilikli hastalarda kontrol grubuna göre istatistiksel olarak düşük bulunmuştur. ATK; ganglion hücre kalınlığında azalma ile birliktelik gösterebilir.
Anahtar Kelimeler
Koroid Kalınlığı; Ganglion Hücre Kompleksi; A Tipi Kişilik; EDI Mod SD-OKT
Abstract
Aim: To evaluate choroidal thickness (CT) and ganglion cell complex (GCC) thickness with spectral domain optical coherence tomography (SD-OCT) in subjects with type A behavior pattern (TABP). Material and Method: Thirty-eight eyes of 38 healthy controls and 38 eyes of 38 patients with TABP were enrolled. Each subject underwent a complete ophthalmic examination before SD-OCT images were obtained. Choroidal thicknesses were measured manu-ally at the central of fovea (subfoveal) and 500 µm intervals up to 1500 µm temporal (T1, T2, T3) and nasal (N1, N2, N3) to the fovea with Enhanced Depth Imaging (EDI ) mode. GCC thickness was evaluated automatically as the minimum and the average thicknesses. Parameters were compared be-tween the groups. Results: The mean ages were 38.7±13.8 years in TABP group, and 40.3±11.5 years in control group. There were no significant dif-ferences in mean age, gender distribution, intraocular pressure and spherical equivalent between the groups (p>0.05). The mean (±SD) CT for each of the 7 points (subfoveal, N1, N2, N3, T1, T2, T3) in TABP group were 325.4±45.1, 301.3±39.4, 284.6±35.2, 269.5±41.9, 293.2±40.7, 274.5±43.8, 260.5±44.3 µm, respectively. CT values in control group were 322.9±27.9, 301.8±33.2, 288.5±35.0, 278.1±33.4, 297.2±31.5, 285.1±33.0, 271.4±39.5 µm, respec-tively. There was no significant differences in CT for all 7 points between the groups (p>0,05). The mean and minimum GCC thicknesses in TABP group were 82.2±5.3 µm and 79.0±6.4 µm, respectively. Corresponding values in control group were 86.3±7.2 µm and 83.5±6.0 µm, respectively. There were significant differences in mean and minimum GCC thicknesses between the groups (p>0,05). Discussion: Although no detectable difference between the groups in terms of CT, the mean and minimum GCC thickness values of TABP patients were statistically lower than control group. TABP may be accompa-nied with a decrease of ganglion cell thickness.
Keywords
Choroidal Thickness, Ganglion Cell Complex, Type A Behavior Pattern, EDI Mode SD-OCT
| Journal of Clinical and Analytical Medicine
A Tipi Kişiliklerde OKT Bulguları / OCT Findings of Type A Behavior Pattern
2
Introduction
The Type A and Type B personality theory describes two com-mon, contrasting personality types ¬-the high-strung Type A and the easy-going Type B- as patterns of behavior that could either raise or lower, respectively, one’s chances of developing coronary heart disease [1]. Since researchers started studying type A behavior pattern (TABP) over 50 years ago, it has be-come an important topic due to its effects on human health. The negative effects such as hypertension, heart disease, job stress and social isolation of TABP have been revealed by sever-al studies [2,3]. However it’s not understood exactly which traits constitute TABP or how these traits impact health even today. In addition, studies have found that people with TABP who are under a great deal of stress are more likely to develop central serous chorioretinopathy (CSC) which is a bullous elevation of the retina secondary to the accumulation of sub-retinal serous fluid [4]. The choroid has been shown to be abnormally thick in CSC and increased thickness was likely because of the cho-roidal vascular dilatation [5]. There is no study evaluating the choroidal thickness (CT) in TABP, which is a risk factor for CSC, in the published literature.
Bubella et al. [6] found that the prevalence of TABP subjects proved to be extremely high (64%) in their open-angle glauco-ma (OAG) patients. Subjects with TABP presented a higher level of perimetric damage and greater intraocular pressure fluctua-tions in tonometric curve. They suggested a role of TABP played by stress in the pathogenesis and evolution of OAG.. Also Padhy et al. [7] recently reported that the damage of ganglion cell complex (GCC) may be detected with optical coherence tomog-raphy before the occurrence of visual field defect in glaucoma. In our study, we aimed to assess and compare the thicknesses of central fovea, choroidea and ganglion cell complex between TABP and healthy individuals, in order to find out if there is an alteration in eyes of subjects with TABP before development of diseases such as glaucoma and CSC.
Material And Method
This prospective, comparative study was approved by the Ethi-cal Review Committee of Ufuk University and adhered to the provisions of the Declaration of Helsinki for research involving human subjects. Written informed consent was obtained from all the participants involved in the study. One eye of patients with TABP and healthy subjects were included in the study. Eli-gibility criteria for both groups were as follows: 18 years of age or older, eyes considered as normal after detailed examination with biomicroscopy, funduscopy and optical coherence tomog-raphy (OCT). Exclusion criteria for both groups included eyes with known ocular diseases such as glaucoma, uveitis, diabetic retinopathy, history of previous surgery or injection; eyes with refractive errors of 6 D or more as spherical equivalent. Subjects with TABP were referred from psychiatry clinic after psychological tests were performed and validated by the same physician (AG). Clinical findings were used to determine the dis-ease and ERCTA-an interview scale was used to confirm the diagnosis [8]. Normal subjects were asked the questions (in our language) of type A/B personality questionnare (version modi-fied by Jenkins Activity Survey) in ophthalmology department to eliminate an undiagnosed TABP. All eyes underwent a
thor-ough ophthalmic evaluation, including slit-lamp biomicroscopy, fundus examination. OCT (Cirrus OCT,Carl Zeiss Meditec, Inc., Dublin,CA) measurements were performed at the same time pe-riod (morning from 9 am to 11 am) to avoid the diurnal varia-tion of CT measurement. The protocol of HD 5 Line Raster scan with Enhanced Depth Imaging (EDI) mode was used to evaluate the choroid. This protocol consisted of 6-mm parallel lines with 1024 A-scans/B-scans and averaging 5 B-scans per image. CT values were measured by two observers who were blind to each other. The correlation of CT values obtained from observer 1 and observer 2 was evaluated.
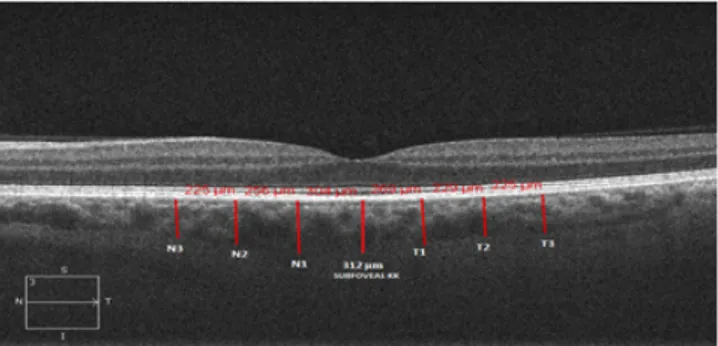
Subfoveal CT was determined from the outer edge of the hyper-reflective RPE to inner
sclera centered on the fovea by the observer manually (Figure 1). CT was measured at 500 µm intervals up to 1500 µm
tempo-ral and nasal to the foveola, so measurements were taken from a total of 7 points. As the central measurement was considered as subfoveal, consecutive measurements were considered as N1, N2, N3 for the nasal and T1, T2, T3 for temporal points located at 500 µm, 1000 µm, 1500 µm away from the fovea respectively. For both groups, the eye with the best visualization of the border between the choroid and sclera, the choroidal-scleral interface (CSI), was used.
Macula 200X200 acquisition protocol was used to view the macula and the ganglion cell analysis (GCA) algorithm (Cirrus OCT, Carl Zeiss Meditec, Inc., Dublin,CA) was used to detect the macular ganglion cell-inner plexiform layer (GCIPL) thickness. The average and minimum GCIPL values were used for analysis. Statistical analysis
All statistical analyses were performed with SPSS (Statistical Package for Social Sciences) 17 for Windows. The values are presented as mean±SD. Kolmogorov-Smirnov test was used for the determine the normal distribution. Parametric Student-t test was used for comparison variables. For all tests, p<0.05 was considered to be significant.
Results
One eye of 38 TABP patients and 38 normal subjects, serving as the control group, were included in this study. The mean ages of the TABP patients and the healthy control group were 38.7±13.8 (mean±SD) and 40.3±11.5 (mean±SD) years, respectively. Gen-der distribution was as follows: 26 (68.4%) men and 12 (31.6%) women in TABP group, 22 (57.9%) men and 16 (42.1%) women Figure 1.Choroidal thickness measurement in optical coherence tomography, cen-tral measurement was considered as subfoveal, consecutive mesurements were considered as N1, N2, N3, T1,T2,T3 at intervals of 500 µm.
| Journal of Clinical and Analytical Medicine
A Tipi Kişiliklerde OKT Bulguları / OCT Findings of Type A Behavior Pattern
3
in control group. The mean spherical equivalent refractive er-rors were -0.76±3.2 diopters in TABP group and -1.05±2.2 di-opters in the control group. The mean ocular pressures were 17.1±2.2 mmHg in the TABP group and 16.5±2.5 mmHg in the control group. There were no significant differences in mean age, sex distribution, ocular pressure or refractive errors be-tween the groups . The mean central foveal thicknesses (CFT) were 250.4±22.8 µm and 251.1±20.6 µm, respectively. No dif-ference was found between the groups for CFT (p=0.871). The mean (±SD) CT of the 7 points calculated in TABP group and control group were shown on Table 1, and there were no significant differences in CT for all 7 points between the groups (p>0,05).
The choroid was thickest underneath the fovea and thickness
was gradually decreased with distance from the foveola in both groups. CT was correlated with age in all participants for each of the seven locations (subfoveal,N1,N2,N3,T1,T2,T3) (p<0.05). Subfoveal choroidal thickness had a moderate negative correla-tion with age (r=-0,56; p= 0,023). Other regions showed weaker negative correlation.
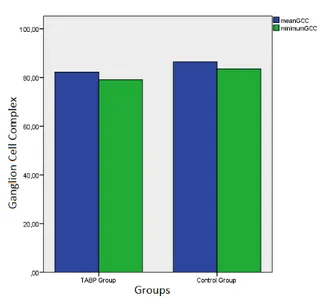
The mean and minimum GCC thicknesses in TABP group were 82.2±5.3 µm and 79.0±6.4 µm, respectively. Corresponding values in control group were 86.3±7.2 µm and 83.5±6.0 µm, respectively. There were a significant differences in mean and minimum GCC thicknesses between the two groups (p<0,05) (Figure 2).
The mean and minimum GCC thicknesses were not correlated with age, gender and ocular pressure in both groups. There was no significant correlation between GCC thickness and CT for all calculated points in both groups.
Discussion
Type A behavior pattern is characterized by extremes of com-petitiveness and impatience, a chronic sense of urgency, ag-gressive drive, and easily evoked hostility [9]. Evidence from laboratory studies has largely supported the hypothesized physiological hyper-reactivity of Type A individuals and the re-sults showed that type A individuals tend to exhibit high anxiety and stress levels [10,11]. Extra stress adversely affects human health and lifesyle and the link between the TABP and some diseases such as hypertension, coronary heart disease and CSC was confirmed with several studies [4,12,13,14].
The pathogenesis of CSC is still partly understood, however
nu-merous hypotheses have been suggested and the choroidal vas-cular hyperpermeability was emphasized to be the major expla-nation [15]. It was found that the choroidal thickness increased in CSC patients and decreased as a treatment response to photodynamic therapy [16,17,18,19]. Therefore, evaluating the choroidal structures is critical for understanding the abnormali-ties associated with CSC. Based on the relationship between the CSC and TABP, we examined the choroidal thickness in type A individuals. In our study there was no difference between the groups in terms of choroidal thickness. This finding led us to think that choroidal thickening, as seen by OCT in CSC pa-tients, may be observed after the development of the disease. Increase in choroidal thickness associated with CSC may be a consequence of the choroidal hyperpermeability rather than an etiological factor.
We found that the choroid becomes thinner as the distance from the fovea increases both in controls and in patients with TABP. This data confirms recently published studies showing the same thickness pattern using different SD-OCTs [20,21,22]. Ad-ditionally, we found that the choroidal thickness decreased with increased age in both groups. Similarly, Manjunath et al. [21] noted a negative correlation between the CT and age in normal eyes, suggesting that progressive choroidal thinning has been occured over time. Also, Vujosevic et al. [23] found a significant decrease of CT with increasing age of patients both with dia-betes and in their control group.
Stress may lead to an increased of catecholamine secretion, consequential vasoconstriction and increase in vascular resis-tance trigger a rise in blood pressure level. Since catecholamine receptors exist within the ophthalmic artery, vasoconstriction may lead to an adverse effect in blood supply of the optic nerve in TABP. Bubella et al. [6] have observed that the subjects who have type A behavior showed more significant involvement in visual field (VF) compared to subjects who don’t have TABP in a group of open-angle glaucoma patients. Glaucoma is character-ized by optic nerve head cupping and associated VF loss, how-ever the underlying disease is ganglion cell loss [24]. VF defects may not be observed in the early stages of the disease as it has been found that approximately 40% loss of nerve fiber layer oc-Table 1. Mean Choroidal Thicknesses at each of the 7 locations in TABP and
Control Group
Choroidal Thickness TABP Group
mean±SD Control Group mean±SD P values Subfoveal CT (µm) 325.4±45.1 322.9±27.9 0.772 N1 (µm) 301.3±39.4 301.8±33.2 0.953 N2 (µm) 284.6±35.2 288.5±35.0 0.633 N3 (µm) 269.5±41.9 278.1±33.4 0.331 T1 (µm) 293.2±40.7 297.2±31.5 0.632 T2 (µm) 274.5±43.8 285.1±33.0 0.241 T3 (µm) 260.5±44.3 271.4±39.5 0.262
CT, Choroidal thickness; N1, 500 µm nasal to fovea; N2, 1000 µm nasal to fo-vea; N3, 1500 µm nasal to fofo-vea; T1, 500 µm temporal to fofo-vea; T2, 1000 µm nasal to fovea; T3, 1500 µm temporal to fovea; TABP, Type A behavior pattern
Figure 2. GCC thickness comparison between the groups
| Journal of Clinical and Analytical Medicine
A Tipi Kişiliklerde OKT Bulguları / OCT Findings of Type A Behavior Pattern
4
cur before detectable VF defects emerge [25]. Nowadays these changes can be detected with SD-OCT at earlier stages. In our study, GCC thickness was lower in TABP patients than in control group. TABP, which is an accepted risk factor for CSC may be also associated with a reduction of ganglion cell layer. Similarly Bubella et al. have reported that mean TSNIT (temporal, supe-rior, nasal, infesupe-rior, temporal) was lower in subjects with type A personality compared to patients with type B personality. We think that our data about ganglion cell layer thinning in TABP may contribute to the findings of Bubella et al. in terms of lower nerve fiber layer thickness. The presence of this personality dis-order may be questioned in patients with glaucoma especially in whom ganglion cell damage has been demonstrated despite treatment. We think that the treatment of accompanying TABP may have a positive influence in the course of glaucoma pos-sibly due to reduced negative effects of stress on optic nerve head and retinal microcirculation. At the same time our study shows that TABP may adversely affect the retinal ganglion cell layer thickness in healthy eyes with an unknown pathophysi-ology probably thorough vascular factor such as hypertension, atherosclerosis and nutrition of the optic nerve.
The limitations of the current study are; there was no auto-mated software generally available for measurements for cho-roidal thickness and the sample size of each group was small. However, there was a good interobserver correlation in manual measurements. Further studies with larger groups are needed to explore the possible effect of TABP on the eye.
Çıkar Çakışması ve Finansman Beyanı
Bu çalışmada çıkar çakışması ve finansman destek alındığı bey-an edilmemiştir.
References
1. Friedman M. Type A Behavior: Its Diagnosis and Treatment. In: Thomas PG, edi-tor. An overview of Types A and B Behavior. Newyork: Plenum Press; 1996.p.3-25. 2. Gohar J, Haque A, Namawar A, Jamil M. “ Personality traits and heart disease in the Middle East”. Is there a link?. Am J Cardiovasc Dis 2013;3(3):163-9. 3. Holmes SD, Krantz DS, Rogers H, Gottdiener J, Contrada RJ. Mental stress and coronary artery disease: a multidisciplinary guide. Prog Cardiovasc Dis 2006;49(2):106-22.
4. Yanuzzi LA. Type A behaviour and central serous chorioretinopathy. Retina 1987;7(2):111-31.
5. Kuroda S, Ikuno Y, Yasuno Y, Nakai K, Usui S, Sawa M, et al. Choroidal thickness in central serous chorioretinopathy. Retina 2013;33(2):302-8.
6. Bubella RM, Bubella DM, Cillino S. Type A behavior pattern: Is it a risk factor for open-angle chronic glaucoma?. J Glaucoma 2014;23(4):199-201.
7. Padhy D, Rao A. Macular ganglion cell/inner plexiform layer measurements by spectral domain optical coherence tomography for detection of early glaucoma and comparison to retinal nevre fiber layer measurements. Am J Ophthalmol 2014;158(1):211.
8. Sutil CR, Corbacho PG, Arias RM, Alvarez MG, Requero EP. Type A behavior with Ercta scale in normal subjects and coronary patients. Psychology in Spain 1998;2(1):43-7.
9. Chesney MA, Rosenman R. Type A behavior in the work setting. In: Cooper CL, Payne R, editors. Current Concerns in Occupational Stress. Newyork: Wiley; 1980.p.187-212
10. Houston BK. Psychophysiological responsivity and the Type A behavior pat-tern. J Res Personel 1983;17(1):22-39.
11. Harbin TJ. The relationship between the Type A behavior pattern and physi-ological responsivity: A quantitative review. Psychophysiology 1989;26(1):110-9. 12. Grossarth R, Eysenck HJ. Personality, stres and disease: Description and vali-dation of a new inventory. Psychological Reports 1990;66(2):355-73.
13. Haynes SG, Levine S, Scotch N, Feinleib M, Kannel WB. The relationship of psy-chosocial factors to coronary heart disease in the Framingham study I. Methods and risk factors. Am J Epidemiol 1978;107(5):362-83.
14. Matthews KA. Psychological perspectives on the type A behavior pattern. Psy-chological Bulletin 1982;91(2):293-323.
15. Nicholson B, Noble J, Forooghian F, Meyerle C. Central serous chorioretinopa-thy: update on pathophysiology and treatment. Surv Ophthalmol
2013;58(2):103-26.
16. Imamura Y, Fujiwara T, Margolis R, Spaide RF. Enhanced depth imaging optical coherence tomography of the choroid in central serous chorioretinopathy. Retina 2009;29(10):1469-73.
17. Maruko I, Iida T, Sugano Y, Ojima A, Ogasawara M, Spaide RF. Subfoveal cho-roidal thickness after treatment of central serous chorioretinopathy. Ophthalmol-ogy 2010;117(9):1792-9.
18. Maruko I, Iida T, Sugano Y, Furuta M, Sekiryu T. One-year choroidal thickness results after photodynamic therapy for central serous chorioretinopathy. Retina 2011;31(9):1921-7.
19. Maruko I, Iida T, Sugano Y, Ojima A, Sekiryu T. Subfoveal choroidal thick-ness in fellow eyes of patients with central serous chorioretinopathy. Retina 2011;31(8):1603-8.
20. Margolis R, Spaide RF. A pilot study of enhanced depth imaging opti-cal coherence tomography of the choroid in normal eyes. Am J Ophthalmol 2009;147(5):811-5.
21. Manjunath V, Taha M, Fujimoto JG, Duker JS. Choroidal thickness in normal eyes measured using Cirrus HD optical coherence tomography. Am J Ophthalmol 2010;150(3):325-9.
22. Regatieri CV, Branchini L, Fujimoto JG, Duker JS. Choroidal imaging using spec-tral-domain optical coherence tomography. Retina 2012;32(5):865-76. 23. Vujosevic S, Martini F, Cavarzeran F, Pilotto E, Midena E. Macular and peripap-illary choroidal thickness in diabetic patients. Retina 2012;32(9):1781-90. 24. Sommer A, Miller NR, Pollack I, Maumenee AE, George T. The nerve fiber layer in the diagnosis of glaucoma. Arch Ophthalmol 1977;95(12):2149-56.
25. Sommer A, Katz J, Quinley HA, Miller NR, Robin AL, Richter RC, et al. Clinically detectable nerve fiber atrophy precedes the onset of glaucomatous field loss. Arch Ophthalmol 1991;109(1):77-83.