Talha Erdem and Hilmi Volkan Demir*
Color-Enrichment Semiconductor
Nanocrystals for Biorhythm-Friendly
Backlighting
https://doi.org/10.1515/zpch-2018-1134
Received January 30, 2018; accepted February 5, 2018
Abstract: Nanocrystals (NCs) offer great opportunities for developing novel
light-emitting devices possessing superior properties such as high quality indoor lighting, efficient outdoor lighting, and display backlighting with increased color definition. The narrow-band emission spectra of these materials also offer opportunities to protect the human daily biological rhythm against the adverse effects of display backlighting. For this purpose, here we address this problem using color converting NCs and analyzed the effect of the NC integrated color con-verting light-emitting diode (NC LED) backlight spectra on the human circadian rhythm. We employed the three existing models including the circadian light, the melanopic sensitivity function, and the circadian effect factor by simultaneously satisfying the National Television Standards Committee (NTSC) requirements. The results show that NC LED backlighting exhibits (i) 33% less disruption on the circadian cycle if the same color gamut of the commercially available YAG:Ce LED is targeted and (ii) 34% wider color gamut while causing 4.1% weaker dis-ruption on the circadian rhythm compared to YAG:Ce LED backlight if the NTSC color gamut is fully reproduced. Furthermore, we found out that blue and green emission peaks have to be located at 465 with 30 nm bandwidth and at 535 nm with 20 nm bandwidth, respectively, for a circadian rhythm friendly design while the red component offers flexibility around the peak emission wavelength at 636 nm as opposed to the requirements of quality indoor lighting. These design
*Corresponding author: Hilmi Volkan Demir, Department of Electrical and Electronics
Engineer-ing, Department of Physics, and UNAM–Institute of Materials Science and Nanotechnology, Bilkent University, Ankara 06800, Turkey; and School of Electrical and Electronic Engineering, School of Physical and Mathematical Sciences, Nanyang Technological University, Singapore 639798, Singapore, e-mail: [email protected]
Talha Erdem: Department of Electrical and Electronics Engineering, Department of Physics, and
UNAM–Institute of Materials Science and Nanotechnology, Bilkent University, Ankara 06800, Turkey
considerations introduced as a new design perspective for the displays of future will help avoiding the disruption of the human circadian rhythm.
Keywords: biological rhythm; circadian rhythm; colloidal nanocrystals; display;
light-emitting diode; quantum dots.
1 Introduction
Current technology on nanocrystal (NC) based light-emitting devices utilizes their narrow-band emission to optimize the performance of the final system [1]. By fine-tuning the emission spectra specific to the intended application, high-quality and high-efficiency indoor and outdoor lighting applications have been demon-strated [2, 3] and broad color gamut in displays has been successfully shown [4]. In this work, we aim at utilizing the spectral tunability of NC based light-emitting devices for developing a backlight source that can minimize the adverse effects of the displays on the daily circadian rhythm of humans also known as the daily biological rhythm.
We address this problem because a balanced circadian rhythm plays a criti-cal role for human health [5]. For example, it is known that a regular day/night routine helps reducing seasonal affective disorder [6], increasing the concentra-tion of nightshift workers [7], and helping teenagers to start the day earlier [8]. Disruption of the regular daily rhythm, on the other hand, is linked to health problems including depression [9] and some cancer types [10]. Therefore, the human daily biorhythm (i.e. circadian rhythm) has to be considered while design-ing devices that have the capability to shift the biological clock.
The design of a circadian rhythm friendly display requires the fine tuning of the backlight spectrum which cannot be accomplished using broadband emitters like phosphors that are commonly used as the color converters in display back-lights [11]. Furthermore, their broad emission spectrum limits the color span of the display, which is not a desirable aspect for a display. On top of these, emerg-ing supply problems of the rare earth elements, which are the buildemerg-ing blocks of the color converting phosphors, have further raised questions for their sustainable use [12]. The multi-chip approach employing the integration of LED chips emit-ting different colors suffers mainly from the high cost and increased complexity of production. As a remedy to the problems, nanocrystal quantum dots that are narrow-band color converters step forward [13–15]. Their narrow-band emission and tunability of the emission color via material and size engineering allow for careful spectral design, which leads to the fine tuning of the backlight spectrum for various applications [16, 17] together with the broadening of the color span [18].
Since the current LED backlighting technology is far from circadian rhythm friendliness [19–22], adding the feature of circadian compatibility to the backlight spectrum in a systematic manner is an important but hitherto disregarded design problem. Current software-based solutions such as F.lux [23] and Redshift [24] try to solve this problem by adjusting the correlated color temperature of the back-light according to that of the sun depending on the location and time of the day. However, this method undesirably changes the colors produced by the display and its performance may change from display to display. Therefore, a system-atic approach starting from the design of the display backlighting is necessary to address the circadian rhythm friendliness problem without these issues. In this work, we aim to approach this problem by taking into account the dependence of our circadian rhythm to the spectrum of the light sources.
Our study relies on the discovery of a third photoreceptor in the human retina called the intrinsically photosensitive retinal ganglion cell (ipRGC) [25]. Differ-ent than their sister photoreceptors cones and rods, the main function of ipRGCs helps the suprachiasmatic nuclei to control the circadian cycle through mela-tonin secretion although rods and cones provide input to ipRGCs in the absence of melanopsin, though reduced [26, 27]. While the secretion of the melatonin occurs under dark ambiance through its interaction with suprachiasmatic nuclei to send the “night” signal to the body, it ceases upon the exposure of ipRGC to light at a sufficient level and duration. Hence, prolonged exposure to display backlights [28], whose spectra match the sensitivity curve of the ipRGCs, may severely affect the melatonin secretion during the night. Consequently, the cir-cadian cycle is affected in a delaying or advancing manner [5]. In 2011, Figueiro et al. [20] reported that the cathode ray tube computer screens cause a slightly suppressed melatonin secretion after 2 h of exposure in the night. Moreover, inclusion of the blue LED light of 40 lux was found to significantly decrease the melatonin concentration. Another study of the same group further reported that the use of tablets for 2 h before the sleep decreased the melatonin concentra-tion in the saliva by 23% [21]. Furthermore, an addiconcentra-tional blue light impinging on the eye was shown to suppress the melatonin concentration by 66%. In an independent study, Cajochen et al. [22] compared the effects of the LED and fluo-rescent backlighting on the circadian cycle. They found that the LED backlight-ing hinders and delays the melatonin secretion compared to a fluorescent lamp backlit display after 5 h of exposure in the night.
In the light of these findings and based on the models of Rea et al. [28], Enezi et al. [29], and Gall et al. [30], here we introduce the perspective of daily biorhythm friendliness to our colloidal nanocrystal quantum dot integrated LED (QD-LED) designs. The device we propose makes use of green and red QDs accompanied with a blue LED chip. Our findings elucidate a 33% weaker effect of the designed
QD-LEDs on the circadian rhythm when the color span provided by the QD-LED is the same as that of the YAG:Ce LED. Furthermore, if the quantum dots are selected correctly to realize the color coverage of National Television Standards Commit-tee (NTSC), the designed QD-LED backlight exhibits a 34% wider color gamut together with a 4.1% reduced effect on the circadian rhythm compared to YAG:Ce LED backlight. These findings show that QD-LEDs are excellent candidates for realizing these circadian rhythm friendly backlights thanks to the spectral tun-ability and purity of these nanocrystal quantum dots.
1.1 Computational methodology
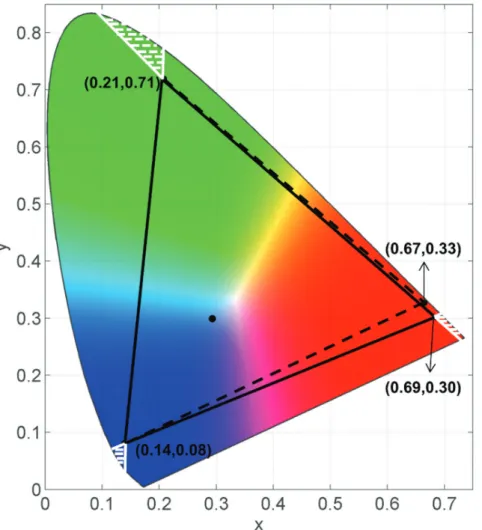
Our calculations constituted of two major steps. The first one is the determina-tion of the QDs, utilizing which NTSC standards can be satisfied (Figure 1) by
Fig. 1: National Television Standards Committee color gamut (dashed) along with the modified
color gamut (line) used in this study. The white dashed regions correspond to allowable chro-maticity points of individual color components to realize the targeted color gamut. The black dot in the middle shows the chromaticity point of the blackbody radiator at 9000 K.
considering the color filters used in LCDs. In our calculations, we modeled the emission of QDs and the pump blue LED using Gaussian functions and generated the spectrum of a three-color mixing backlight. The peak emission wavelength of the blue (short wavelength) component was varied between 400 and 495 nm with a 5 nm step. Similarly, the emission wavelengths of the green (middle wave-length) and red (long wavewave-length) components were varied between 500 and 595 nm (for the green) and 600–700 nm (for the red), again with 5 nm step sizes. Moreover, the bandwidth of the emission spectra was varied between 20 and 50 nm with 5 nm steps. It was found out that even a bandwidth of 20 nm of the red QDs cannot satisfy the NTSC condition for red, which is also the case for red LED chips. Therefore, we varied the red point condition by equating the chroma-ticity point of a regular red LED used for LCD backlighting. Also considering the effect of color filters, the red chromaticity point condition was moved to (0.6918, 0.3047). The resulting color gamut is represented in Figure 1 as continuous black lines while the chromaticity points of the allowed color components were shown as the white region on the same figure. The allowed color region indicates the blue, green and red chromaticity points that ensure the coverage of the targeted color gamut.
After the identification of the color components, which can be realized using QDs and satisfy the targeted color gamut conditions after passing the color filters, we design the white QD-LEDs suitable for a display using the requirements listed in Lumileds Application Note [31]. Accordingly, we set the correlated color
temper-ature (CCT) of the backlight to 9000 K and the luminance to 180 cd/m2 by finding
the required amplitudes of each color components using a supervised learning algorithm. Considering a typical viewing angle of 2.6 sr stated in Lumileds
Appli-cation Note [31], the corresponding illuminance becomes 468 lm/m2. Finally, a
YAG:Ce phosphor integrated LED possessing the same illuminance at the same CCT was used to compare with the QD-LED backlit displays.
As the second step of the study, we calculated the effectiveness of the light sources in suppressing melatonin and compared with a YAG:Ce phosphor inte-grated LED. The circadian performances of the displays were evaluated using all the three different existing models in the literature. The first approach known as the circadian light (CL) method was developed by Rea et al. [28]. In this model, it is aimed to reveal the effect of light on the circadian rhythm by considering the contributions of the visual photoreceptors in addition to the ipRGC. However, opponents of this method argue that the effect of visual photoreceptors could be reduced by central processing [29] considering that some neurons in the brain robustly react to melanopsin activity but not to that of cones [32]. The method developed by Gall employs this idea and evaluates the effects of lighting on the human circadian response by using a circadian effect function ‘circadiane
Wirkungsfunktion’ in German [30], which was empirically defined using the mel-atonin suppression measurements of Brainard et al. [33] and Thapan et al. [34]. Later, in 2011 Enezi et al. [29] conducted experiments on mice and defined the melanopic spectral efficiency function. These three models were later compara-tively studied by Rea et al. [35] and it was concluded that there is no experimental finding to reject one model in favor of another. Thus, we made use all of these circadian rhythm models in this particular study.
However, all of these models present their outputs in numbers of different scales. Thus, bringing these results to the same scale is strictly necessary to make a healthy comparison. For this reason, we performed a scaling operation to each model similar to the one conducted in Rea et al. [35]. We divided the resulting numbers of the test spectrum to the circadian response of standard illuminant A
(IllA) at 468 lm/m2 for each of the models, i.e. the circadian light (CL) developed
by Rea et al. [28] the circadian effect factor developed by Gall et al. [30], and the melanopic sensitivity developed by Enezi et al. [29]. Since all these models need to be treated equally, we employed a multi-objective optimization by defining a utopia point indicating no melatonin suppression. The normalized values of cir-cadian light (CL), circir-cadian effect factor (CEF), and melanopic sensitivity function (Mel) constituted the dimensions of the circadian response. Finally, the perfor-mance of each QD-LED spectrum was evaluated by calculating the Euclidean dis-tance from the utopia point, which designates the performance of a hypothetical light source causing no disruption on the circadian rhythm for all of these three models. Spectra taking the closest position to the utopia point were considered as the most circadian rhythm friendly QD-LED designs. The equation used in the
Fig. 2: (a) Illustration of the computation setup to evaluate the effectiveness of the light source
in suppressing melatonin. Our approach is developed based on the three existing models by employing a multi-objective optimization technique. (b) Spectra of the YAG:Ce LED, QD-LED (made of a blue LED chip and color converting QD layer) acquiring the targeted color gamut in Fig. 1 (QD-LED1), and QD-LED reproducing the color gamut of the YAG:Ce LED (QD-LED2).
calculations of circadian distance (fcircadian) is shown in Equation 1 and its calcula-tion methodology is illustrated in Figure 2a. At this point, it is important mencalcula-tion- mention-ing that CL model accounts for an exposure duration of 1 h, while the remainmention-ing two models do not put any restriction on the exposure duration. Therefore, our quantitative results should be evaluated considering this 1 h duration; however, our spectral designs should qualitatively possess circadian rhythm friendliness for longer exposure durations as well.
= + +
2 2 2
circadian CEF(IllA)CEF(QD) Mel(IllA)Mel(QD) CL(IllA)CL(QD)
f (1)
2 Results and discussion
The first point that deserves attention in our analyses is the spectral requirement results regarding the satisfaction of the targeted color gamut (Table 1). These cal-culations revealed that the blue color (short wavelength) component is allowed to acquire only 465 and 470 nm as the peak emission wavelength among the simu-lated range of 400–495 nm (with the 5 nm step size). When 465 nm is chosen, the minimum and maximum allowed full-width at half-maximum values (Δλ) are 30 and 50 nm, respectively. On the other hand, the selection of 470 nm as the blue emission peak requires the use of more saturated colors having Δλ ≤ 30 nm. When the green color components (middle wavelength) are considered, the allowed peak emission wavelengths turn out to be in the range of 525–535 nm within the
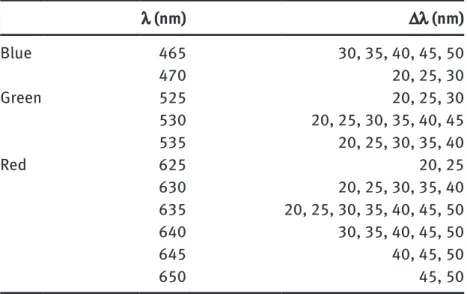
Tab. 1: Summary of the spectral parameters for satisfying the color gamut defined in Fig. 1.
λ (nm) Δλ (nm) Blue 465 30, 35, 40, 45, 50 470 20, 25, 30 Green 525 20, 25, 30 530 20, 25, 30, 35, 40, 45 535 20, 25, 30, 35, 40 Red 625 20, 25 630 20, 25, 30, 35, 40 635 20, 25, 30, 35, 40, 45, 50 640 30, 35, 40, 45, 50 645 40, 45, 50 650 45, 50
investigated interval of 500–595 nm. As opposed to the case of blue, the green color component requires high color purity having a Δλ of 20 nm, which is the narrowest Δλ used in our computation. When the peak emission wavelength is chosen to be 525 nm, the largest allowed bandwidth turns out to be 30 nm. This value increases to 45 and 40 nm in the case that 530 and 535 nm are selected, respectively. For the red color component (long wavelength), the allowed peak emission wavelengths span a wider range between 625 and 650 nm within the calculation range of 600–700 nm. It was found out that high purity red color is allowed between 625 and 635 nm indicated by a minimum Δλ of 20 nm. However, further increase of the peak emission wavelength towards 650 nm enforces the emission to acquire a larger minimum Δλ of 30, 40 and 45 nm for the peak emis-sion wavelengths of 640, 645 and 650 nm, respectively. The allowed maximum Δλ values also vary as the peak emission wavelengths change. If the peak wavelength of the red emission is 625 nm, then the maximum allowed bandwidth becomes 25 nm. As the peak emission wavelength increases to 630 nm, the maximum Δλ increases to 40 nm. Finally, a further increase of the peak wavelength was found out to shift the allowed Δλ further to 50 nm.
The circadian performance of the spectra presented in Table 1 was calcu-lated as described in Section 2. The minimal circadian effect (fcircadian) was realized when the peak emission wavelengths of blue, green and red color components are 465 nm, 535 nm and 635 nm, respectively. The full-width at half-maximum values turned out to be 30, 20 and 50 nm for the same color components. The
spectrum corresponding to this QD-LED (QD-LED1) can be found in Figure 2. The
same calculations were carried out for the YAG:Ce phosphor integrated white
LED. The results show that the QD-LED1 exhibited a circadian performance value
(fcircadian) of down to 4.32 values while that of the YAG:Ce integrated LED was 4.50
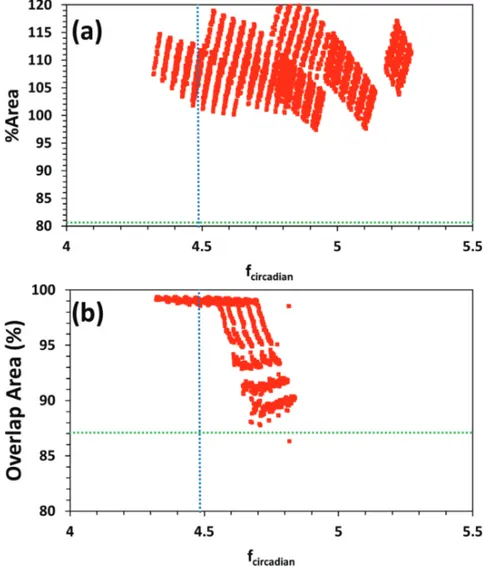
(Figure 3) while the color gamut of the QD-LED1 covers 107.5% of the area that
NTSC requires. On the other hand, the area that can be covered by the YAG:Ce LED remains only at 80.4% of the area required by NTSC. When the color gamut of the YAG:Ce LED is targeted during the QD-LED design, the resulting QD-LED (QD-LED2) reduces fcircadian by 33% to 3.03, whose spectra are given in Figure 2. This QD-LED constitutes of blue, green and red components emitting at 455, 545 and 620 nm, respectively, with respective full-width at half-maximum values of 25, 20 and 50 nm.
The overlap area with NTSC color span is also presented in Figure 3. This overlap is a very crucial quantity because it indicates the ability to define the colors in accordance with the NTSC specifications. The results show that the
color-gamut of the QD-LED1 overlaps almost perfectly as indicated by the
repro-duction of 99.2% of the NTSC color gamut while YAG:Ce integrated LED only over-laps with 87.3% of the NTSC standards.
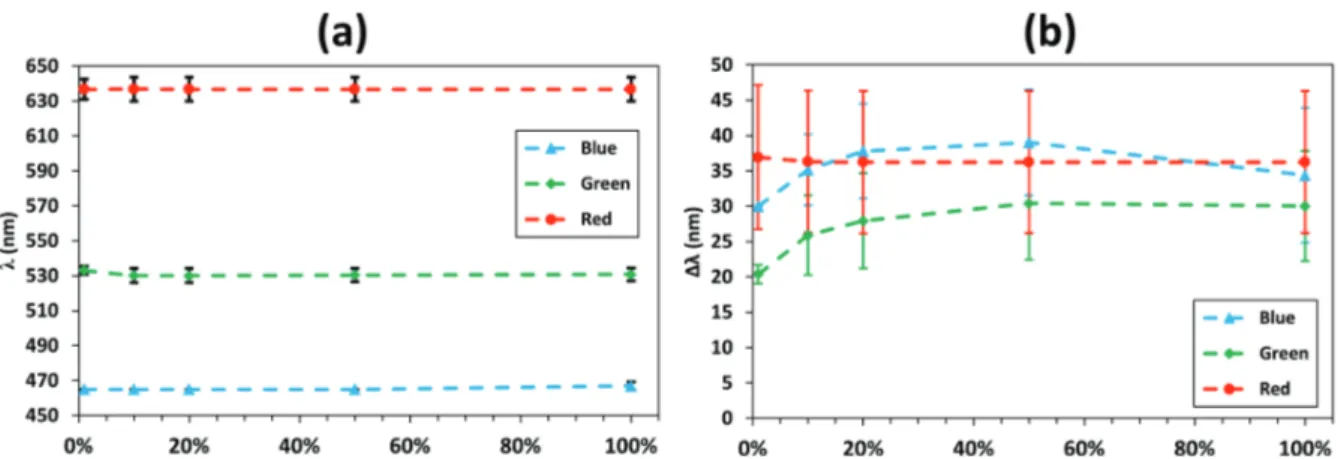
As Figure 3 suggests, the QD-LEDs possess the potential to cause less dis-ruptions on the circadian rhythm compared to the YAG:Ce LED; however, if not correctly designed, QD-LEDs can also adversely affect the circadian rhythm. Therefore, it is of significant importance to know which spectral parameters (the peak emission wavelength and the full-width at half-maximum) are necessary for realizing circadian rhythm friendly displays. To reveal this information, we sorted the spectra given in Table 1 according to their fcircadian values. In Figure 4, we illus-trate the average and standard deviations of the spectral parameters having the
lowest 1%, 10%, 20%, 50% and 100% values of fcircadian. Here, 0 nm standard
devi-ation of the blue wavelength for the spectra possessing the lowest 1%, 10% and 20% values of fcircadian indicates that the selection of the blue peak emission wave-length at 465 nm is very critical for the best circadian performance. Similarly,
Fig. 3: (a) Circadian performance (fcircadian) of QD-LED1 backlit displays together with the percent-age area compared to the area of NTSC color gamut. (b) Overlap area of QD-LED color gamut together with the NTSC standard vs. fcircadian. The blue dashed lines correspond fcircadian of YAG:Ce LED while the green dashed lines correspond to the (a) percentage and (b) overlap area of color gamut using the YAG:Ce LED backlighting.
535 nm turned out to be the critical wavelength for the green component as its standard deviation remains at 0 nm for the spectra possessing the lowest 1% and
10% of fcircadian. On the other hand, the red component offers improved flexibility
in the design of QD-LED backlight with a standard deviation of ca. 6.9 nm around the average wavelength of 636 nm. The investigation of the full-width at half-max-imum values provides additional valuable information. It turns out that the band-width of the blue emission is strictly required to be 30 nm while that of the green component is also equally critical to be as narrow as possible acquiring a full-width at half-maximum of 20 nm as their corresponding low standard deviations
of 0 nm and 1.4 nm show for the spectra having the lowest 1% fcircadian. The
inves-tigation of the red component, on the other hand, draws a different picture. The average of the bandwidth for the red components of circadian friendly spectra becomes around 36 nm with a large standard deviation of ~10 nm. This informa-tion brings us to the conclusion that the selecinforma-tion of red component provides sig-nificant flexibility for the design of the circadian rhythm friendly backlight using QDs compared to the blue and green color components.
3 Conclusions
In conclusion, in this study we investigated the potential of quantum dot inte-grated LED backlit displays considering their effect on the daily biological rhythm. The strategy that we present here is the first account of a circadian cycle friendly display backlight. By presenting the circadian rhythm friendliness perspective, we believe that the displays of the future will provide a healthier working and entertainment environment for the users.
Fig. 4: Average and standard deviations of the (a) peak emission wavelengths (λ) and (b)
full-width at half-maximum (Δλ) values of the spectra that acquire the lowest 1%, 10%, 20%, 50% and 100% values of fcircadian.
For this purpose, in this study we first calculated the required spectral prop-erties of the emitters so that the intended NTSC color gamut can be reproduced employing quantum dots. Subsequently, we evaluated the effect of backlighting on the circadian rhythm using three existing circadian cycle models; i.e. circadian light, circadian effect factor, and melanopic sensitivity function. The results show that compared to widely preferred YAG:Ce phosphor integrated LEDs, QD-LEDs can exhibit 33% weaker circadian disrupting effect when both acquire the same color gamut. When the QD-LED is required to cover the whole NTSC color gamut, then corresponding circadian performance is enhanced by 4.1% in addition to a 34% improvement in the achievable color gamut compared to that of YAG:Ce LED.
Furthermore, our results indicated that if the NTSC color gamut is targeted, a circadian rhythm friendly backlighting should acquire blue and green peak emission wavelengths at 465 and 535 nm, respectively, together with respective bandwidths of 30 and 20 nm. On the other hand, the red color component pro-vides some flexibility to the designer as indicated by 6.9 nm and 10 nm standard deviations around the peak emission wavelength of 636 nm and full-width at half-maximum of 36 nm, respectively, which is exactly in contrast to high color quality general lighting. On the other hand, if the color gamut of the YAG:Ce LED is tar-geted using a QD integrated LED, the emission wavelengths of the QDs should be at 455, 545 and 620 nm with bandwidths of 25, 20 and 50 nm for blue, green and red color components, respectively.
Acknowledgements: We gratefully acknowledge ESF EURYI and
EU-FP7 Nano-photonics4Energy NoE. H.V.D. acknowledges additional support from TUBA and T.E. acknowledges support from TUBITAK BIDEB. We also acknowledge M. Figue-iro for her helps in CL calculations.
References
1. T. Erdem, H. V. Demir, Nanophotonics 5 (2016) 74.
2. M. Adam, N. Gaponik, A. Eychmüller, T. Erdem, Z. Soran-Erdem, H. V. Demir, J. Phys. Chem. Lett. 7 (2016) 4117.
3. T. Erdem, Y. Kelestemur, Z. Soran-Erdem, Y. Ji, H. V. Demir, Nanophotonics 3 (2014) 373. 4. M. V. Kovalenko, L. Manna, A. Cabot, Z. Hens, D. V. Talapin, C. R. Kagan, V. I. Klimov, A. L.
Rogach, P. Reiss, D. J. Milliron, P. Guyot-Sionnnest, G. Konstantatos, W. J. Parak, T. Hyeon, B. A. Korgel, C. B. Murray, W. Heiss, ACS Nano 9 (2015) 1012.
5. M. G. Figueiro, J. Light Vis. Env. 37 (2013) 51.
6. J. S. Terman, J. S. M. Terman, E. S. Lo, T. B. Cooper, Arch. Gen. Psychiatry 58 (2001) 69. 7. M. G. Figueiro, M. S. Rea, P. R. Boyce, R. White, K. Kolberg, J. Perinatol. Neonatol. 14 (2001)
8. R. R. Auger, H. J. Burgess, R. A. Dierkhising, R. G. Sharma, N. L. Slocumb, Chronobiol. Int. 28 (2011) 911.
9. C. I. Eastman, M. A. Young, L. F. Fogg, Arch. Gen. Psychiatry 55 (1998) 883. 10. R. G. Stevens, Am. J. Epidemiol. 125 (1987) 556.
11. T. Erdem, PhD Thesis, Bilkent University (2016). 12. O. Graydon, Nat. Photon. 5 (2011) 1.
13. T. Erdem, H. V. Demir, Nature Photon. 5 (2011) 126.
14. S. Nizamoglu, T. Erdem, X. W. Sun, H. V. Demir, Opt. Lett. 35 (2010) 3372.
15. T. Erdem, S. Nizamoglu, X. W. Sun, H. V. Demir, Opt. Express 18 (2010) 340. 16. T. Erdem, H. V. Demir, Nanophotonics 2 (2013) 57.
17. H. V. Demir, S. Nizamoglu, T. Erdem, E. Mutlugun, N. Gaponik, A. Eychmüller, Nano Today 6 (2011) 632.
18. E. Jang, S. Jun, H. Jang, J. Lim, B. Kim, Y. Kim, Adv. Mater. 22 (2010) 3076.
19. http://blog.pgi.com/2013/10/screen-fiends-infographic-reveals-shocking-truths-technolo-gy-usage-screen-time/ (2013). Accessed February 12, 2018.
20. M. G. Figueiro, B. Wood, B. Plitnick, M. S. Rea, Neuroendocrinol. Lett. 32 (2011) 158. 21. B. Wood, M. S. Rea, B. Plitnick, M. G. Figueiro, Appl. Ergon. 44 (2013) 237.
22. C. Cajochen, S. Frey, D. Anders, J. Späti, M. Bues, A. Pross, R. Mager, A. Wirz-Justice, O. Stefani, J. Appl. Physiol. 110 (2011) 1432.
23. F.lux, https://justgetflux.com/ (2009). Accessed February 12, 2018. 24. Redshift, http://jonls.dk/redshift/ (2009). Accessed February 12, 2018. 25. D. Berson, F. Dunn, M. Takao, Science 295 (2002) 1070.
26. S. Hattar, R. J. Lucas, N. Mrosovsky, S. Thompson, R. H. Douglas, M. W. Hankins, J. Lem, M. Biel, F. Hofmann, R. G. Foster, K.-W. Yau, Nature 424 (2003) 75.
27. N. F. Ruby, T. J. Brennan, X. Xie, V. Cao, P. Franken, H. C. Heller, B. F. O’Hara, Science 298 (2002) 2211.
28. M. S. Rea, M. G. Figueiro, A. Bierman, J. D. Bullough, J. Circadian Rhythms 8 (2010) 1.
29. J. Enezi, V. Revell, T. Brown, J. Wynne, L. Schlangen, R. Lucas, J. Biol. Rhythms 26 (2011) 314. 30. D. Gall, C. Vandahl, K. Bieske, Licht für den Menschen: 10. Europäischer Lichtkongress
Berlin; 2005. https://www.db-thueringen.de/servlets/MCRFileNodeServlet/dbt_deri-vate_00008658/LuxEuropa2005_GVB.pdf. Accessed February 12, 2018.
31. Lumileds. Luxeon DCC for LCD backlighting. Application Brief [PDF on Internet]. Available from: http://www.philipslumileds.com/uploads/215/AB27-PDF (2005). Accessed February 12, 2018.
32. T. M. Brown, J. Wynne, H. D. Piggins, R. J. Lucas, J. Physiol. 589 (2011) 1173.
33. G. C. Brainard, J. P. Hanifin, J. M. Greeson, B. Byrne, G. Glickman, E. Gerner, M. D. Rollag, J. Neurosci. 21 (2001) 6405.
34. K. Thapan, J. Arendt, D. J. Skene, J. Physiol. 535 (2001) 261.