The relationship between insulin resistance, metabolic syndrome
and nonalcoholic fatty liver disease in non-obese non-diabetic
Turkish individuals: A pilot study
Gülbanu Erkan1, Irmak Sayın2, Fatma Betül Polat2, Ahmet Çorakçı3, Gökçe Kaan Ataç4, Halil Değertekin1 1Department of Gastroenterology, Ufuk University Faculty of Medicine, Ankara, Turkey
2Department of Internal Medicine, Ufuk University Faculty of Medicine, Ankara, Turkey 3Department of Endocrinology, Ufuk University Faculty of Medicine, Ankara, Turkey 4Department of Radiology, Ufuk University Faculty of Medicine, Ankara, Turkey
ABSTRACT
Background/Aims: Nonalcoholic fatty liver disease is related to obesity, metabolic syndrome, and insulin resistance. Nonalcoholic fatty liver disease and metabolic syndrome may also be encountered in non-obese, non-diabetic in-dividuals, and there are no published data about the prevalence of these conditions in non-obese, non-diabetic Turkish subjects. We aimed to determine the difference between non-obese, non-diabetic nonalcoholic fatty liver disease patients and healthy controls in terms of insulin resistance and metabolic syndrome in Turkish subjects. Materials and Methods: Non-obese, non-diabetic individuals (n=219) were enrolled. The cohort was divided into two groups according to presence of steatosis in ultrasonography: nonalcoholic fatty liver disease group (n=143) and healthy control group (n=76). Insulin resistance and metabolic syndrome were analyzed and compared be-tween the two groups.
Results: The prevalences of metabolic syndrome (32.2% vs. 5.3%, respectively; p<0.001) and insulin resistance (46.2% vs. 9.2%, respectively; p<0.001) were significantly higher in the nonalcoholic fatty liver disease group. Ac-cording to multiple logistic regression analysis, age (odds ratio 1.534; p=0.0032), insulin resistance (odds ratio 1.074; p<0.001), and serum ALT levels (odds ratio 1.102; p<0.001) were independently associated with nonalcoholic fatty liver disease.
Conclusion: Insulin resistance and metabolic syndrome are not rare in non-obese, non-diabetic Turkish subjects with nonalcoholic fatty liver disease. Ultrasonographically detected fatty liver was independently associated with insulin resistance, irrespective of the presence of metabolic syndrome.
Keywords: Nonalcoholic fatty liver disease, non-obese non-diabetic individuals, insulin resistance, metabolic syn-drome
INTRODUCTION
Nonalcoholic fatty liver disease (NAFLD) is a clinico-pathological entity that displays histological features similar to those observed in alcohol-induced liver inju-ry; nevertheless, it is encountered in individuals with no recent or present significant alcohol intake (1). NAFLD is closely related to obesity and insulin resistance (IR), and it is generally agreed upon that NAFLD is the hepatic manifestation of metabolic syndrome (MetS) (2). MetS is an insulin resistance syndrome comprising glucose intolerance, insulin resistance, central obesity, dyslip-idemia, and hypertension, all of which are well-estab-lished risk factors for cardiovascular disease (CVD) (3).
Obesity and diabetes mellitus are known to contribute to the development of NAFLD (1). Nevertheless, NAFLD may also occur in non-obese, non-diabetic individuals (4-6). Kim et al. reported that NAFLD is associated with metabolic disorder in non-obese, non-diabetic Asian populations (4). Musso et al. reported that NAFLD is asso-ciated with IR in non-obese, non-diabetic Caucasians (5). Despite the evidence connecting NAFLD to IR, it re-mains to be elucidated whether a diagnosis of NAFLD can improve cardiometabolic risk stratification beyond current diagnostic criteria, thus enabling identification of non-obese, non-diabetic individuals who are
actu-Address for Correspondence: Gülbanu Erkan, Department of Gastroenterology, Ufuk University Faculty of Medicine, Ankara, Turkey E-mail: [email protected]
Received: September 29, 2013 Accepted: February 06, 2014
© Copyright 2014 by The Turkish Society of Gastroenterology • Available online at www.turkjgastroenterol.org • DOI: 10.5152/tjg.2014.6233
Or
iginal Ar
ally at risk. The Adult Treatment Panel (ATP) III criteria for MetS are quite robustly correlated with IR (sensitivity of 46% and specificity of 76% for IR) in the general population, albeit with a weaker correlation in the absence of obesity and diabetes (7-9). There are few studies concerning the clinical significance of ultrasonographically detected NAFLD in non-obese, non-dia-betic individuals. To the best of our knowledge, no such study has been performed in the Turkish population.
In this study we aimed to determine:
1. Whether there is a difference between obese, non-diabetic NAFLD patients and healthy controls in terms of IR and MetS in Turkish subjects.
2. The differences in demographic and biochemical findings between non-obese, non-diabetic NAFLD patients and healthy controls.
3. Whether ultrasonographically detected NAFLD is more closely correlated with IR than MetS in obese, non-diabetic subjects.
MATERIALS AND METHODS
Non-obese, non-diabetic individuals (n=219) who presented to the Gastroenterology and Internal Medicine outpatient clin-ics due to dyspeptic symptoms or for routine check-up were enrolled. The cohort was divided into two groups according to ultrasonography (USG) findings: NAFLD (n=143) and healthy controls (n=76). The study protocol was approved by the uni-versity ethical committee. Informed consent was obtained from all subjects prior to enrollment. The study was conducted according to the declaration of Helsinki.
Inclusion criteria
Body mass index between 18.5 and 25 Hepatosteatosis on USG
Negative for biomarkers of all viral, autoimmune, metabolic liver disorders
No history of ethanol intake Exclusion criteria
Diabetes mellitus or history of impaired glucose tolerance History of exposure to drugs known to cause insulin resistance or secondary diabetes mellitus (i.e. steroids)
History of exposure to drugs known to cause hepatic enzyme elevation and/or hepatosteatosis (steroids, oral contraceptives, methotrexate, tetracycline, amiodarone, etc.)
USG findings consistent with chronic liver disease, dilation of the biliary system, hepatic nodule or mass
Healthy controls also needed to have a BMI between 18.5 and 25, with no history of diabetes or impaired glucose tolerance and with no sign of viral, metabolic, or autoimmune liver dis-ease; and normal liver parenchyma and biliary system on USG. All patients were questioned about their history of diabetes, impaired glucose tolerance, hypertension, cardiovascular dis-ease, ethanol intake, and concomitant medications. The pa-tients’ height, weight, and waist and hip circumferences were measured.
Patients receiving antihypertensive drugs or having a resting recumbent blood pressure of 140/90 mmHg or greater on at least two separate measurements were classified as hyperten-sive. Their height and weight were determined, and their body mass index (BMI) was calculated as weight (kg) divided by height squared (m). Waist circumference (WC) was measured at the mid-point between the lower border of the arcus costar-ium and the iliac crest. Hip circumference (HC) was measured around the widest point of the buttocks, with the tape parallel to the ground. Waist-to-hip ratio (WHR) was also calculated as the ratio of the circumference of the waist to that of the hips. Measurement of biochemical parameters
The laboratory assessment of blood samples for all participants included serum levels of aspartate aminotransferase (AST), alanine aminotransferase (ALT), gamma glutamyl transpeptidase (GGT), alkaline phosphatase (ALP), total bilirubin, direct bilirubin, albumin, total cholesterol (T. cholesterol), high-density lipoprotein choles-terol (HDL), low-density lipoprotein cholescholes-terol (LDL), triglycerides (Tg), fasting blood glucose (FBG), and fasting insulin levels. Definition of metabolic syndrome
MetS was diagnosed in the presence of 3 or more of the criteria listed by the revised Adult Treatment Panel (ATP) III of the Na-tional Cholesterol Education Program (9). These criteria include 1) elevated waist circumference (waist circumference ≥102 cm in men or ≥88 cm in women); 2) elevated triglyceride lev-els (≥150 mg/dL); 3) low HDL levlev-els (<40 mg/dL for men and <50 mg/dL for women); 4) elevated blood pressure (≥130/85 mmHg or the use of medication for hypertension); 5) elevated fasting glucose (≥100 mg/dL or use of medication for hyper-glycemia).
Definition of IR
Insulin resistance was determined by homeostasis model as-sessment index (HOMA-IR), calculated using the computer-based solution of the model provided by the Diabetes Trials Unit, Oxford Center for Diabetes, Endocrinology, and Metabo-lism, found at http://www.dtu.ox.ac.uk/homa.
The cut-off value was taken as 2.7 for HOMA-IR (10).
The patients were divided into 2 groups according to their HOMA-IR levels: insulin sensitive (HOMA-IR<2.7) and insulin
re-Or
iginal Ar
sistant (HOMA-IR≥2.7). Hepatic ultrasonography
Hepatic ultrasonography was performed by an experienced ra-diologist. Fatty liver was identified according to standard crite-ria, including parenchymal brightness, liver to kidney contrast, deep beam attenuation, and bright vessel walls (11).
Statistical analysis
Statistical analysis was performed using SPSS for Windows Version 15.0. Continuous variables were expressed as mean ± standard deviation, median, and minimum and maximum values, whereas categorical variables were expressed as num-bers and percentages. The normal distribution of continuous variables was verified with the Shapiro •Wilk test, and the ho-mogeneity of group variances was assessed with the Levene test. Comparisons between multiple groups were performed using one-way variance analysis or Welch variance analysis if the parametric test assumptions were verified, and using the Kruskal •Wallis test if the parametric test assumptions were not verified. Following these tests, binary comparisons were made using the Tukey HSD, Games •Howell, and Dunn tests. Compari-sons between 2 groups in terms of continuous variables were made using the t test if the parametric test assumptions were verified, and using the Mann •Whitney U test if the paramet-ric test assumptions were not verified. Comparisons between groups with regard to categorical variables were made using the chi-square test. Correlation between continuous variables was assessed using the Spearman correlation coefficient. Fac-tors affecting steatosis were determined using multiple logis-tic regression analysis. Level of significance was assumed as p<0.05.
RESULTS
Demographic, metabolic, and biochemical findings of the study group
The demographic, metabolic, and biochemical findings of the study population are presented in Table 1. Male sex was significantly more predominant in the NAFLD group than in the control group (58.7% vs. 43.4%, respectively; p=0.03). The prevalences of hypertension (41.3% vs. 9.2%, respectively; p<0.001), metabolic syndrome (32.2% vs. 5.3%, respectively; p<0.001), elevated FBG (32.9% vs. 9.2%, respectively; p<0.001), hypertriglyceridemia (35.7% vs. 21.1%, respectively; p=0.038), and IR (46.2% vs. 9.2%, respectively; p<0.001) were also signifi-cantly higher in the NAFLD group. Mean age (49.2±14.6 years vs. 36.4±13.6 years, respectively; p<0.001), BMI (24.1 kg/m² vs. 23 kg/m², respectively; p<0.001), serum AST (23 IU/L vs. 16 IU/L, respectively; p<0.001), serum ALT (33 IU/L vs. 16.5 IU/L, respec-tively; p<0.001), serum GGT (34 IU/L vs. 18 IU/L, respecrespec-tively; p<0.001), HOMA-IR (2.5 vs. 1.4; respectively; p<0.001), and fasting insulin levels (10.5 µu/mL vs. 6.65 µu/mL, respectively; p<0.001) were also significantly higher in the NAFLD group. Subjects with NAFLD were divided into two subgroups:
sub-jects with normal ALT levels and subsub-jects with elevated ALT levels (ALT>40 IU/L). Male sex was significantly predominant in the high ALT subgroup when compared to the normal ALT subgroup (75.9% vs. 48.3%, respectively; p=0.002). The preva-lences of hypertension (31.5% vs. 47.2%, respectively; p<0.094), metabolic syndrome (37% vs. 29.2%, respectively; p=0.43), el-evated FBG (35.2% vs. 31.5%, respectively; p=0.78), and hyper-triglyceridemia (44.4% vs. 30.3%, respectively; p=0.127) were not significantly different between the high ALT and normal
Or iginal Ar ticle Mean±SD Mean±SD p Age (years) 49.2±14.6 36.4±13.6 <0.001* WHR 0.86±0.07 0.8±0.1 <0.001* FBG (mg/dL) 95.1±8.3 87.8±8.7 <0.001* T. cholesterol (mg/dL) 192.4±37.9 170±31.6 <0.001* HC (cm) 99.0±4.6 95.9±6.4 <0.001* LDL (mg/dL) 112.7±32.7 98.1±24.6 <0.001*
Median (Min-Max) Median (Min-Max) p
WC (cm) 87 (65-104) 78 (65-102) <0.001* AST (IU/L) 23 (10-89) 16 (8-39) <0.001* ALT(IU/L) 33 (8-152) 16.5 (6-38) <0.001* BMI (kg/m2) 24.1 (19.7-24.9) 23 (18.6-24.9) <0.001* GGT (IU/L) 34 (6-139) 18 (8-49) <0.001* HDL (mg/dL) 42 (23-80) 47 (22-88) 0.127 Total bilirubin(mg/dL) 0.6 (0.16-2.1) 0.635 (0.24-2.2) 0.336 Direct bilirubin (mg/dL) 0.2 (0.04-1.2) 0.21 (0.03-0.7) 0.089
Fasting Insulin (µu/mL) 10.5 (0.4-125.1) 6.65 (2.6-23.2) <0.001*
HOMA-IR 2.5 (0.3-25.0) 1.4 (0.4-5) <0.001*
TG (mg/dL) 129 (35-331) 85 (32-279) <0.001*
NAFLD: nonalcoholic fatty liver disease; WC: waist circumference; HC: hip circumference; WHR: waist to hip ratio; Met S: metabolic syndrome; FBG: fasting blood glucose; HDL: high-density lipoprotein; TG: triglycerides; IR: insulin resistance; BMI: body mass index; HOMA-IR: index of insulin resistance calculated according to the HOMA (Homeostasis model assessment) method; T. cholesterol: total cholesterol; LDL: low-density lipoprotein; AST: aspartate aminotransferase; ALT: alanine aminotransferase; GGT: gamma glutamyl transpeptidase; Min: Minimum; Max: Maximum; Mean±SD: mean±standard deviation Table 1. Demographical, metabolic, and biochemical findings of the study group NAFLD (n=143) Control (n=76) n % n % p Sex Female 59 %41.3 43 56.6% 0.030* Male 84 58.7 % 33 43.4% Hypertension 59 41.3% 7 9.2 % <0.001* Met S 46 32.2% 4 5.3% <0.001* Elevated FBG 47 32.9% 7 9.2% <0.001* Low HDL 74 51.7% 32 42.1% 0.174 Elevated TG 51 35.7% 16 21.1% 0.038* IR Presence 66 46.2% 7 9.2% <0.001*
ALT subgroups. The prevalence of IR (63% vs. 36%, respectively; p=0.003) was significantly higher in the high ALT subgroup. BMI (24.4±0.7 kg/m² vs. 23.5±1.3 kg/m², respectively; p<0.001), serum AST (33.5 IU/L vs. 19 IU/L, respectively; p<0.001), serum ALT (62 IU/L vs. 22 IU/L, respectively; p<0.001), serum GGT (48.5 IU/L vs. 24 IU/L, respectively; p<0.001), HOMA-IR (3.25 vs. 2.2; re-spectively; p=0.018), and fasting insulin levels (13.05 µu/ml vs. 9.3 µu/ml, respectively; p=0.016) were also significantly higher in the high ALT subgroup when compared to the normal ALT subgroup (Table 2).
Clinical and laboratory characteristics of the subjects ac-cording to IR presence
The patients were also classified as insulin-resistant (n:73) and insulin-sensitive (n:146) according to the HOMA-IR value. Sta-tistically significant differences were found between the in-sulin-resistant and insulin-sensitive groups with regard to sex (male sex: 63% vs. 48.6%, respectively; p=0.044), hypertension (43.8% vs. 23.3%, respectively; p=0.002), elevated FBG (47.9% vs. 13%, respectively; p<0.001), hypertriglyceridemia (46.6% vs. 22.6%, respectively; p<0.001), BMI (23.9±1.3 kg/m² vs. 23.2±1.6 kg/m², respectively; p=0.001), WC (87.1±8.3 cm vs. 81.7±8.6 cm, respectively; p<0.001), HC (99.7±4.8 cm vs. 97.1±5.6 cm, respectively; p=0.001), WHR (0.9±0.1 vs. 0.8±0.1, respectively; p=0.003), FBG (97.6±7.9 mg/dL vs. 90±8.7 mg/dL, respectively; p<0.001), serum AST (23 IU/L vs. 18 IU/L, respectively; p<0.001), serum ALT (36 IU/L vs. 19.5 IU/L, respectively; p<0.001), serum GGT (35 IU/L vs. 22 IU/L, respectively; p<0.001), and triglyceride levels (152.6±64.6 mg/dL vs. 114.7±57.4 mg/dL, respectively; p<0.001) (Table 3, 4).
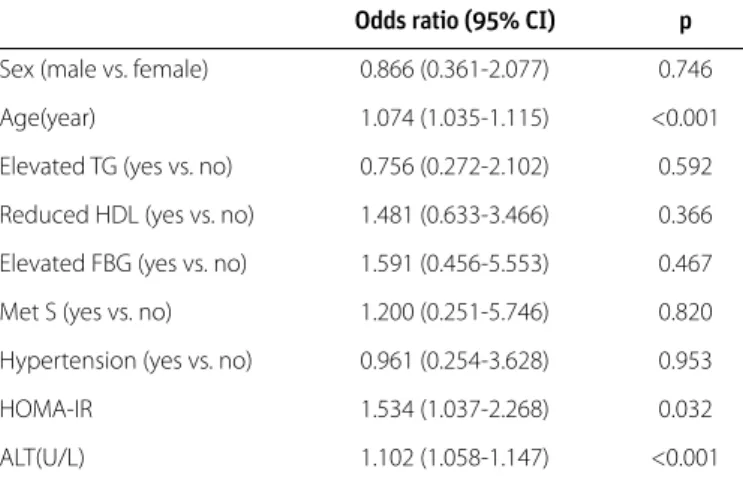
Multiple logistic regression analysis of the clinical and labo-ratory factors associated with NAFLD
According to multiple logistic regression analysis, age, HOMA-IR, and serum ALT levels were independently associated with NAFLD (Table 5).
DISCUSSION
MetS represents a constellation of metabolic and cardiovas-cular risk factors including abdominal obesity, IR, dyslipidemia, hypertension, and glucose intolerance. It has been generally agreed upon that NAFLD is the hepatic component of MetS, and IR is considered to be the common pathophysiological mechanism (2,12).
Obesity and type 2 DM are established risk factors for MetS and NAFLD (9,13). Nevertheless, NAFLD may also be encoun-tered in non-obese, non-diabetic patients. Kim et al. reported that NAFLD is closely related to metabolic disorders, even in non-obese, non-diabetic individuals. Multiple logistic regres-sion analysis demonstrated that sex, waist circumference, IR, and triglyceride levels were independently related to NAFLD in non-obese subjects (4). Musso et al. found that NAFLD is more closely associated with IR, oxidative stress markers, and endothelial dysfunction when compared to ATP III criteria in
non-obese non-diabetic individuals, and may contribute to the detection of subjects with a high cardiometabolic risk profile in this population (5). Recently, Sinn et al. demonstrated that ul-trasonographically diagnosed NAFLD independently predicts IR, regardless of how many components of the MetS are pres-ent in middle aged, non-obese, non-diabetic Asian adults. In
Or iginal Ar ticle Mean±SD Mean±SD p Age (years) 52.5±14.9 43.8±12.3 <0.001* WC (cm) 85.2±8.3 87±8.5 0.211 WHR 0.9±0.1 0.9±0.1 0.411 FBG (mg/dL) 95.3±8.4 94.8±8.4 0.751 T. cholesterol (mg/dL) 190±38.1 196.3±37.5 0.338 BMI (kg/m2) 23.5±1.3 24.4±0.7 <0.001* HC (cm) 98.7±4.7 99.5±4.5 0.327 LDL (mg/dL) 109.6±33.8 117.6±30.5 0.156
Median (Min-Max) Median (Min-Max) p
AST (IU/L) 19 (10-37) 33.5 (21-89) <0.001* ALT (IU/L) 22 (8-43) 62 (27-152) <0.001* GGT (IU/L) 24 (6-75) 48.5 (10-139) <0.001* HDL (mg/dL) 43 (26-80) 41.5 (23-72) 0.408 Total bilirubin (mg/dL) 0.6 (0.16-2.1) 0.5 (0.24-1.9) 0.177 Direct bilirubin (mg/dL) 0.2 (0.09-1.2) 0.2 (0.04-0.7) 0.079
Fasting Insulin (µu/mL) 9.3 (0.4-68) 13.05 (2.1-125.1) 0.016*
HOMA-IR 2.2 (0.29-17.6) 3.25 (0.5-25) 0.018*
TG (mg/dL) 123 (35-331) 136 (58-296) 0.111
NAFLD: nonalcoholic fatty liver disease; WC: waist circumference; HC: hip circumference; WHR: waist to hip ratio; Met S: metabolic syndrome; FBG: fasting blood glucose; HDL: high-density lipoprotein; TG: triglycerides; IR: insulin resistance; BMI: body mass index; HOMA-IR: index of insulin resistance calculated according to the HOMA (Homeostasis model assessment) method; T. cholesterol: total cholesterol; LDL: low-density lipoprotein; AST: aspartate aminotransferase; ALT: alanine aminotransferase; GGT: gamma glutamyl transpeptidase; Min: Minimum; Max: Maximum; Mean±SD: mean±standard deviation Table 2. Demographical, metabolic, and biochemical findings of the NAFLD group
NAFLD patients NAFLD patients with normal ALT with elevated
(n=89) ALT (n=54) n % n % p Sex Female 46 51.7% 13 24.1% 0.002* Male 43 48.3% 41 75.9% Hypertension 42 47.2% 17 31.5% 0.094 Elevated WC 18 20.2% 8 14.8% 0.556 Met S 26 29.2% 20 37.0% 0.432 Elevated FBG 28 31.5% 19 35.2% 0.783 Low HDL 47 52.8% 27 50.0% 0.745 Elevated TG 27 30.3% 24 44.4% 0.127 IR Presence 32 36.0% 34 63.0% 0.003*
their study, subjects with IR that could not be identified by the MetS criteria were identified by the presence of NAFLD (6). To the best of our knowledge, there are no published data about the metabolic significance of NAFLD in obese, non-diabetic Turkish subjects. In the present study, we determined that NAFLD was independently associated with IR regardless of the presence of MetS in Turkish subjects. As the findings of the above-mentioned studies imply, the current diagnostic criteria for MetS including the ATP III may be inadequate for the identi-fication of individuals with IR. Our findings are in line with those reported by Musso and Sinn, who demonstrated that NAFLD is more accurate for the diagnosis of IR than MetS is. In our study, we found a significant difference between the NAFLD and con-trol groups with regard to the presence of IR and MetS. In our study population, 46.2% of the individuals in the NAFLD group and 9.2% of the individuals in the control group had IR. When the groups were compared with regard to MetS, it was seen that 32.2% and 5.3% of the individuals had MetS in the NAFLD group and the control group, respectively.
In our study we did not perform OGTT (Oral glucose tolerance test) and we relied on history of previously documented im-paired glucose tolerance and/or diabetes. Likewise, OGTT was not performed in most of the studies on this subject (4,6).
Or iginal Ar ticle Insulin Insulin sensitive resistant (HOMA-IR<2.7) (HOMA-IR≥2.7) (n=146) (n=73) n (%) n (%) p Sex (Female/Male) 75(51.4%)/ 71(48.6%) 46(63%) 0.04427 (37%)/ Hypertension 34 ( 23.3% ) 32 ( 43.8% ) 0.002 Elevated WC 16 ( 11.0%) 16 (21.9%) 0.050 MetS 16 ( 11.0%) 34 ( 46.6%) <0.001 Elevated FBG 19 (13.0%) 35 (47.9%) <0.001 Reduced HDL 64 (43.8%) 42 (57.5%) 0.056 Elevated TG 33 (22.6%) 34 (46.6%) <0.001 Absent 68 (46.6%) 7 (9.6%) Steatosis Mild 35 (24.0%) 14(19.2%) <0.001 on USG Moderate 32 (21.9%) 27(37.0%) Severe 11(7.5%) 25(34.2%) Mean±SD Mean±SD p Age (years) 44.1±15.7 46.2±15.1 0.334 BMI (kg/m²) 23.2±1.6 23.9±1.3 0.001 WC (cm) 81.7±8.6 87.1±8.3 <0.001 HC (cm) 97.1±5.6 99.7±4.8 0.001 WHR 0.8±0.1 0.9±0.1 0.003
WC: waist circumference; HC: hip circumference; WHR: waist to hip ratio; Met S: metabolic syndrome; FBG: fasting blood glucose; HDL: high-density lipoprotein; TG: triglycerides; IR: insulin resistance; BMI: body mass index; HOMA-IR: index of insulin resistance calculated according to the HOMA (Homeostasis model assessment) method; Mean±SD: mean± standard deviation
Table 3. Demographic and metabolic characteristics of study subjects according to HOMA-IR index
Insulin Insulin sensitive resistant (HOMA-IR<2.7) (HOMA-IR≥2.7) (n=146) (n=73) Mean±SD Mean±SD p FBG (mg/dL) 90±8.7 97.6±7.9 <0.001 ALP (IU/L) 71.1±20.1 80.9±22.6 0.001 LDL (mg/dL) 105.5±30.2 111.8±32.1 0.160 TG (mg/dL) 114.7±57.4 152.6±64.6 <0.001
Median (Min-Max) Median (Min-Max) p
AST (IU/L) 18 (8-77) 23 (11-89) <0.001 ALT (IU/L) 19.5 (6-152) 36 (8-146) <0.001 GGT (IU/L) 22 (6-130) 35 (9-139) <0.001 HDL (mg/dL) 44 (22-88) 42 (23-80) 0.050 Total bilirubin (mg/dL) 0.6 (0.2-2.2) 0.6 (0.16-2) 0.214 Direct bilirubin (mg/dL) 0.2 (0.03-1.2) 0.2 (0.09-0.6) 0.218
Fasting insulin (µu/mL) 6.6 (0.4-12.4) 17.1 (9.8-125.1) <0.001
HOMA-IR 1.4 (0.3-2.7) 4 (2.7-25) <0.001
Albumin (mg/dL) 4.3 (3.5-5.2) 4.4 (3.4-5.1) 0.208
T. cholesterol 176 (100-288) 187 (118-276) 0.242
FBG: fasting blood glucose; HDL: high-density lipoprotein; TG: triglycerides; IR: insulin re-sistance; BMI: body mass index; HOMA-IR: index of insulin resistance calculated according to the HOMA (Homeostasis model assessment) method; T. cholesterol: total cholesterol; LDL: low-density lipoprotein; AST: aspartate aminotransferase; ALT: alanine aminotrans-ferase; GGT: gamma glutamyl transpeptidase; ALP: alkaline phosphatase; Min: Minimum: Max: Maximum; Mean±SD: Mean± standard deviation
Table 4. Biochemical findings of the study group according to HOMA-IR index
Odds ratio (95% CI) p
Sex (male vs. female) 0.866 (0.361-2.077) 0.746
Age(year) 1.074 (1.035-1.115) <0.001
Elevated TG (yes vs. no) 0.756 (0.272-2.102) 0.592
Reduced HDL (yes vs. no) 1.481 (0.633-3.466) 0.366
Elevated FBG (yes vs. no) 1.591 (0.456-5.553) 0.467
Met S (yes vs. no) 1.200 (0.251-5.746) 0.820
Hypertension (yes vs. no) 0.961 (0.254-3.628) 0.953
HOMA-IR 1.534 (1.037-2.268) 0.032
ALT(U/L) 1.102 (1.058-1.147) <0.001
CI: confidence interval; Met S: metabolic syndrome; FBG: fasting blood glucose; HOMA-IR: index of insulin resistance calculated according to the HOMA (Homeostasis model as-sessment) method; HDL: high-density lipoprotein; TG: triglycerides; BMI: body mass index; ALT: alanine aminotransferase
Table 5. Multiple Logistic Regression Analysis of The Clinical and Laboratory Factors Associated With NAFLD
Some authors suggest that NAFLD should be included in the definition of MetS (5,12). In our study group, NAFLD was in-dependently associated with IR irrespective of the presence of MetS. However, considering our relatively small sample size, we conclude that further studies are required to clarify this issue. There were some limitations to our study. Ultrasonography was utilized to detect fatty liver disease, rather than a liver biopsy. Ultrasonography is currently the most widely utilized method for screening asymptomatic patients with elevated liver en-zymes and suspected NAFLD. Nevertheless, ultrasonography cannot provide precise quantitative information about the de-gree of fat accumulation, or detect inflammation and fibrosis, and thus it cannot be utilized to diagnose NASH and hepatic fibrosis (14). However, the aim of this study was to determine whether ultrasonographically diagnosed NAFLD is more close-ly associated with IR than MetS is in non-obese, non-diabetic subjects.
Another limitation of our study was the relatively small sample size and that participants were either check-up patients or sub-jects with dyspeptic symptoms. The predictive value of NAFLD for IR may be different in the general population.
In summary, the findings of our study imply that IR and MetS are not rare in non-obese, non-diabetic Turkish NAFLD sub-jects. Ultrasonographically detected NAFLD was indepen-dently associated with IR, irrespective of the presence of MetS. Ultrasonographically detected NAFLD may be helpful for iden-tifying patients with IR. Early identification of such patients at higher cardiometabolic risk may alert healthcare providers to initiate timely lifestyle and pharmacological interventions. We propose that further studies in larger patient populations are warranted to verify that ultrasonographically detected NAFLD is independently associated with IR, irrespective of the pres-ence of MetS in non-obese, non-diabetic Turkish subjects.
Conflict of Interest: No conflict of interest was declared by the
au-thors.
REFERENCES
1. Chalasani N, Younossi Z, Lavine JE, et al. The diagnosis and man-agement of non-alcoholic fatty liver disease: practice guideline by the American Gastroenterological Association, American As-sociation for the Study of Liver Diseases, and American College of Gastroenterology. Gastroenterology 2012; 142: 1592-609.
2. Dowman JK, Tomlinson JW, Newsome PN. Systematic review: the diagnosis and staging of non-alcoholic fatty liver disease and non-alcoholic steatohepatitis. Aliment Pharmacol Ther 2011; 33: 525-40.
3. Expert Panel on Detection, Evaluation, and Treatment of High Blood Cholesterol in Adults Executive Summary of The Third Re-port of The National Cholesterol Education Program (NCEP) Ex-pert Panel on Detection, Evaluation, and Treatment of High Blood Cholesterol In Adults (Adult Treatment Panel III) JAMA 2001; 285: 2486-97.
4. Kim HJ, Kim HJ, Lee KE, et al. Metabolic significance of nonalco-holic fatty liver disease in nonobese, nondiabetic adults. Arch In-tern Med 2004; 164: 2169-75.
5. Musso G, Gambino R, Bo S, Uberti B, Biroli G, Pagano G, Cassader M. Should nonalcoholic fatty liver disease be included in the definition of metabolic syndrome? A cross-sectional comparison with Adult Treatment Panel III criteria in nonobese nondiabetic subjects. Diabetes Care 2008; 31: 562-8.
6. Sinn DH, Gwak GY, Park HN, et al. Ultrasonographically detected non-alcoholic fatty liver disease is an independent predictor for identifying patients with insulin resistance in obese, non-diabetic middle-aged Asian adults. Am J Gastroenterol 2012; 107: 561-7.
7. St-Onge MP, Janssen I, Heymsfield SB. Metabolic syndrome in normal-weight Americans: new definition of the metabolically obese, normal-weight individual. Diabetes Care 2004; 27: 2222-8. 8. Cheal KL, Abbasi F, Lamendola C, McLaughlin T, Reaven GM, Ford
ES. Relationship to insulin resistance of the adult treatment panel III diagnostic criteria for identification of the metabolic syndrome. Diabetes 2004; 53: 1195-200.
9. Grundy SM, Cleeman JI, Daniels SR, et al. Diagnosis and man-agement of the metabolic syndrome: an American Heart Asso-ciation/National Heart, Lung, and Blood Institute Scientific State-ment. Circulation 2005; 112: 2735-52.
10. Gökcel A, Ozsahin AK, Sezgin N, et al. High prevalence of diabetes in Adana, a southern province of Turkey. Diabetes Care 2003; 26: 3031-4.
11. Saverymuttu SH, Joseph AE, Maxwell JD. Ultrasound scanning in the detection of hepatic fibrosis and steatosis. Br Med J (Clin Res Ed) 1986; 292: 13-5.
12. Tarantino G, Finelli C. What about non-alcoholic fatty liver disease as a new criterion to define metabolic syndrome? World J Gastro-enterol 2013; 19: 3375-84.
13. Vernon G, Baranova A, Younossi ZM. Systematic review: the epi-demiology and natural history of non-alcoholic fatty liver disease and non-alcoholic steatohepatitis in adults. Aliment Pharmacol Ther 2011; 34: 274-85.
14. Wieckowska A, Feldstein AE. Diagnosis of nonalcoholic fatty liver disease: invasive versus noninvasive. Semin Liver Dis 2008; 28: 386-95.
Or
iginal Ar