KADİR HAS ÜNİVERSİTESİ
GRADUATE SCHOOL OF SCIENCE AND ENGINEERING PROGRAM OF MANAGEMENT INFORMATION SYSTEMS
STOCK VALUE PREDICTION USING MACHINE LEARNING AND TEXT MINING
AYŞENUR DİLARA ÇELİKEL
MASTER’S THESIS
AY Ş EN UR Dİ LA R A Ç ELİ KE L M.S . The sis 20 18 S tudent’ s F ull Na me P h.D. (or M.S . or M.A .) The sis 20 11
STOCK VALUE PREDICTION USING MACHINE LEARNING AND TEXT MINING
AYŞENUR DİLARA ÇELİKEL
MASTER’S THESIS
Submitted to the Graduate School of Science and Engineering of Kadir Has University in partial fulfillment of the requirements for the degree of Master’s in the Program of
Management Information Systems
İSTANBUL, JUNE, 2018 APPENDIX B
iii
STOCK VALUE PREDICTION USING MACHINE LEARNING AND TEXT MINING
ABSTRACT
In the digitalizing world, social media is a platform where all sorts of emotions, thoughts and life-sharing are frequently used by large segments of society. Twitter is one of the platforms where people share their thoughts and feelings and interact the most. Interpretations and opinions on the Twitter platform are the most important sources of data that need to be taken into account in the analysis of different aspects of the society's view of events that occur in the world.
In this thesis, the data belonging to the Turkish Airlines Cooperation and Pegasus Airlines Cooperation on Twitter platform, as a social media source, and Istanbul Stock Exchange and Bloomberg Exchange Data were used within the scope of case study. The correlation between tweets obtained via Twitter and stock market value data has been examined. The data at the specified date range have been obtained from Twitter using the Phyton programming language on a daily basis via Tweet Scraper. In the pre-process phase, these data were cleaned and labeled as negative/positive using the manually generated positive and negative dictionaries, and the emotion analysis was provided by the lexicon based approach. This analysis was visualized using graphs at specified intervals. In the second stage, raw data originated from Istanbul Stock Exchange and Bloomberg Exchange was provided to clean effective, ineffective and noisy data. Numerical data were analyzed using data regression algorithms in the test and training phases via the R Studio program. Positive / negative / neutral correlation with the numerical labeled social media data determined in specified periods was examined by means of visualization of the data which were analyzed as best effective features for investable or non-investable model was provided. According to the results obtained, it was determined that the companies stock value are increased in the period when the positive data were increased as expected or not.
iv
STOCK VALUE PREDICTION USING MACHINE LEARNING AND TEXT MINING
ÖZET
Dijitalleşen dünyada sosyal medya, toplumun büyük kesimi tarafından sıklıkla kullanılan duygu, düşünce ve yaşama ait her türlü paylaşımın sağlandığı platformlardır. Twitter ise insanların düşünce ve duygularını paylaştığı ve etkileşimin en fazla olduğu platformlardan biridir. Buradaki yorumlar ve fikirler, toplumun olaylara bakış açısının ve dünyada gelişen olayların analizinde dikkate alınması gereken en önemli veri kaynaklarındandır. Bu tezde örnek olay incelemesi olarak sosyal medya kaynaklarından Twitter platformu ile borsa verisi olarak İstanbul Borsası ve Bloomberg’deki Pegasus Havayolları A.Ş. ve Türk Hava Yolları A.O’ya ait verilerinden faydalanılmıştır. Twitter üzerinden elde edilen tweetlerin borsa verileri ile korelasyonu incelenmiştir. Twitter’dan günlük ve aylık bazda Phyton programlama dili ve Tweett Scraper kullanılarak belirlenen tarih aralığında dataların çekilmesi sağlanmıştır. Ön işleme aşamasında bu dataların temizlenmesi ve manuel olarak oluşturulan pozitif ve negatif sözlüklerden faydalanılarak tweetlerin pozitif ve negatif olarak etiketlenerek sözlük tabanlı yaklaşımla duygu analizi sağlanmıştır. Bu analiz belirlenen aralıklarla grafikler kullanılarak görselleştirilmiştir. İkinci aşamada ise Borsa İstanbul ve Bloomberg kaynaklı ham verilerin etkili, etkisiz ve gürültülü verilerin temizlenmesi sağlanmıştır. R Studio programı aracılığıyla test ve eğitim aşamalarında regresyon algoritmaları kullanılarak analiz edilmiştir. En etken verilerle yatırım yapılabilir veya yapılmamalı olarak analiz edilen verilerin görselleştirilmesi sağlanarak belirlenen dönemlerde etiketlenen sosyal medya verileriyle pozitif ve negatif korelasyonu incelenmiştir.
Anahtar Sözcükler: Metin madenciliği, Twitter, veri analizi, Pegasus Havayolları A.Ş., Türk Hava Yolları A.O, sosyal medya.
v
CONTENT
ABSTRACT ... iii
ÖZET... iv
TEŞEKKÜRLER ... vii
LIST OF FIGURE ... viii
LIST OF TABLE ... ix
1. INTRODUCTION ... 1
2. MACHINE LEARNING ... 3
2.1 Key Machine Learning Processes ... 3
2.2 Machine Learning Methods ... 4
3. TEXT MINING ... 5
3.1. Text Mining Processes ... 5
3.2. Other Studies ... 5 4. DATA SET ... 7 4.1 Quantitative Data ... 7 4.2 Qualitative Data ... 10 4.2.1 Text data ... 10 4.2.2 Lexicons ... 11
5 PROGRAMMING LANGUAGE AND SOFTWARE PACKAGES ... 12
5.1 R Programming language and R studio ... 12
5.1.1 R ... 12
5.1.2 R Studio ... 12
5.2 Phyton ... 12
6 ALGORITHMS ... 15
6.1 Support Vector Machine ... 15
6.2 Multiple Linear Regression Model ... 16
6.3 Random Forest Regression ... 19
6.4 Decision Tree Regression ... 20
7 METHODOLOGY ... 21
7.1 Preprocessing Steps ... 21
vi
7.2 Building Model ... 23
7.2.1 Stock Value Data ... 23
7.2.2 Twitter Text Data ... 32
8 RESULTS AND INFERENCES... 38
REFERENCES ... 40
vii
TEŞEKKÜRLER
Kıymetli tecrübeleri ile tezin oluşması sürecinde beni yönlendiren danışmanım Prof. Dr. Hasan DAĞ’a,
Bu tezin yazımı sürecinde datanın sağlanması ve finansal uzmanlığı ile çalışmaya katkı sağlayan Impera Capital Finansal Analisti Yaprak KUMAN’a,
Beni her zaman destekleyen ve cesaret veren kuzenim Onur ÇELİKEL'e, arkadaşlarım Şebnem ÖZHAL, Mesut Acar ve Alperen Özlü'ye
Her konuda beni cesaretlendiren ve desteğini esirgemeyen sevgili hocam Işıl Yenidoğan DAĞ’a,
Sabırla bu zorlu süreçte beni her zaman destekleyen anneme,
viii
LIST OF FIGURE
Figure 2.1: Machine Learning Steps ... 3
Figure 4.1: Polarity of Tweets ... 11
Figure 5.1: Process of Web Scraper ... 13
Figure 5.2: Phyton cmd Scraper example ... 14
Figure 6.1: Example of Regression Plane ... 18
Figure 6.2: Contour Plot Graph ... 18
Figure 7.1: Class Confusion figure of existing model ... 24
Figure 7.2: Class Confusion success figure of existing model ... 24
Figure 7.3: Correlation table of dot figure of varibales ... 26
Figure 7.4: Real and training data graph of Turkish Airlines ... 29
Figure 7.5: Real and validation data graph of Turkish Airlines. ... 30
Figure 7.6: Real and training data graph of Pegasus Airlines ... 31
Figure 7.7: Real and validation data graph of Pegasus Airlines. ... 32
Figure 7.8: Real and test data graph of Pegasus Airlines ... 32
Figure 7.9: Word Cloud of Turkish Airlines ... 33
Figure 7.10: Word Cloud of Turkish Airlines ... 33
ix
LIST OF TABLE
Table 4.1: Attribute Table ... 8
Table 4.2: Number of Tweets of Airways ... 10
Table 7.1: Cleaning of dirty/noisy text data ... 23
Table 7.2: Creation of correlation matrix ... 25
Table 7.3: Adjusted R square and standart error value of different regression methods 27 Table 7.4: Application example of backward elimination method ... 27
Table 7.5: Success value of regressor with Turkish Airlines data ... 28
Table 7.6: Summary of regressor with Turkish Airlines with validation set ... 28
Table 7.7: Success value of regressor with Pegasus Airlines data ... 30
Table 7.8: Summary of regressor with Pegasus Airlines with validation set... 31
Table 7.9: Success value of regressor via text data with Turkish Airlines data... 36
1 1. INTRODUCTION
In today’s modern world, it is undeniable that the number of the raw data obtained from various sources increased as a result of the increase of information sources and their interaction. The most accurate interpretation and effective use of these data have led to the understanding and importance of data science.
In addition to the analysis and use of numerical data, eliciting texts, analysis and provision of useful inferences have also become a great need and advantage in the digitalizing world. Text mining has become an area where data science has created inputs to provide a variety of decision support systems, such as economy, politics, health, finance, as a subdivision. One of the most important areas where competition is high and the risk factor should be used as a positive advantage is the financial sector. Data obtained from social media and news sources are interpreted by experts in the field and used as decision support mechanism in stock value prediction and investment decision. This data and text mining work, fed from different sources and growing in volume, is an indication that it will play an increasingly important role in the competitive market. Besides data and text mining applications “Huge constraint of data mining techniques are as a result of user oriented approach that needed dominantly expert opinion and proposal on the working data sets. Accordingly, experienced specialists on medical field are essential to interpret data properly.” Seifert J. W. (2004) In this study, the point of obtaining, cleaning and interpreting the exchange data that belong to Turkish Airlines Cooperation and Pegasus Airlines Cooperation has been collaborated with financial analysts from Imperial Capital company, which are specialist in the field. The relationship between positive, neutral, and negative tweets and stock mobility has been examined in a text mining sentimental analysis study on Twitter. As a result of the study, a decision support system has been provided to determine whether social mobility creates suitable time and conditions for the company for prediction of stock value to be invested.
2
For this purpose, the positive or negative effect of social media mobility and the hidden patterns of which features in the stock market value play a key role have been revealed.
3 2. MACHINE LEARNING
Machine Learning is a sub branch of computer science that was developed from basis of quantitative learning and model identification. The premise of machine learning is creating algorithms which receive input and can make accurate predictions using statistical data and algorithms. Output of these algorithms are new algorithms and methods to predict new inputs’ and systems. These kind of algorithms and models generally uses dynamic data and instructions rather than following static data from database systems. Machine learning model feeds itself thanks to data and there is no need to develop model output with using new codes and programing language. After a while, machine learning model are getting developed and at the last point it is turn into artificial intelligence and deep learning at advanced level. Machine learning models was applied to many areas as analysis and new technologies such as security and cybercrime, retail sector, insurance, banking, behavioral sciences.
2.1 Key Machine Learning Processes
Data Cleaning - Preprocessing: The first step of process part of the machine learning process is data preprocessing, in other words data cleansing. Noisy/dirty data causes some anomalous and redundant conclusions during the analysis and modeling part. Eliminating complex and irrelevant data is necessary to create a more accurate model
Creating Machine Learning Model Training,validate and test model Evaluating model performance
Interpreting model outputs and optimize model(if its needed update the model)
4
2.2 Machine Learning Methods
Machine Learning methods have very different purposes depending on the targeted output of discovered information. Many methods which have different purposes can be applied with together in order to ensure a more accurate result. “Machine learning algorithms can divide into 3 main categories ;supervised learning, unsupervised learning, and reinforcement learning.
Supervised learning is useful in cases where a property (label) is available for a certain dataset (training set), but is missing and needs to be predicted for other instances. Regression and Classification methods are belongs to this category.
Unsupervised learning is useful in cases where the challenge is to discover implicit relationships in a given unlabeled dataset (items are not pre-assigned). There is no training set in this kind of learning algorithms. Clustering and association rules methods are belongs to this category. Lee J. (2016)
5 3. TEXT MINING
Text mining basically sub category of data mining and the resource of the data is text. In other words, the purpose of text mining is that acquiring structured data from the source of text formatted data e.g. classifying text, clustering text, extracting concept or entity features and extractions, creating granular particular texts, sentimental analysis, text summarization can be listed as the study area of text mining. To reach these purposes different approaches and methods are used e.g. information gain(retrieval), lexicon based approach, word frequency distribution, bag of words and visualization of results and inferences.
Text mining practices generally run with natural language processing (NLP) studies, another Word, in textual literature both of them are combined together during the studies. Natural language processing studies are mostly based on linguistic knowledge under artificial intelligence. At the other side, text mining studies are mostly aimed at reaching the results statistically via text. Text mining studies often use natural language processing to extract features.
3.1. Text Mining Processes
Text cleaning-text preprocessing Tokenization(connection if its used)
Tagging part of Speech and Attribute Generation Modeling and evaluation
3.2. Other Studies
There are a few studies about emotional analysis on Twitter in Turkish. In the light of the findings in those studies, it was found that the mentioned subject reflects either positive or negative thoughts with 85 percent success in the news written in Turkish. And tweets that are key-word-dependent or independently aggregated were classified as positive, negative and neutral based on the dictionary using n character gram model Vural A and Cambazoğlu B. (2012). In addition to them, the study of Şimşek and Özdemir have tried to find out if there is a relationship between exchange on the stock market and Twitter users tweets about the economy. Şimşek M, Özdemir S. (2012).
6
Considering the emotional analysis of the twitter messages, another study has used both dictionary-based and machine learning methods on two different sets of data consist of Twitter and movie comments along with 75.2% and 85% success was achieved on the Twitter dataset respectively for the dictionary-based and machine learning methods, and 79.5% and 89% for the movie comments data set successively. Meral M, Diri B.(2014) , Türkmenoğlu C, Tantuğ AC.(2014)
A study conducted by Gidofalvi, although not precisely verified, prediction the value of a company's stock after a financial news release in the social media was carried out until 20th minute. This estimate is valid up to 20 minutes and is a concrete example of a study showing that there is a weak link between the news text and the price of the stock in short term.(Gidofalvi, 2004)
In addition to the scientific studies, sentiment analysis is also offered by some commercial companies and software developers with natural language processing methods to provide commercial solutions. To provide data, one of the globally known company, Reuters, provide sentimental analysis services to their customers through social media channels from the beginning of 2014. Thus, with the instantaneous data, the company's emotional state on social media has become able to analyze the impact on company trend and financial data. (Thomson Reuters Tech Talks, 2014)
Atan's expectation is that these two phenomena are intuitive ties in the study of the links between prices and news which are published in news sites. However, as a result of the study, it was not sufficient to evaluate the verbal and numerical parameters together in order to analyze these two parameters. At the same time, it deals with capacity, pressure, external factors, the effects of emotions and thinking mistakes. Thus, only the handling of the correlations of these factors has been described as a desire to keep the company perception on the trend. (Atan, 2014)
7 4. DATA SET
Data set which are used in that study is divided into two main categories. Quantitative data consists of Bloomberg exchange and Borsa İstanbul exchange values of Turkish Airlines and Pegasus Airlines between 1st of April 2014 and 31st of March 2018.
Qualitative data consists of text content data which was obtained from Twitter as text data source. Attribute information and details of whole data sets was mentined below with details.
4.1 Quantitative Data
Data set of study about stock-exchange value of Turkish Airlines and Pegasus Airlines consists of 2986 daily exchange data with combination of Borsa İstanbul and Bloomberg exchange data. Date of the data between April 2014 and March 2018 with 20 features as the final version. During that study some of the derived attributes about financial data was cleaned. There was no missing attribute about that data and also because of the dependent stock features holiday days and weekends not excluded due to the impact of the other features.
Before the study, expert analysts of Impera Capital lead the way about the exchange data and give the necessary structure and dependencies of the data. Some of the features were eliminated owing to derived attributes and not suitable for the analysis of the case company of that study. And also the company were lead their customers based on the experiences according to past share price of the company so during preprocessing part feature selection method was applied to eliminate invest column which was labeled as 1(invest) and 0(not invest). But in that way the company only has 67% success rate about investment decision for their customers in other words investors decision concluded with capital lost about 33% percent. The detailed information about feature selection will be informed under the related sub header.Data set consists of 18 independent numeric attributes, and have 1 continuous and dependent variable named as PX LAST(Share price)
8
Table 4.1: Attribute Table Attribute Number Attribute Name
and Abbreviation
Attribute Type Explanation
1 Date Date Exchange value date
information. Format: dd.mm.yyy
2 Market
Capitalization - CUR
Numeric Marketing value in exchange
3 Sales Revenue
Turn- SRT
Numeric Income rate/amount
4 Net Debt- DEBT Numeric Debt-Liquid
5 Gross Profit
Margin- GM
Numeric Revenue-expenditure
6 EBITDA
Margin-EBITDA
Numeric Optional profitability
7 Return On
Invested Capital- OR
Numeric Income based on funds
8 Revenue per
Available Seat Miles- PSGR
Numeric Unit measurement for efficiency
9 10 Price to Earnings
ratio-PE
Numeric Company's share price per earnings
11 EV to EBITDA
ratio- EV
Numeric Earnings before interest, taxes, depreciation and amortization
12 EV to Market
Cap-EVT
Numeric Enterprise value to market cap
13 Market Cap to
Revenue-MKT
Numeric Market stock value revenue
14 Revenue per
Share-SH
Numeric Income per one stock value
15 BIST-XU Numeric Stock exchange comment
performance indicator of Borsa İst. market value
16 MXEF Numeric MSCI Frontier markets
value
17 MXFM Numeric MSCI emerging markets
value
18 S&P 500-SPX Numeric The highest 500 activity
value in USA market
19 EBITDA to
revenue- EBI
Numeric Percentage of a company's earnings remaining after operating expenses.
20 Share
Price-PX_LAST
Numeric Price, stock value of an asset
10 4.2 Qualitative Data
4.2.1 Text data
Text data from the Twitter platform was obtained with the Phyton programming language and one of its library named as Scrapy. With Scrapy web crawler, the data which the user want to obtain by searching for the desired keywords and hashtags with stated date with the given time interval.
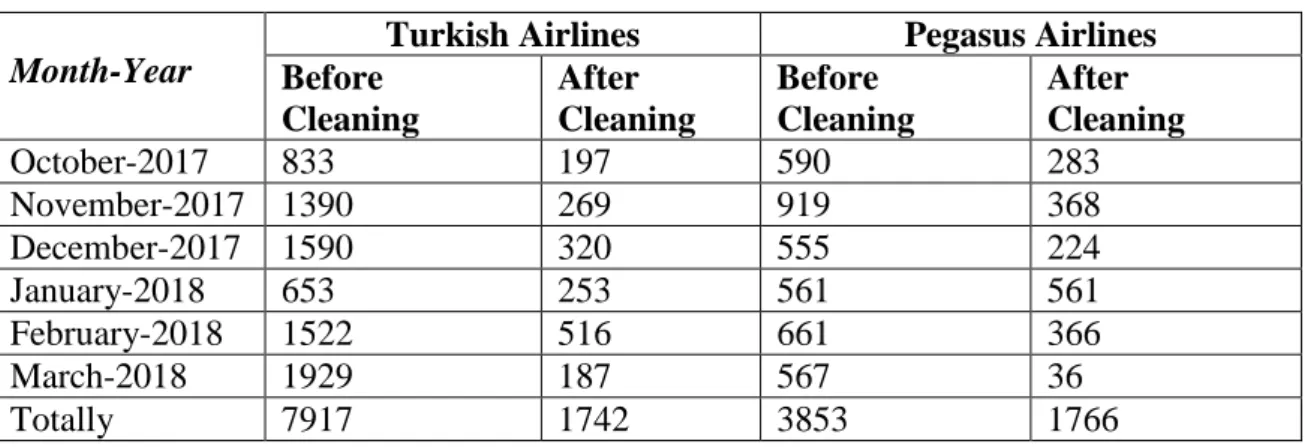
To use this study, tweets about Pegasus Airlines and Turkish Airlines was obtained between 1st of October and 31st of March. Before tweet cleaning in other words, tweet preprocessing part the raw number of tweets and the number of cleaned text data information was given below.
Table 4.2: Number of Tweets of Airways
Month-Year
Turkish Airlines Pegasus Airlines
Before Cleaning After Cleaning Before Cleaning After Cleaning October-2017 833 197 590 283 November-2017 1390 269 919 368 December-2017 1590 320 555 224 January-2018 653 253 561 561 February-2018 1522 516 661 366 March-2018 1929 187 567 36 Totally 7917 1742 3853 1766
Given the number of tweets pertaining to these companies, the interpretation may seem less obvious. However, the number obtained is quite efficient by indicating that the advertisements, slogans, and tweeted tweets have been removed in the time-consuming and manual process of pre-processing. It can be say the manual pre-process as the most time-consuming process throughout the thesis.
11 -200 -150 -100 -50 0 50 100 150 200 250 300
October November December January February March
Positive Negative Neuter Polarity
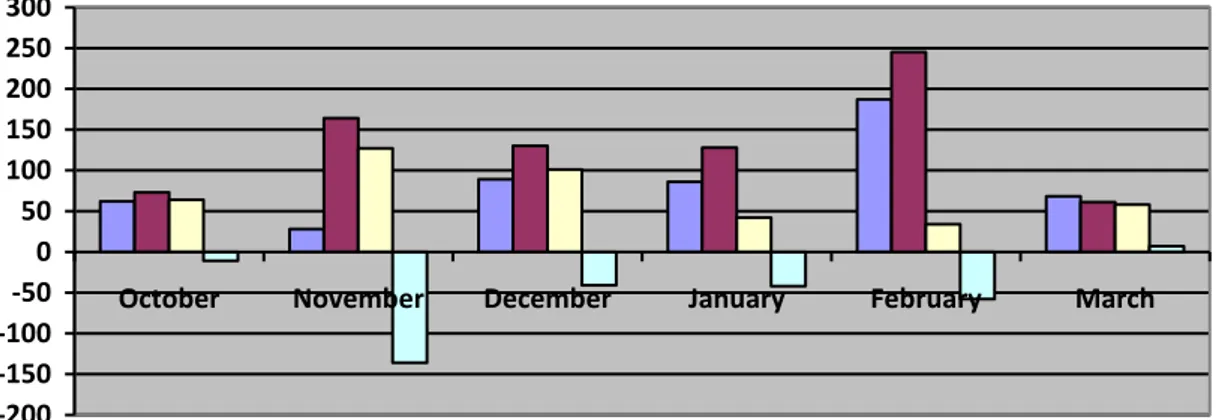
Figure 4.1: Polarity of Tweets
4.2.2 Lexicons
Dictionary to analysis tweets was created to determine the emotional score of words and consequently the clues for use in sentimental analysis. These dictionaries are divided into two categories and named as positive and negative dictionaries. Since there is not a ready to use dictionary that can used in Turkish, this process has to be provided manually. In the manual preprocessing process, positive and negative dictionaries were created at the same time. In their studies Çoban and Sayın also stated that in the literature there is a lot of studies on English in the areas of emotion analysis and language science. This shows a decrease in the number of dictionary sources available in the modeling and inference analyzes performed during the stud. Also stated that in the literature, there are a lot of studies on English in the areas of emotion analysis and language science but in Turkish there is no enough sources to use investigation of the analysis of sentiment analysis. (Sayın, Çoban, 2015). This shows a decrease in the number of dictionary sources available in the modeling and inference analyzes performed during that study. Tweets were read one by one and especially the words expressing positive and negative emotions in Turkish language were removed. Since some words in our language can express both emotions positive and negative, these words are added to both the glossaries manually. Finally, the negative word dictionary consists of 3830 words, and the positive word dictionary consists of 1321 words. Texts are labeled as positive or negative sentiments according to that lexicons.
12
5 PROGRAMMING LANGUAGE AND SOFTWARE PACKAGES 5.1 R Programming language and R studio
5.1.1 R
R is an open source statistical programming environment and is a tool. It is a successful for visualization of data and also it is necessary to analyze data, draw data, or create a statistical model. One-time analysis and ideal for prototyping and academic works, but not for creating models that will be set up in a scalable or big operational environment. There are three key benefits of R:
Open Source and it is free to use.
R has many popular very powerful algorithms implemented as third party libraries and open source packages.
It basis on S statistical computing language, it is free to use many different data matrices like data frame, vectors, matrices etc.
Three key difficulties with the platform are:
Inconsistency: All algorithms must be implemented with their special parameters, special naming conventions
There are enough resources as a number, but at the point where you hang out. Scalability: R is designed to be used in a machine with memory. Not designed for
use with transport data (machinelearningmystery,2016) 5.1.2 R Studio
RStudio is an integrated development environment (IDE) specifically built for the R programming language. This console supports direct code execution. Syntax highlighting editor and tools for drawing, history, debugging, and workspace management. RStudio is available in open source and commercial versions and runs on a desktop (Windows, Mac and Linux) or Another ways on a browser connected to RStudio Server or RStudio Server Pro (Debian / Ubuntu, RedHat / CentOS and SUSE Linux). (What is R, rstudio.com, 2012)
5.2 Phyton
Python is a platform-independent, object-oriented, interpretable scripting language with high-level simple syntax, fairly easy to learn, modularity, readability. Python is also an
13
interactive, object-oriented programming language that can be interpreted. These language modules work in conjunction with extreme situations, dynamic writing, highly dynamic data types and classes. Python is quite clean and can combine with plain lines. It has multiple interfaces suitable for many system calls and libraries and can be developed in C or C ++ environment. This language can also be used as an extended language in applications such as the need for a programmable interface. Finally, Python is quite portable. This language can run on many Unix operating systems, Macs and computers running MS-DOS, Windows, Windows NT and OS / 2 operating systems.(phyton.com.tr, 2014)
5.2.1 Scrapy Library
Scrapy is a sophisticated library of Phyton that allows to quickly and easily browse web content and needed. In that study to crawl twitter page in addition to Visual Studio Library, Phyton scrapy framework were used to find tweets with given time interval.The output of crawler is Json formatted text data with given path to write down the text files.
14 Figure 5.2: Phyton cmd Scraper example
15 6 ALGORITHMS
Based on independent variables to find out best fitted solution with numerical variable in stock value data set regression model was used. According to the R squared and error rate the most successful method was used to create predictive model.
One of the most basic structures of statistical science is regression analysis. The model that will be generated depends on one or more variables or constants of a selected specific variable. These variables are used to measure the size and value of the measurements. Regression Analysis It can be done with multiple variables or depending on a variable. How the independent variables affect the dependent variable is determined by a constant coefficient. This coefficient is called the regression constant of the variable, that is, the coefficient of the regression with another word, and indicates the degree of dependence of the dependent variable. Thus, the relationship between connected and independent variables is interpreted. (‘Regresyon Analizi Nedir?’, http://mustafaakca.com, 2016)
6.1 Support Vector Machine
Support Vector Machines are one of the most popular and perhaps most popular regression methods in use today and are often used in the field of machine learning algorithms. Basically there is a plane called the hyperplane, which we will examine. A vector is formed on this plane and this vector divides the input variable field. In support vector machines, a hyper correlation is chosen to best distinguish class in points input variables or class 1 based on the size of this class. The image here can be observed in two dimensions, you can display it as a line, and assume that all your input points are variable. The purpose here is to completely separate the areas defined by this line. The SVM regression learning algorithm finds the best coefficients that allow classes to be separated by the hyperplane. The shortest distance between the hyperplane and the nearest data plane points is called the margin. The best or most appropriate hyperplane to distinguish these two classes is the line with the largest margin. These points only apply to the definition of hyperplasia and the construction of the regulator. This point is called support vectors. Supports or defines the hypertext. In practice, an optimization algorithm is used to find the values of the coefficients that maximize the margin.
16 6.2 Multiple Linear Regression Model
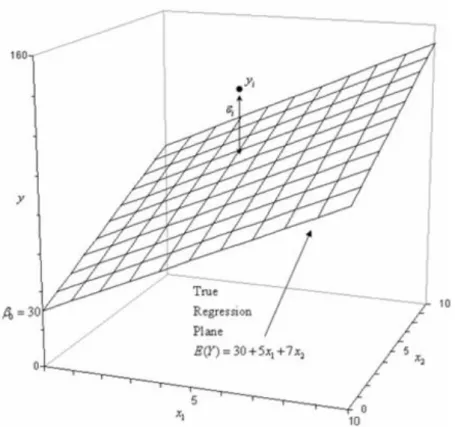
The linear regression model, which has more than one independent variable and is effective on the dependent variable, is called the multiple linear regression model. The model shown in the following example is a multiple linear regression model with two independent variables and affects the formation of the Y dependent variable
(6.1) The resulting model is linear because the parameters , , .are linear. This model forms a three dimensional space plane and named as Y. The resulting parameter is the intersection point of this plane and these parameters can be termed as general and partial coefficient of factors. This parameter represents the change in mean response corresponding to a unit change when held constant. That is, when we examine the following example of a multiple linear regression model with two independent variables It represents the change in mean response corresponding to a unit change when the parameter is held constant. Consider the following example of a multiple linear regression model with two independent variables with the mulipliers of 5 and 7;
(6.2)
The following regression model is an example of a first order multivariate linear regression model. The reason for this is that the maximum power of the variables in the model is 1. The regression plane corresponding to this created model is also shown below. In addition, an observed data point and a random error corresponding to that data point are shown. The actual regression model is usually unknown and therefore the random error terms and their values are unknown, which correspond to the data sets being examined. However, the regression model can be estimated by separately calculating the parameters of the generated model for each observed data set. In this case, the best regression model was tried to estimate and construct using the least squares.
17
Each of the following illustrations shows the contour plot for the regression model created for the equation above. A contour plot basically takes one or more functions as a number and shows lines that contain constant average response values. The contours of this given regression model consist of straight lines, as shown in the following example drawing. Linear contour lines are evaluated by first order linear linear regression models that are derived from interaction and have no conditions.
A multiple linear regression model may also take the following, which means more than 2 dependent term:
(6.3) Cross product x1 and x2 terms was included in this model. That term indicates an interaction between variables and between two variables and the dependent variable. In other words, the interaction means that the effect that a change in a predictive variation has on the other is dependent on the level of other predictive variables. To give an example of a linear regression model with an interaction, includes the model given by the equation. The regressor of the plane and the contour plot graph are shown in the following above two figures.
18 Figure 6.1: Example of Regression Plane
Figure 6.2: Contour Plot Graph
There are three basic uses for the analysis of the basic uses for multiple linear regression analysis. The first use can be used to describe the power of one or more independent
19
variables that have dependent variables. In this thesis study, this basic usage is taken into consideration and related economic model has been created.
The second use is used to examine the effects of basic changes on one another or to predict effects by training the model. This multivariate linear regression analysis allows us to understand how much the dependent variable will change when we change the independent variables and when it comes to a new data, it will be examined to provide an average model. For example, in a multiple linear regression model, each point change (increase or decrease) of IQ can be used to examine the overall grade average effect of the students. In this way, it can be deduced what to do with the model of general increase or decrease of average.
As a third and final point, multiple linear regression analysis predicts trends and future values. Multiple linear regression analysis can be used to obtain point estimates. An example question is "what will be the price of gold six months after now?" Another example of this is used in this thesis.
While the model is selected for multiple linear regression analysis, another important point is model fit. Adding independent variables to the multicollinear regression model will always increase the amount of variance described and expressed as the success rate of the dependent variable, usually R², expressed as the multiple variable model. For this reason, adding a large number of independent variables without requiring any theoretical reason may result in an over-compliance model. (statisticssolutions.com, 2016) This can be illustrated as an example of overfitting with the addition of Twitter data in this thesis.
6.3 Random Forest Regression
Random Forests is one of the most effective machine learning models for analysis, most commonly used in statistics and analytics, making this model a work-friendly workload for machine learning. In this model, based on formal decision trees, many models are combined and predictions are made. In this model, the model class is created with the functions indicated by f below. So we can say that some kind of additional models can be created using nodes.
20
g (x) = f0 (x) + f1 (x) + f2 (x) +.. (6.4) This model is finally called g. This is the sum of simple basic, i.e. base models. It is a simple decision tree for every basic classifier or regression used here. This model is designed to achieve better predictive performance. This model is called a multi-variant wide-ranging technical model using multiple models. All basic models created in random forests are created independently using a different sub-sample of the addressed data. When this model is created, the sample to be selected, namely the number of forests. (turi.com, 2018)
6.4 Decision Tree Regression
Decision Trees are the most commonly used type of algorithms, especially for classification algorithms and for predictive modeling and machine learning. If the decision tree model is taken into consideration, it is basically a node tree made up of nodes and at least a binary tree. This means that at least two trees from the algorithms and the data structures, multi-node basically does not indicate that your model and your data are basically rich. Each node that occurs may be called a single constant variable -x and represents a splitting point on that variable. in addition to the classification algorithms, assuming that it is numeric, leaf nodes of the tree contain an output variable -y, each of which is used to make an estimate. These predictions are made by walking to the root from the parts of the tree up to a leaf node, and removing the nodes below the boundary variable in this node. If the states value which is find under the specified threshold value, the node is cut. In addition to the regression method as a machine learning method, this method is very fast in the classification method and is very fast to make predictions. It can usually be used to investigate a wide range of problems and usually results in high reliability and accuracy.( towardsdatascience.com,2014)
21 7 METHODOLOGY
7.1 Preprocessing Steps Stock Value Data
The tweets of Turkish Airlines and Pegasus Airlines at our disposal these need to be taken to classify the documents in a sense to prepare for sentimental analysis. Firstly, examining the tweets that are obtained from the general passages, the words of positive and negative meaning are separated in two different lexicons. Neuter lexicon was not created due to zero effect to the sentiment score. For this reason, lexicon based approach has been used in that study.
There were some unnecessary calculations which can be eliminated and some expressions of the output of test set results needed to make comment properly. To understand and check the accuracy of that step data set were send to Impera Capitals’ analysts. They gave feedback with explanation the unnecessary data and accuracy of the logic of the data. According to that feedback some columns were eliminated.
If minimum 30% percent of column is empty, fully empty and if column includes irrelevant data which will affect the study the data was eliminated. But there is no missing values about that data so eliminate, delete or add mean values instead of missing values methods were not applied.
Before applying regression techniques classification techniques were thought to apply that data set. Because raw data was labeled as 1 that means make investment and 0 that makes sold it o do not buy the stock paper the company. But according to the success rate of the company only 67% of the data were labeled accurately. So, with financial analyst it was decided to use stock value price prediction regression column to make more accurate and correct predictions.
Some features’ value are needed scaling so before creating model feature scaling was applied.
There were some derived attributes which were found as division of two values of multiplication of two attributes. These kind of data, were also eliminated and
22
also according to the entrophy gain there is no effect above the best fitted solution.
Text Data
Positive and negative lexicons were created manually according to the data with the capable way as much as possible. Two lexicons were created manually; positive and negative lexicons and named as “Pozitif_sozluk.txt” and “negative_sozluk.txt”.
Some words mean 2 different senses. For example “yaz” word means two different meanings as verb and noun. Since Turkish sentences and words are expressing emotion through intuition and implication, such words are examined manually and added to the dictionary according to their positive and negative emotional state.
There were some sarcastic sentences and punctuation words were affect the sentiment of the sentences. These words manually eliminated from txt files of Tweets. For example “Siz de gozunuzu seveyim dusurun fiyatlari, bir insan bu fiyatlarla nasil ucus yapar?” sentences actually not a question expresses a negative emotional state. This is one of the indicators of how difficult it is to work in Turkish language.
Some shortened messages and words, spelling mistakes, URLs, date and numeric data were eliminated and corrected manually.
Doubled sentences and re tweets were deleted with given time series tweets. R studio has its own package named as tm, for the based structure of text files and
documents to keep it in memory corpus structure was used in that part. (Feinerer, 2017)
thycorpus <- Corpus(VectorSource(twcorpus)) # I keep the corpus function as a text body for later analysis along with metadata, here is the data cleanup step.
lapply(thycorpus, function(x) iconv(x, "latin1", "ASCII", sub=""))
thycorpus <- tm_map(thycorpus, function(x) iconv(x, to='UTF-8', sub='byte')) gsub("í"," ",thycorpus)
23
gsub("¼"," ",thycorpus)##nonascii characters were deleted
thycorpus <- tm_map(thycorpus, tolower) # putting text to lower case
thycorpus <- tm_map(thycorpus, removePunctuation) # noktalamaları eledim thycorpus <- tm_map(thycorpus,
function(x)removeWords(x,stopwords())) # stopwords were eliminated
gsub(" ?(f|ht)tp(s?)://(.*)[.][a-z]+", "", thycorpus)#with gsub function https, http, url and retweets were eliminated
gsub("rt", "", thycorpus)
gsub("ã¢â‚¬â„¢ ", "", thycorpus) gsub("ã¢å“ë†ã¯â¸â\\n", "", thycorpus) gsub("ã", "", thycorpus)
gsub("https", "", thycorpus)
Table 7.1: Cleaning of dirty/noisy text data 7.2 Building Model
7.2.1 Stock Value Data
To build predictive model with best fitted, first of all the correlation and regression of the stock value data were determined. In R studio, full data set was taken as input to understand the existing model is really successful or not.
Before applying the classification techniques at this stage, it was found what are the most important features by using the entropy-based information gain method. As can be seen from the table below, for most of the most deterministic values, this ratio is higher than 0.7, regardless of the date for the shared price -PX_ Last- class value. In many of these values, contribution to the information gain of class feature that is not normal and classification methods have been used to confirm these anomalies. With application of different classification techniques the success rate of the model was 65% maximum with K Nearest Neighbor classification method. This success rate does not indicate that the classification method is unmeaningful or has low success rate. Additionally, when class complexity matrix of last year was extracted, it was seen that in the cases where the investment should not be made, the firm directed the investors to investment and
24
this was reflected as 35% wrong decision so the success rate of the current method is 65%.
Figure 7.1: Class Confusion figure of existing model
Figure 7.2: Class Confusion success figure of existing model
That success rate in not too bad and unmeaningful but the purpose of thesis is that is it possible to provide more efficient and powerful method to the investment company. To find best fitted problem to increase the model accuracy with contribution of the best selected attributes. For that purpose, the correlation matrix of the data was created to understand the relation and effect between features.
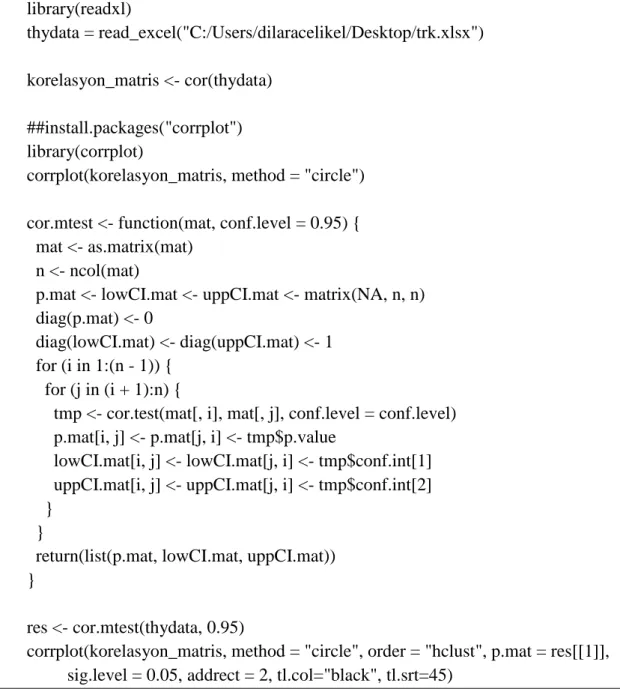
25 library(readxl) thydata = read_excel("C:/Users/dilaracelikel/Desktop/trk.xlsx") korelasyon_matris <- cor(thydata) ##install.packages("corrplot") library(corrplot)
corrplot(korelasyon_matris, method = "circle") cor.mtest <- function(mat, conf.level = 0.95) { mat <- as.matrix(mat)
n <- ncol(mat)
p.mat <- lowCI.mat <- uppCI.mat <- matrix(NA, n, n) diag(p.mat) <- 0
diag(lowCI.mat) <- diag(uppCI.mat) <- 1 for (i in 1:(n - 1)) {
for (j in (i + 1):n) {
tmp <- cor.test(mat[, i], mat[, j], conf.level = conf.level) p.mat[i, j] <- p.mat[j, i] <- tmp$p.value
lowCI.mat[i, j] <- lowCI.mat[j, i] <- tmp$conf.int[1] uppCI.mat[i, j] <- uppCI.mat[j, i] <- tmp$conf.int[2] }
}
return(list(p.mat, lowCI.mat, uppCI.mat)) }
res <- cor.mtest(thydata, 0.95)
corrplot(korelasyon_matris, method = "circle", order = "hclust", p.mat = res[[1]], sig.level = 0.05, addrect = 2, tl.col="black", tl.srt=45)
Table 7.2: Creation of correlation matrix
To create correlation matrix the confidence level was choosen as 0,95 that means if the features have strict and high correlation among each other. There is no standardization for confidence level value but in that thesis the purpose is to find best economic model for investors.
26
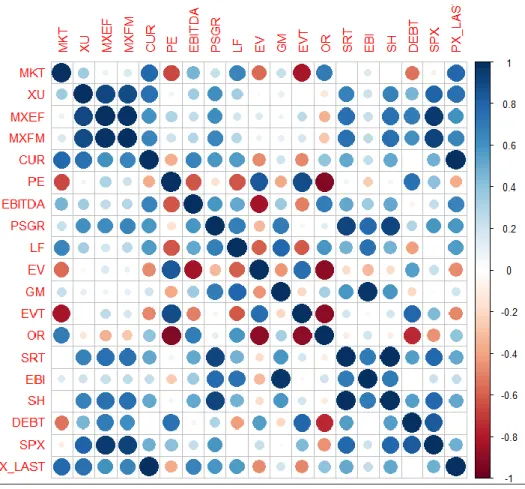
Figure 7.3: Correlation table of dot figure of varibales.
According to the correlation matrix bigger and darker circles notated as the most relevant feature with the other. In that data set dependent variable Share Price named as PX_LAST column has highest correlation with Current Market Cap and named as CUR. There is a direct relation between that CUR and PX_LAST so when building that regression model, CUR column was eliminated. The ratio value was determined as 0,3, if there is a strong correlation among features the indices value getting closer to the 1. To create more successful statistical model with small amount of data it is easy to select good variable set from the data. But if the data set has too many values and features cannot be selected manually there must be only time consuming. And also if that process continue or follow manually, it is possible to lose or not recognize the importance of some attributes. In that case creating systematic subset selection with backward elimination method is the more successful and direct method.
After applying backward elimination method, different regression models were applied to the data set. Feature scaling was applied for whole data set to get more accurate
27
results and to obstruct the domination of any feature. The most successful method observed as Multiple Linear Regression with 95% accuracy rate and 0.59 standart error value with 10 fold cross validated Turkish Airlines data. So as a regression model Multiple Linear Regression was decided to create new investment model.
Table 7.3: Adjusted R square and standart error value of different regression methods.
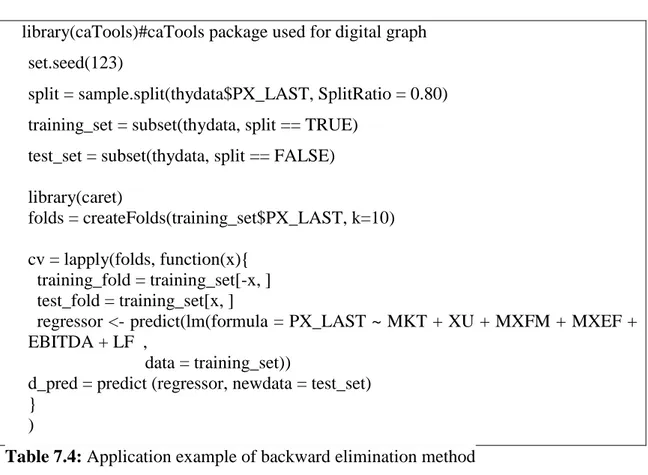
library(caTools)#caTools package used for digital graph set.seed(123)
split = sample.split(thydata$PX_LAST, SplitRatio = 0.80) training_set = subset(thydata, split == TRUE)
test_set = subset(thydata, split == FALSE) library(caret)
folds = createFolds(training_set$PX_LAST, k=10) cv = lapply(folds, function(x){
training_fold = training_set[-x, ] test_fold = training_set[x, ]
regressor <- predict(lm(formula = PX_LAST ~ MKT + XU + MXFM + MXEF + EBITDA + LF ,
data = training_set))
d_pred = predict (regressor, newdata = test_set) }
)
Table 7.4: Application example of backward elimination method
After applying backward elimination, data set were divided into train, test and validation data set splitting data with different ratio with Turkish Airlines ad Pegasus Airlines data separately. Data set separated into training set with 60%, 20% of the data used as validation set and 20% of data set used as test set. The same process was also applied with different ratio to the data set and details are shown in the table below.
28
Train Set Ratio Validation Set Ratio
Test Set Ratio Success Rate of the Model According to Validation Set Success Rate of the Model According to Test Set 60% 25% 15% 96,8% 95,19% 65% 20% 15% 95,99% 96,99% 70% 20% 10% 96,26% 96,84% 75% 15% 10% 96,56% 96,47% 80% 12% 8% 95,94% 96,98%
Table 7.5: Success value of regressor with Turkish Airlines data
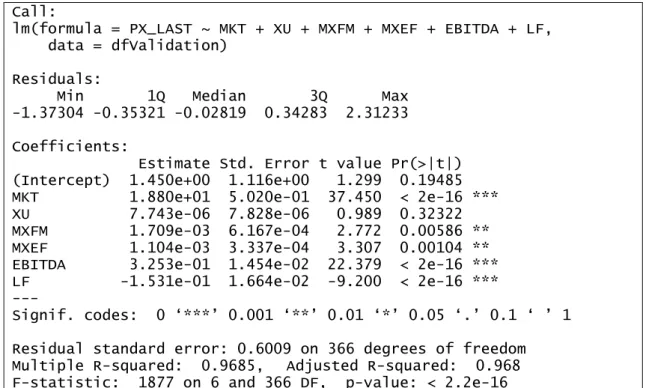
According to the R squared value the most significant features was determined. Most successful model was created with 6 features; MKT + XU + MXFM + MXEF + EBITDA + LF. The summary of the model according to the validation set with 60% ratio of training set is the most successful model for given data.
Call:
lm(formula = PX_LAST ~ MKT + XU + MXFM + MXEF + EBITDA + LF, data = dfValidation)
Residuals:
Min 1Q Median 3Q Max -1.37304 -0.35321 -0.02819 0.34283 2.31233 Coefficients:
Estimate Std. Error t value Pr(>|t|) (Intercept) 1.450e+00 1.116e+00 1.299 0.19485 MKT 1.880e+01 5.020e-01 37.450 < 2e-16 *** XU 7.743e-06 7.828e-06 0.989 0.32322 MXFM 1.709e-03 6.167e-04 2.772 0.00586 ** MXEF 1.104e-03 3.337e-04 3.307 0.00104 ** EBITDA 3.253e-01 1.454e-02 22.379 < 2e-16 *** LF -1.531e-01 1.664e-02 -9.200 < 2e-16 *** ---
Signif. codes: 0 ‘***’ 0.001 ‘**’ 0.01 ‘*’ 0.05 ‘.’ 0.1 ‘ ’ 1 Residual standard error: 0.6009 on 366 degrees of freedom Multiple R-squared: 0.9685, Adjusted R-squared: 0.968 F-statistic: 1877 on 6 and 366 DF, p-value: < 2.2e-16
29
It is possible to say that p value of the EBITDA, LF and MKT seems very low so the significance rate of that values are higher than the others’. Adjusted R square value is an indicator that success rate of the model closer to the 1. In that model the value of R2 equals 0.96 and Multiple R-squared value equals 0.96. Residual square error equals 0.6009. To observe real value and regressor line graph ggplot library was used and also overfitting situation was not observed with that study.
Figure 7.4: Real and training data graph of Turkish Airlines.
Graph shows the 60 percent of the actual data allocated to the training set and the regressor graph generated using this data. Black line shows the real value, red one shows the regressor line.
Figure 7.5: Real and validation data graph of Turkish Airlines.
Graph shows the 25 percent of the actual data allocated to the validation set and the regressor graph generated using this data. Black line shows the real value and green one shows the regressor line.
30
Figure 7.5: Real and test data graph of Turkish Airlines.
Graph shows the 15 percent of the actual data allocated to the validation set and the regressor graph generated using this data. Black line shows the real value and green one shows the regressor line.
In order to validate the success of the multi-linear regression model, it have implemented with Turkish Airlines, same steps were applied for Pegasus Airlines data. Both companies were chosen as case companies because they have publicly traded shares in the same domicile and both in Istanbul stock exchange. Pegasus Airlines were offered to the public in 2013 and stocks were started to be traded as of March 2014. For this reason, the data from this date has been taken into consideration.
Train Set Ratio Validation Set Ratio
Test Set Ratio Success Rate of the Model According to Validation Set Success Rate of the Model According to Test Set 60% 25% 15% 95% 95,3% 65% 20% 15% 96,3% 96,7% 70% 20% 10% 95,7% 96,2% 75% 15% 10% 95,56% 96,5% 80% 12% 8% 96,8% 96,2%
31
It is again possible to say that p value of the EBITDA, LF and MKT seems very low so the significance rate of that values are higher than the others’. Adjusted R square value is an indicator that success rate of the model closer to the 1. In that model the value of R2 equals 0.9694, so again high success rate like the application with Turkish Airlines data and Adjusted R-squared value equals 0.9683. According to the R squared value the most significant features was determined. Most successful model was created with 6 features; MKT + XU + MXFM + MXEF + EBITDA + LF. The summary of the model according to the validation set with 80% ratio of training set is the most successful model for given data is shown in the table below.
lm(formula = PX_LAST ~ MKT + XU + MXFM + MXEF + EBITDA + LF, data = dfValidation)
Residuals:
Min 1Q Median 3Q Max -3.3116 -0.8551 -0.0354 0.8938 3.7863 Coefficients:
Estimate Std. Error t value Pr(>|t|) (Intercept) -1.362e+01 3.673e+00 -3.709 0.000282 *** MKT 2.196e+01 5.665e-01 38.758 < 2e-16 *** XU 4.234e-05 1.831e-05 2.313 0.021954 * MXFM 8.772e-05 1.669e-03 0.053 0.958140 MXEF 5.306e-03 7.760e-04 6.837 1.43e-10 *** EBITDA 5.256e-01 3.143e-02 16.726 < 2e-16 *** LF -2.711e-02 4.749e-02 -0.571 0.568898 ---
Signif. codes: 0 ‘***’ 0.001 ‘**’ 0.01 ‘*’ 0.05 ‘.’ 0.1 ‘ ’ 1 Residual standard error: 1.289 on 168 degrees of freedom
Multiple R-squared: 0.9694, Adjusted R-squared: 0.9683 F-statistic: 888 on 6 and 168 DF, p-value: < 2.2e-16
Table 7.8: Summary of regressor with Pegasus Airlines with validation set
32
Graph shows the 80 percent of the actual data allocated to the training set and the regressor graph generated using this data. Black line shows the real value and red one shows the regressor line.
Figure 7.7: Real and validation data graph of Pegasus Airlines.
Graph shows the 12 percent of the actual data allocated to the validation set and the regressor graph generated using this data. Black line shows the real value and green line shows the regressor line.
Figure 7.8: Real and test data graph of Pegasus Airlines.
Graph shows the 8 percent of the actual data allocated to the validation set and the regressor graph generated using this data. Black line shows the real value, blue line shows the regressor line.
7.2.2 Twitter Text Data
In that part of the study with some hashtags and key words were used with given time series to scrape data for sentiment analysis. The aim of that study label words and clues
33
as positive, negative and neutral sentiment score. The degree of sentiment can be increase or decrease with more positive of least negative etc. And also, word clouds was created to examine number of words in positive and negative lexicons.
Figure 7.9: Word Cloud of Turkish Airlines
Figure 7.10: Word Cloud of Pegasus Airlines
First of all, positive and negative words were determined in 2 text folders. After that to label and determine the sentiment score of that clues score sentiment function was created. Gsub function was used to eliminate characters, punctuation and digits. With tryTolower function errors were handle and also words were split into words with str_split function.
34
Figure 7.11: Preprocessing and polarity steps of text data
In R studio preprocessed text data from the beginning of the October of 2017. All cleaned text data was labeled as positive and negative sentiment score. The data frame sentiments as the difference between positive and negative sentiment score, so the sentiment polarity was handle for 6 months between October 2017 and March 2018.
35
Figure 7.12: Example of sentimental polarity of Tweets
Score column shows the negative and positive values. If the value of score equal 1 or bigger than 1 the sentiment score labeled as positive, if it is zero labeled as neutral and the rest labeled as negative. Sentimental score of the companies are labeled as negative and correlation with 6 monthly stock value data was examined and effect of sentimental score was investigated. Purpose of the study is to investigate whether the tweets in social media have any effect on stocks and share prices. For this purpose, the success of the multiple linear model was observed by reapplying the methods applied with the sentiment scores of Twitter data.
As a final step, the multiple linear regression method that was applied to the stock exchange data and obtained the high success rate was measured by adding twitter data. It was thought that it would not be efficient and effective to make a comparison on a daily basis at this stage. Because, on some days when there are not even the tweets that have been taken on some days, the number of shares made is considerably high and it is thought that the daily measurement to be made in this way will not contribute to the research. For this reason, two measurement ways have been chosen as the method. The first method is the re-application of the regressor by adding the given polarity score obtained on a monthly basis and measuring the success rate of the model again even if the twitter tweet polarity was increasing the success rate of the model or not. For each
36
month of October 2017 and March 2018, a weekly average emotional polarity score was taken and a new model for monthly basis was set up.
As a second method, the mean values of the collective emotional polarities were taken and remeasurement was performed on the monthly basis. The 6 month sentiment score was used to determine the success of the model and the effect of the model was observed with application of regression process. In this way, transactions without Twitter data are restored with data based on sentimental analysis in other words, the financial data was enriched with new labeled sentimental data. On some days, if the number of tweet is more than one, the average polarity value is taken on a day basis and the positive or negative tagged emotional analysis value is matched with the relevant date. If the tweet was not taken on any day to be included in the historical analysis, the emotional value of the previous day was accepted as neutral because it has no positive or negative feeling so neutral is added to the data set by labeling the emotion polarity of non-tweet days as zero.
Train Set Ratio Validation Set Ratio Test Set Ratio Success Rate of the Model According to Validation Set Success Rate of the Model According to Test Set Success Rate of the Model According to Validation Set with Twitter Data Success Rate of the Model According to Test Set with Twitter Data 60% 25% 15% 95% 95,3% 96,3% 96,4% 65% 20% 15% 96,3% 96,7% 96,3% 95,4% 70% 20% 10% 95,7% 96,2% 95% 94,5% 75% 15% 10% 95,56% 96,5% 95,3% 95,3% 80% 12% 8% 96,8% 96,2% 95,05% 95,4%
37 Train Set Ratio Validation Set Ratio Test Set Ratio Success Rate of the Model According to Validation Set Success Rate of the Model According to Test Set Success Rate of the Model According to Validation Set with Twitter Data Success Rate of the Model According to Test Set with Twitter Data 60% 25% 15% 95% 95,3% 95,7% 96% 65% 20% 15% 96,3% 96,7% 96,1% 96,2% 70% 20% 10% 95,7% 96,2% 95,6% 96% 75% 15% 10% 95,56% 96,5% 95,8% 95,8% 80% 12% 8% 96,8% 96,2% 95% 96%
Table 7.10: Success value of regressor via text data with Pegasus Airlines data
When the model was validated again and run on training, validation and test sets, the significance level was used to observe the level of the relationship between the independent variable px_last and tw column. Turkish Airlines’ and Pegasus Airlines’ text data created using the new model was compared with the success of the old model. The success rate of the newly created model was observed as more and less around 1 percent successful/unsuccessful than old calculations.
38 8 RESULTS AND INFERENCES
Twitter Sentimental Analysis and Stock Value prediction are two main basis/concept of structure of this thesis. Machine Learning algorithms and one of the text mining method lexicon based approach were used in two different programming language. At the beginning of the study Impera Capital’s financial analysts has class label for stock exchange data but it was insufficient to make correct prediction and investment for their customer. Analysts generally made a stock price forecast with their experiences and old methods. They were bothering customers about buying or selling shares. It has been tried to provide a decision support system to the Impera Capital in order to make the purchase and sale decisions more accurately and efficiently. With the data provided by the company, experts in the field and the data were ready to be processed. Turkish Airlines and Pegasus Airlines data were used as case study on airways domain.When the classification algorithms were applied the accuracy rate of the model was 67%, was a rather inefficient success rate for investors. Instead, new prediction model was created for company with accuracy rate of 95% above 6 attributes. That means regression model can predict new stock value with accuracy rate of 95% so according to the price value, analysts can help customers make more accurate and efficient decisions to buy or sell. In second part of that study the Twitter data of Turkish Airlines and Pegasus Airlines was studied. “Is it possible to make a more accurate estimation with the polarity score of sentimental analysis made with the tweets covering the 6 months period?” the question whether there is correlation between the stock price and the Twitter data of the companies provided. The success rate of applied machine learning model was not observed as significantly different than without Twitter polarity data. As a conclusion, it can be say that the Twitter data maybe can use as a supportive idea for investments but there is no direct positive or negative correlation between stock value data and sentiment value of the companies due to several factors. The increase or decrease in stock prices are influenced by various factors such as direction of stock market platform structure. Determining what these factors are, determining the power of stocks to influence the direction of price movements is crucial in making investment decisions. Developing country stock markets, including Stock Exchange Istanbul which is one of the sources where the data are obtained, is very clear to speculation. For this reason, stock prices may increase or decrease quite rapidly. Another point is,
39
considering the investing client portfolio, the question of how much they will decide in the context of these messages shared on Twitter is open to debate. It should also be taken into account that the firms content of the study are selected among the top 5 companies listed on the Stock Exchange in Istanbul in the same domain and the possibility that the values of these firms are only influenced by data from social media data from Twitter is crucially low owing to irrelevant subject about stock value of the companies. The issue of whether there is any relation between the prices of stocks traded on the Stock Exchange Istanbul and the Turkish outputs included in the social media sources, especially on Twitter, is a topic with a trend title and a very rare number of studies. It is not possible to generalize with the results obtained, but it provides a decision support system base for investors and investment companies. This study lays the groundwork for a future decision support system as the approach taken and the results are shown to be powerful decisio making tools. The data obtained from the Istanbul Stock Exchange and Bloomberg sources and possible work to be done in the future and the various social media circulars may be included so that the studies can be carried forward.
40
REFERENCES
Seifert J. W. (2004) Data mining: An overview, CRS Report for Congress, The Library of Congress, 2004.
Lee J. (2016) The 10 Algorithms Machine Learning Engineers Need to Know Available
at:https://www.kdnuggets.com/2016/08/10-algorithms-machine-learning-engineers.html/2 (Accessed: 26 Mar. 2018)
Eroğul U. (2009) Sentiment Analysis in Turkish. MSc Thesis, Middle East TechnicalUniversity, Ankara, Turkey.
Vural AG and Cambazoğlu BB. (2012) “A frame work for sentiment analysis in Turkish: Application to polarity detection of movie reviews in Turkish”. 27th International Symposium on Computer and InformationSciences, Paris, France, 3-4 October 2012.
Meral M, Diri B.(2014) “Twitter üzerinde duygu analizi”. IEEE 22. Sinyal İşleme veİletişi Uygulamaları Kurultayı, Trabzon, Türkiye, 23-25 Nisan 2014.
Şimşek M, Özdemir S. (2012)“Analysis of the relation between Turkish twitter messages and stock market index”. 6th International Conference on Application of Information and Communication Technologies (AICT), Tbilisi, Georgia, 17- 19 October 2012.
Türkmenoğlu C, Tantuğ AC.(2014) “Sentiment analysis in Turkish media”. Workshopon Issues of Sentiment Discovery and Opinion Mining (WISDOM ’14), Beijing,China, 21-26 June 2014.
Gidofalvi,Győző. (2004). “Using news articles to predict stock price movements.” Thomson Reuters Tech Talks, 2014. (2014) Available at: https://www.thomsonreuters.com/en.html
Atan, Suat (2016). “Metin Madenciliği ile Sentiment Analizi ve Borsa İstanbul Uygulaması”.
Çoban, Önder., Özyer Barış., Özyer, Gülşah. (2015). “Türkçe Twitter Mesajlarının Duygu Analizi.”
Brownlee J(2014)“What is R?” Available at: https://machinelearningmastery.com/what-is-r/
Feinerer, Ingo (2017).” Introduction to the tm Package Text Mining in R”
41
“Phyton Nedir?” (2014) Available at: https://www.pythontr.com/makale/python-nedir-235(Accessed: 01 May 2018).
Akça M. “Regresyon Analizi Nedir?” Available at: http://mustafaakca.com/regresyon-analizi-nedir/ (Accessed: 01 May 2018).
“What is Multiple Linear Regression?”
Available:http://www.statisticssolutions.com/what-is-multiple-linear-regression/ (Accessed: 01 May 2018).
“Random Forest Regression.” Available at: https://turi.com/learn/userguide/supervised learning/random_forest_regression.html (Accessed: 01 May 2018).
“Top 10 Algorithms”. Available at: https://towardsdatascience.com/a-tour-of-the-top-10-algorithms-for-machine-learning-newbies-dde4edffae11(Accessed: 01 May 2018).
42 APPENDIX
EQUATIONS
Equation 6.1 Multiple linear regression model with two independent variables and affects the formation of the Y dependent variable………..16 Equation 6.2 Multiple linear regression model equation with multipliers of 5 and 7...16 Equation 6.3 Linear regression model equation with more than 2 dependent term...17 Equation 6.4 Simple decision………20