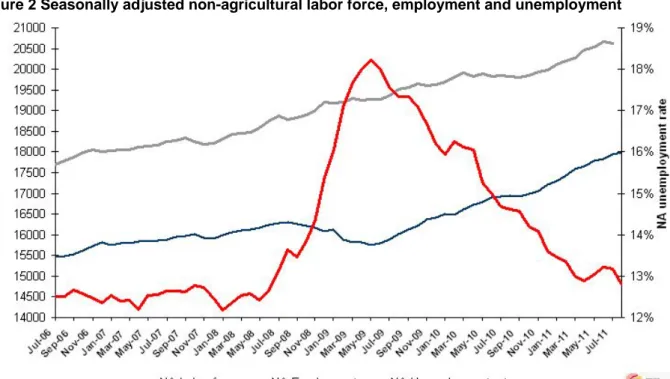
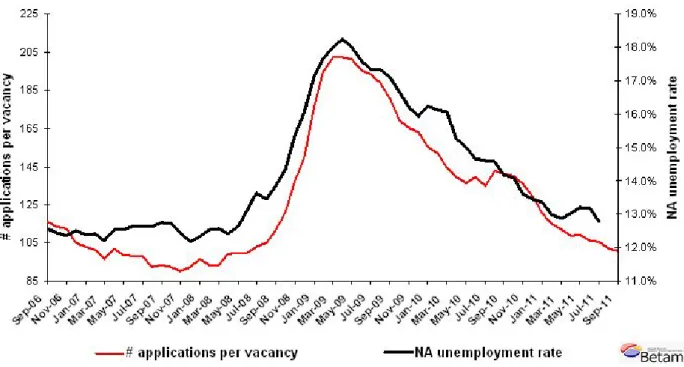
Labor market outlook : October 2011 : unemployment rate is decreasing
Tam metin
Şekil

Benzer Belgeler
Eğitim Durumu Değişkeni ile Örgütsel Değerlerin Çalışanların İş Birliğini Geliştirmesi Faktörünün Analizi için Kruskal-Wallis Testi.. Tablo-51 Eğitim Durumu
Thus, the aim of the study was to ensure the validity and reliability of the scores of M&MF and to validate it as a mental health and well- being measuring scale in
d) İşçiler için düzenlenen sağlık maddeleri sebebiyle, gün içinde 7,5 saat veya az miktarda çalışma durumunda olan işlerde durum farklıdır. Çalışan kişi miktarı, her
Bu çalışmanın temel odak noktası, işletmelerin cevap verme, hız, esneklik ve yetkinlik gibi örgütsel çeviklik yeteneklerini edinmelerinde vizyoner liderliğin rolünü
Vizyoner liderliğin alt boyutlarından iletişim, güvenilirlik, risk, saygı ve lider üye etkileşimi ile rekabet performansı arasındaki ilişkiye öneri olarak;
Furthermore, the study of Haixia and Shiping (2013) examined the existence of volatility spillover effect in the commodity markets of crude oil, corn and fuel ethanol traded
Algılanan Stres Düzeyi Ölçeği, STAI TX-I Sürekli Kaygı Ölçeği,STAI TX-II Durumsal Kaygı Ölçek puanları ve farklarının anne ve baba birliktelik
Bu çalışma vajinismus hastalarında depresyon, özgül fobi, sosyal anksiyete bozukluğu ve panik bozukluğu ek tanı oran- larının oldukça yüksek olduğunu, fakat
