HAPPINESS IN EAST EUROPE IN COMPARISON WITH
TURKEY
BESTE ATAY
110622016
ISTANBUL BILGI UNIVERSITY
INSTITUTE OF SOCIAL SCIENCES
MSc. in Economics
Supervised by:
ENGIN VOLKAN
ii ABSTRACT
THIS PAPER AIMS TO FIND THE DETERMINANTS OF HAPPINESS IN SEVEN EASTERN EUROPEAN COUNTRIES AND TURKEY DURING THE PERIOD
BETWEEN 1994-1999. IN THIS STUDY, TO OVERCOME THE
METHODOLOGICAL LIMITATIONS OF PREVIOUS STUDIES, WE
CONSTRUCT A TWO LEVEL HLM MODEL WHICH ALLOWS US TO FIND THE EFFECTS OF STATE-LEVEL AND INDIVIDUAL-LEVEL VARIABLES ON HAPPINESS LEVELS OF INDIVIDUALS SIMULTANEOUSLY, EMPLOYING A REPRESENTATIVE SURVEY FROM WORLD VALUES SURVEY(WVS). BY ANALYZING STATE-LEVEL AND INDIVIDUAL-LEVEL VARIABLES THAT ARE LIKELY TO AFFECT THE HAPPINESS LEVEL OF AN INDIVIDUAL, THE STUDY EXAMINES WHICH LEVEL OF FACTORS ARE MORE RESPONSIBLE IN THE VARIATION OF HAPPINESS. FURTHERMORE, THE STUDY EXPLORES WHETHER THERE ARE DIFFERENCES IN THE FACTORS
CONTRIBUTING THE HAPPINESS LEVELS ACROSS DIFFERENT
COUNTRIES.
ÖZET
BU MAKALE 1994-1999 YILLARI ARASINDA YEDĐ DOĞU AVRUPA ÜLKESĐNDE VE TÜRKĐYE'DE MUTLULUĞUN DETERMĐNANTLARINI
ÇALIŞMAYI AMAÇLAMAKTADIR. ÇALIŞMADA, WORLD VALUES
SURVEY(WVS) 'DEN ALINAN SURVEYLER KULLANILARAK, DAHA ÖNCEKĐ ÇALIŞMALARDAKĐ METHODOLOJĐK KISITLAMALARI AŞMAK ĐÇĐN, AYNI ANDA KĐŞĐNĐN MUTLULUK DÜZEYĐNĐ ETKĐLEYEN ULUSAL DÜZEYDE VE
KĐŞĐ BAZLI DEĞĐŞKENLERĐN MUTLULUK ÜZERĐNDEKĐ ETKĐSĐNĐ
ÖLÇMEMĐZE ĐZĐN VEREN 2 DÜZEYLĐ HLM MODELĐ OLUŞTURULDU. ÇALIŞMA, KĐŞĐNĐN MUTLULUK DÜZEYĐNĐ ETKĐLEYEN ULUSAL DÜZEYDE VE KĐŞĐ BAZLI DEĞĐŞKENLERĐN ĐNCELENMESĐYLE HANGĐ DÜZEYDEKĐ DEĞĐŞKENLERĐN MUTLULUKTAKĐ DEĞĐŞĐM ÜZERĐNDE DAHA ETKĐLĐ OLDUĞUNU ĐNCELEMEKTEDĐR. BUNUN YANI SIRA, ÇALIŞMA FARKLI ÜLKELERDE MUTLULUĞA ETKĐ EDEN FAKTÖRLERDE DEĞĐŞĐKLĐK OLUP OLMADIĞINI ARAŞTIRMAKTADIR.
iii ACKNOWLEDGEMENTS
I would like to acknowledge my supervisor Engin Volkan for her continuing support and guidance in every step of preparing my thesis.
I would like to express my gratefulness to Hasan Kirmanoğlu for his help and motivation.
Without their great help, I would not be able to complete this study.
Finally, I am deeply thankful to my friends, my family and my professors especially to Ayça Ebru Giritligil and Deniz Nebioğlu for supporting me during my postgraduate study at Istanbul Bilgi University.
iv TABLE OF CONTENTS Abstract ... ii Acknowledgements ... iii 1. Introduction ...1 2. Literature Review ...2 2.1 State-level Variables ...2 2.2 Individual-level Variables ...3 3. Data...5 3.1 Dependent Variable ...5 3.2 Independent Variable ...6 4. Statistical Methods ...8 5. Results ...9
5.1 Results of the Marginal Effects ... 11
5.2 Results of the Cross-country Regression ... 13
5.3 Results of the HLM ... 14
6. Conclusion ... 16
7. Appendix ... 17
v
LIST OF TABLES
Table 1: Summary description of variables.. ...7
Table 2: Summary statistics for Eastern Europe data used in ordered logit model.. ... 17
Table 3: Summary statistics for Turkey data used in ordered logit model ... 19
Table 4: Happiness across countries ... 10
Table 5: Marginal effects of ordered logit model ... 21
Table 6: Ordered logistic regression analysis of happiness.. ... 23
Table 7: Results of the HLM analysis. ... 15
Table 8: Index of Economic Freedom, GDP and HDI values ... 24
1 1. Introduction
In the modern societies, the concept of happiness is not only a scientific research area but also a key topic for the public. In the last few decades, research on the determinants of happiness revealed the economic, sociological and cultural factors influence the happiness levels. However, there are still some problems in the literature some of which we seek to adress with this study.
In previous studies, Eastern European countries during transition period are studied by few. For instance, Easterlin (2009) examines life satisfaction in Eastern Europe in 1990s and analyses who in the population gained and lost in life satisfaction during transition period. His findings indicate that less educated people over 30 years old has suffered most during the transition period regardless of their gender. Lelkes (2006) studies the impact of economic and political transition on happiness for Hungary. Lelkes suggests that the economic transition lowered happiness on average but the impact of economic transition varies for different groups of the society. The most of the previous studies, focused only on the impact of individual-level or state-level variables on happiness level of individuals which caused a crucial limitation in explaining the variation in happiness levels. This paper, different than the related literature e.g. Hayo (2004), accounts for both individual-level and state-level variables that are likely to affect happiness levels. With this study, we will be able to adress the methodological limitations of earlier research on Eastern Europe.
The literature in which developing countries other than Eastern European have been a focus are Namazie and Sanfey (2001), Hayo and Seifert (2003), Gruen and Klasen (2005), Kousha and Mosheni (2000) and Selim (2008). Another study by Mcconatha, Danner, Harmer, Hayta, Polat (2004) compares life satisfaction of adults of Germany, Turkey and U.S. Their findings show that health and economic well-being influence happiness. Among these Selim (2008) investigates happiness and life satisfaction amongst Turkish people across different years. Accordingly, happiness is positively
2 correlated with health, and income, and among the factors under investigation employment has the most significant effect on happiness for Turkey.
Turkey is also studied for our analyses of the determinants of happiness levels of individuals. Although having lower GDP per capita1 than Eastern European countries except Bulgaria and Romania, Turkey reports much higher average national happiness level than the seven Eastern European countries during the period of 1994-1999. The findings of the previous studies suggest that higher levels of GDP per capita contribute to higher levels of happiness. We explore if the relatively higher happiness levels of Turkey during the period of 1994-1999 is a country-spesific situation or a result of the individual-level effects.
This paper investigates both individual-level and state-level variables that might affect happiness levels of individuals. For this reason, employing World Values Survey(WVS) data, a Hierarchical Linear Model (HLM) is used in our analysis which allows us to find the effects of state-level and individual-level variables on happiness levels of individuals simultaneously. Moreover, HLM provides us to control for the individual effects while finding the effects of state-level variables. (Bryk and Raudenbush, 1992). The aim of this study is to find the determinants of happiness for Eastern Europe and Turkey during transition period.
2.Literature Review
In this section, the individual-level and macro-level determinants of happiness reported in previous studies are reviewed.
2.1 State-level Variables
Since the seminal study of Easterlin (1974) which indicated economic growth did not lead to an increase in average happiness levels in U.S. between 1946-1974, there is a vast literature that empirically studies the potential state-level determinants of happiness within or between different countries.
3 For instance, using British Household Panel Study data Clark and Oswald (1994) showed negative impact of unemployment on happiness.2 Frey and Stutzer (2000), using Switzerland survey year-year period data, conclude that the developed institutions of direct democracy leads to happier people. However, Steffen and Vatter (2011) show that democracy does not have a substantive effect on happiness. Moreover, Veenhoven (2000) finds a significant positive effect between economic, political, personal freedom and happiness. Gropper, Lawson, Thorne (2011) also find that higher economic freedom makes people happier.
One of the mostly used state-level variable in Happiness Economics research is Human Development Index (HDI) which simply characterizes development with health, education and income. This index is not only a good source for the happiness research but also a powerful indicator which shows that development is much more than the economic growth. In previous studies, HDI is found to have a strong positive effect on happiness level. The findings indicate that the more unequal the society is the lower the happiness levels are. (Muffels, Skugor and Dingemans, 2012)
2.2 Individual-level Variables
Many studies explored how socio-demographic factors are associated with happiness levels. Overall, wowen report higher happiness levels than men (Hayo’s paper, 2004, Frey and Stutzer, 2002) and married people are happier than others. (Clark and Oswald ,1994 ; Clark 1997; McBride, 2001; Alesina et al., 2004). However, recent studies show that there is no increase in the level of happiness of individuals after marriage. Lucas and Clark (2006) suggest that people adapt to marriage as they adapt a positive life-event. Happy individuals may be more likely to get and stay married, whereas less happy individuals may be more likely to stay single or to get divorced (Johnson and Wu, 2002; Hope et al., 1999).
2
Similar to these studies are Winkelmann, Liliana, Rainer, 1995;Frey and Stutzer, 2000; Clark et al., 2001; Gardner and Oswald, 2002; Frey and Stutzer, 2002; Blanchflower and Oswald, 2004.
4 Several studies report that happiness is approximately U-shaped through the life course.(Blanchflower and Oswald, 2007; Yang, 2008). Another important socio-demographic factor is educational attainment. Many studies reported that higher educational attainment is associated with higher levels of happiness.( Blanchflower and Oswald 2004; Easterlin 2001; Yang 2008). However, we should also take the indirect effects of education on happiness into consideration through income level and labor status. (Cuñado and Gracia,2010).
Studies using data from various countries show that people with higher income levels report higher levels of happiness. (Di Tella, Macculloch and Oswald,2001; Albert and Davia, 2005; Becchetti, Castriota and Londoño, 2006). It has been argued that the positive effect of income on happiness is mainly due to the comparison between self and others (Easterlin 1974), both absolute and relative income is found to have a positive effect on happiness levels. Furthermore, according to previous findings in the Happines Literature, being religious is found to have a positive effect on the happiness levels of individuals.(Swinyard et al.,2000; Hayo ,2004).
On the contrary, Lelkes (2006) suggests that religion has a negative impact on happiness during transition period. She relates her finding that religious people did not become happier as a result of increasing ideological freedom during transition process.
Several studies made about the effects of community size on happiness level, suggest that people living in rural areas are happier than the people living in big cities. (Hayo, 2004; Dale, 1980) Hayo relates his finding to differences in purchasing power suggesting that people can afford more goods in rural areas.
Employment status is an important socio-demographic factor in modern socities. Previous studies showed that being unemployed has a strong negative effect on happiness level. (Clark and Oswald,1994; Winkelmann, Liliana, Rainer, 1995; Frey and Stutzer, 2000; Frey and Stutzer, 2002 ) Unemployment, fosters higher rates of depression and suicide (A. Kposow in Diener and Seligman 2004, p. 12). There is another discussion that happiness and work has a bidirectional relationship. Happy employees have a better
5 performance at work, they are more productive, more punctual and more cooperative, and they show less absenteeism (Diener and Seligman 2004, pp. 10–12).
3. Data
This study draws mainly on data from the 3rd wave of World Values Survey that corresponds to period between 1994-1999. The World Values Survey includes representative surveys of basic values of publics in many societies for all inhabited continents. The World Values Survey consists of five waves (1981-1984, 1989-1993, 1994-1999, 1999-2004, 2005-2008); this study utilizes the third one. The 3rd wave of World Values Survey was chosen because the more recent fourth and fifth wave do not include both the Eastern European countries and Turkey.
Based on the The World Values Survey (WVS) data, the socio-economic and demographic variables for Turkey and seven Eastern European countries, that namely are Czech Republic, Poland, Slovenia, Slovakia, Hungary, Bulgaria, Romania, were selected for the period between 1994-1999. The sample contains 9269 individuals from 8 different countries. The distribution of the sample is: Bulgaria (1997) ,1072 respondents; Czech Republic (1998), 1147 respondents; Hungary (1998) 650 respondents, Poland (1997) 1153 respondents, Romania (1998) 1239 respondents, Slovakia (1998) 1095 respondents, Slovenia(1995) 1007 respondents, Turkey (1996) 1907 respondents.
In this study, country-level variables are taken from the Heritage Foundation and Worldbank. The Index of Economic Freedom data of the eight countries for the year 1999 are drawn from the Heritage Foundation while Human Development Index 1999 data of the same countries was extracted from Worldbank Database.
3.1 Dependent Variable
The dependent variable of this study is the happiness level which indicates how happy an individual with his/her life.
6 The dependent variable is based on the answers given to the following question:
“Taking all things together, would you say you are:
1. Very happy 2. Quite happy 3. Not very happy 4. Not at all happy”
The possible answers to these question range from 1 (Very happy) to 4 (Not at all happy) but in order to get an ordering analogous to other survey questions, answers were recoded as 1 (Not at all happy) to 4 (Very happy) .
3.2 Independent Variables
Age, gender, marital status, educational level, employment status, community size, income level of the individual were included into our model as they are the potential socio-economic and demographic determinants of happiness known from the previous studies. (Hayo, 2004 and Selim, 2008) Besides, religiousity was included in this study to find whether being religious has a significant effect on happiness during the transition period in accordance with Hayo’s(2004) paper. From the variable gender only female was included into model since being female is known to have a positive effect on happiness level ( Frey and Stutzer, 2002) While marital status had six different categories (single, married, divorced, living together, seperated and widowed) this study takes two categories into account: married and divorced. The variable educational level corresponds to the answers of the question “ highest educational level attained” has eight different categories: Inadequately completed elementary education, Completed elementary education, Incomplete secondary school: technical/vocational school, Complete secondary school: technical/vocational school, Incomplete secondary: university-preparation type, Complete secondary school: university-preparation type, Some university without degree/higher education, University with degree/higher education. The income level of the individual is divided into eight different categories. The employment status of the individual is categorized as full-time, part-time, retired, housewife, self-employed, students and unemployed.
7 In this study, we only use the category unemployed to find the effects of being unemployed in the happiness level. The variable community size is seperated into eight different categories: 2,000 and less, 2,000-5,000, 5,000-10,000, 20,000/ 10,000-25,000, 20,000-50,000, 50,000-100,000, 100,000-500,000 and 500,000 and more.
Country-level variables used in this study are Index of economic freedom and HDI. The Index of economic freedom is the measurement of degree of economic freedom by 10 broad factors: Business Freedom, Labor Freedom, Monetary Freedom, Government Size / Spending, Fiscal Freedom, Property Rights, Investment freedom, Financial Freedom, Freedom from corruption, Labor Freedom. The 10 factors are averaged equally to a total score. This variable was included into our study to investigate if increasing economic freedom during the economic transition period affected the happiness levels of the individuals or not. The variable, HDI is the weighted sum of the indexes: Life Expectancy Index, Education Index, Adult Literacy Index, Gross Enrolment Index and GDP according to the UNDP’s calculation method prior to 2011. By including HDI into analysis, we aim to find the impact of country-level HDI values on the happiness levels of the individual.
The variables included in this study and their measurements are summarized in Table 1.
Table 1 Summary description of variables
Type of Variable Variables Measurement Source of Data
Dependent variable Happiness 1: Very happy 2: Quite happy WS
3:Not very happy 4:Not at all happy Independent variable
Individual-level
Age(years) 18-93 WS
Education WS
1:Inadequately completed 2:completed (compulsory)
elementary education elementary education
3:incomplete secondary school: 4:complete secondary school: technical/vocational school technical/vocational school
5:incomplete secondary: 6:complete secondary:
university-preparation university-preparation
7:some university without 8:university with degree
8
Income Level WS
1: first step 5: fifth step
2: second step 6: sixth step
3: third step 7: seventh step
4: fourth step 8: eighth step
Community Size WS
1:2,000 and less 2:2,000-5,000
3:5,000-10,000 4:10,000-20,000/10,000-25,000
5:20,000-50,000 6:50,000-100,000
7:100,000-500,000 8:500.000 and more
Female 1: Female 0: Male WS
Married 1: Married 0: Not married WS
Unemployed 1: Unemployed 0:Employed WS
Age Squared
324-8649 WS
Religiousity
3:A religious person 2: Not a religious person
1:A convinced Atheist WS
State-level Economic Freedom Index of Economic Freedom HF
Human Development Index(HDI) Human Development Index(HDI) WB
4.Statistical Methods
HLM, also called as multilevel analyses models or random coefficients models, are used to estimate cross-sectional linear models. The HLM model allows us to conduct regressions at two levels which provides us to find the effects of state-level and individual variables simultaneously.
Our aim is to find the effects of both individual level and state-level variables on happiness because the happiness level of an individual is likely to be affected by both individual-level and state-level variables. In order to estimate the impact of country-level variables on happiness level, it is necessary to control for variations of socio-economic
9 and demographic variables at individual level. HLM is a statistical procedure that enables us an estimation of country-level effects while controlling for variations in individual-level characteristics (Bryk and Raudenbush, 1992, See also Cohen and Huffman 2003).
In traditional regression models such as OLS regression, a single level of analysis is selected for the individual and the state while analyzing this type of multilevel data. This leads to a violation in the assumption upon which the model’s efficient estimation and hypothesis testing is based- independence of the error terms with constant variance. ( Kim, Lee and Lee, 2010). The HLM prevents this by partioning the error structure into components at the individual level and at the country level. (Bryk and Raudenbush, 2002). For all these reasons and the advantages of HLM over the alternative models, HLM was used throughout our analysis.
5. Results
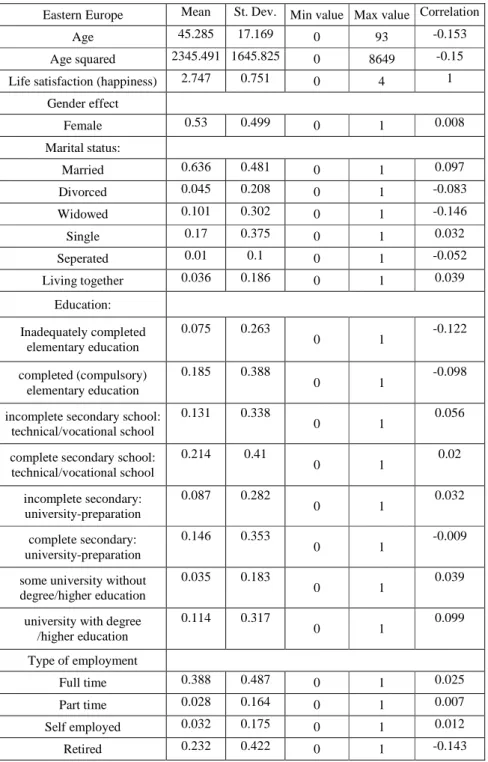
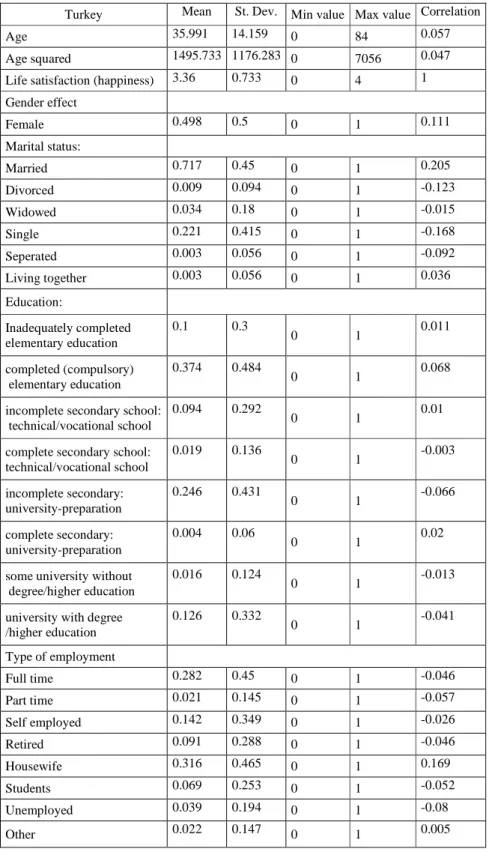
Descriptive statistics of the variables for Eastern Europe and Turkey are reported seperately in Table 2 and Table 33. Means of the variables given in the first columns of Table 2 and Table 3 correspond to percentages of the variable in that category.
The average of happiness for Eastern Europe and Turkey, given in the first columns of Table 2 and Table 3, indicate that the average happiness of Turkey (3.36) is relatively larger than the average happiness of Eastern Europe (2.75).
The last columns of Table 2 and Table 3 presents Pearson’s correlation coeficients of socio-economic and demographic variables. Our results indicate that married people are happier than divorced people both for Eastern Europe and Turkey. According to our results, for Eastern European countries, the happiest group of people are from married, well-educated, middle-class, Catholic people. We also found that people from the groups unemployed, retired, inadequately educated, lower class and Ortodox are the least happiest group for Eastern European countries.
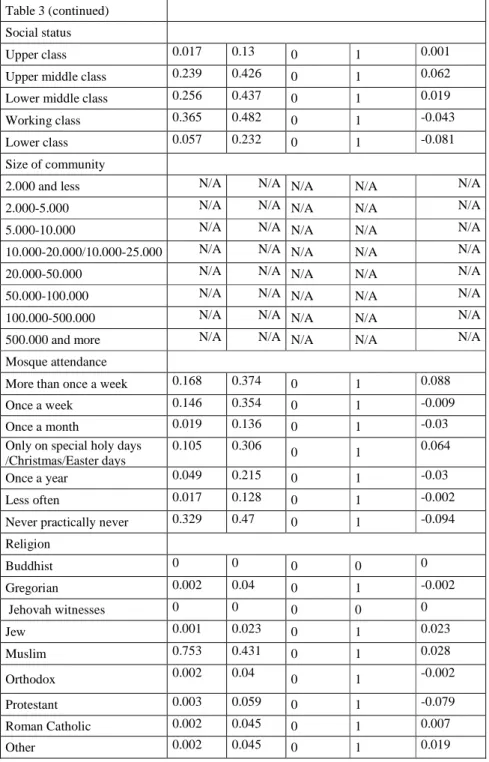
10 Our results indicate that, for Turkey, people who are unemployed, lower class and non-church goers are the less happier than housewifes, married people, upper middle class people, people with religion practice only on holy days and those who completed compulsory education. On the other hand, Turkish people with religion practice of more than once a week are happier than Eastern European people of the same category.There is a negative correlation between happiness and age for Turkey in contrast with the correlation results of Eastern Europe.
As a result, people from the groups married, upper middle class, well-educated are happier than the people who are divorced, widowed, unemployed and those who belong to lower class for Eastern Europe and Turkey. As opposed to Eastern European education results in Turkey, people completed compulsory education are happier than university graduates. Our results indicate that, females and older people are happier in Turkey than Eastern Europe. Our Eastern Europe results are consistent with Hayo’s correlation findings for Eastern Europe. In Table 4, we compare national happiness levels of each country. The results are computed by calculating arithmetic mean of happiness variable (dependent variable) for each country in our sample.
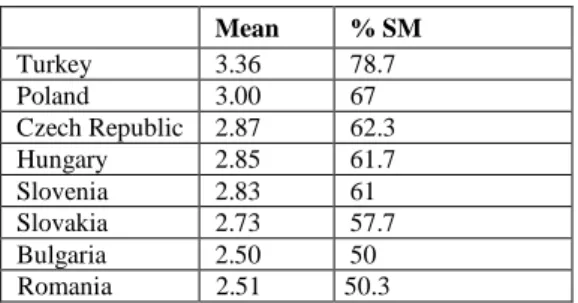
Table 4: Happiness across countries
Note: Mean is the arithmetic mean of answers. SM4 % is the percentage of scale maximum
The happiness averages (means) are ordered from highest to lowest for the 8 countries in our sample. According to country averages, Turkey ranks the highest followed by Poland and Czech Republic. The lowest happiness levels are reported by Bulgaria and Romania.
4 The %SM is computed as (Likert score – 1) / (Number of points on Likert scale –1)*100.
Mean % SM Turkey 3.36 78.7 Poland 3.00 67 Czech Republic 2.87 62.3 Hungary 2.85 61.7 Slovenia 2.83 61 Slovakia 2.73 57.7 Bulgaria 2.50 50 Romania 2.51 50.3
11 One way of comparing country averages across different studies with differences in the scale of the happiness variable is via the percentage of scale maximum (%SM) (Hayo, 2004) The representative scale maximum value for Western Europe is found as 75 % with a standard deviation of 2.5 % by Cummins (2000, 136f).
None of our Eastern Europe scale maximum results is equal or higher than the reference value of Cummins for Western Europe (75 %). This result shows that the happiness levels of Western Europe is relatively larger than Eastern Europe.
Freeman and Blanchflower‘s (1997) finding that life satisfaction is lower in Eastern Europe than the West supports our results. The scale maximum results in our analysis are different for Czech Republic and Slovakia. He finds % SM of Czechs and Slovaks significantly above the reference value. According to our findings, Czechs and Slovaks are less happier than Western Europe.
Furthermore, the scale maximum result of Turkey is above the reference scale maximum value of Cummins for Western Europe. This result is not surprising since Turkey reports higher happiness average values (3.36) than the entire Eastern Europe (2. 75).
5.1 Results of the Marginal Effects
While calculating the marginal effects, individual variables chosen as potential determinants of happiness from the original dataset: age, age squared, sex, marital status, education level, employment status, religion, religion practice and community size and country dummies are included.
In Table 55, marginal effects of the socio – economic and demographic variables for the individual level variables are reported. For dummy variables, the marginal effects are the discrete change between 0 and 1.
12 Turkey has a higher average happiness level than Poland; correspondingly, marginal effects for country dummies shows that transforming a Polish into a Turkish person raises the probability of being “very happy” by 18 % and lowers the probability of being “not at all happy” by 2 %.
All other country dummies except Turkey is negative for the category “very happy” and “quite happy” which corresponds to a decrease in happiness when we change the nationality of the respondent. For instance, transforming a Polish into a Bulgarian lowers the probability of being “very happy” by 9.2 % and raises the probability of being “not at all happy” by 3.5 %.
The change in probability of being “not very happy” becomes relatively large (21.5 %) while transforming a Polish into Romanian. Apart from country dummies, the results for individual level variables of the first category has the opposite sign of the last two categories. National differences are more important than the changes for the individual level variables parallel to Hayo‘s (2004) findings. For instance, to keep the probability of being “very happy” constant after transforming a Polish into Romanian, he needs to have a religous practice of more than once a week.
In the interpretation of marginal effects of individual variables, age has a non-linear relationship with happiness. Getting one year older increases the probability of being “not at all happy” by 0.08 % and lowers the probability of being “very happy” by 0.4 %. Furthermore, being married has a positive effect on happiness. Being married (living together) increases the probability of being “very happy” at a great rate 7.67 % (8 %). Other socio–economic and demographic variables such as unemployment decreases the probability of being “not very happy” by 7.2 % and “not at all happy” by 2.4 %. Being in the upper class has a smaller marginal effect on being “not at all happy” than we could expect.
13 Being in upper class (upper middle) decreases the probability of being “very happy” by 12 % (17 %) while increasing the probability of being “not at all happy” by 1.3 % (1.7 %).
5.2 Results of the Cross- country Regression
In Table 66, ordered logistic regression results for the countries: Czech Republic, Poland, Slovenia, Slovakia, Hungary, Bulgaria, Romania and Turkey are reported. For Bulgaria, age, age squared, educational level, unemployed, being married and being divorced is found to be significantly related with happiness levels. For Slovakia, age, age squared, being married, educational level, income level and being unemployed has a statistically significant relationship with happiness. Furthermore, for Slovenia, being married, community size, being unemployed and educational level is significantly associated with happiness. In the results of Czech Republic, being married, being divorced, educational level and being unemployed has a significant relationship with happiness. And for Turkey, being female, being married and religiousity is significantly associated with happiness levels. For Poland, educational level, age, age squared, female and being divorced has a statistically significant relationship with happiness. For Romania, the variables age, age squared, educational level, community size, religiousity and income level is highly significant. For Hungary, the variables age, age squared, educational level, married, unemployed are significantly related with happiness.
The negative influence of older age, being divorced and being unemployed on happiness levels exists for all the countries. Moreover, the positive effect of being married, educational level, income level on happiness levels is true for all the countries except Turkey. For Turkey, educational level has a significant negative effect on happiness level.
14 5.3 Results of the HLM
Table 7 shows the results of HLM model that includes both individual-level and country-level variables to explain the variation in happiness country-level. Among these state-country-level variables, HDIis found to have a significant positive effect to the happiness level. Other state-level variable Index of Economic Freedom also has a positive relationship with happiness. With regard to individual-level variables, all the variables included has a significant relationship with happiness. Among these, age is negatively associated with the happiness levels. This result is not surprising and consistent with the previous studies. Furthermore, being female and being married increases the level of happiness7 whereas being divorced and unemployed decreases the happiness levels at an important rate8. The variable religiousity, income level and the community size has a positive effect on the happiness levels.
Spesifically, at individual level variables, the educational level variable has a negative effect on the happiness level when we interact it with the education variable. However, HDI continues to have a significant positive effect on the happiness level. This result clearly demonstrates us that educational level has a positive effect on the happiness level because of the high levels of HDI in the more developed countries.
7
Similar studies are Clark and Oswald (1994), Clark (1997), McBride (2001), Alesina et al.(2004), Blanchflower and Oswald (2004), Brereton et al. (2008) and Caporale et al. (2009), Diener, Gohm, Suh and Oishi (undated)
8
Similar studies are Winkelmann, Liliana, Rainer (1995), Hayo (2004), Clark et al. (2001) and Blanchflower and Oswald (2004)
15
Table 7: Results of the HLM analysis of factors relating to happiness levels ofindividual
*p<.05; **p<.01;*** p<.001
Fixed Effects Coefficients SE Odds-ratio t-ratio
Intercept -4.522.251* 1.588.550 0.010865 -2.847
State-level Variables
Economic Freedom 0.133413** 0.021475 1.142.722 6.213
Human Devolopment Index (HDI) -11.732951** 2.335.404 0.000008 -5.024
Individual-level Variables
Age -0.047575*** 0.007830 0.953539 -6.076
Educational level -0.319836* 0.123763 0.726268 -2.584
Economic Freedom 0.006040*** 0.001678 0.993979 -3.599
Human Devolopment Index (HDI) 1.047110*** 0.185121 2.849.405 5.656
Income Level 0.186360 0.120101 1.204.856 1.552 Community Size 0.052933*** 0.011164 1.054.359 4.741 Female 0.127558** 0.044613 1.136.051 2.859 Married 0.738177*** 0.055291 2.092.118 13.351 Divorced -0.488910*** 0.115723 0.613295 -4.225 Unemployed -0.496623*** 0.092699 0.608582 -5.357 Age Squared 0.000332*** 0.000081 1.000.332 4.089 Religiousity 0.087547*** 0.025197 1.091.494 3.475 Variance Components Intercept 0.11762*** Level-1 error 1.00 N(individual) 9269 N (country) 8
16 6. Conclusion
In this paper, using HLM both individual-level and macro-level factors related with happiness are taken into account simultaneously. Both the state-level variables, HDI and Index of Economic Freedom is found to have a significant positive effect on the happiness level. All the individual-level variables, including age, gender, marital status, educational level, employment status, community size and religiousity are found significantly associated with happiness. Accordingly, we can say that happiness levels is both related to individual-level and macro-level factors. A multilevel approach should be used while exploring the potential determinants of happiness.
Based on our findings in this study, the happiness levels of individuals has significant relationship with socio-economic and demographic factors. More spesifically, younger age, being female, being married, being religious, higher income level, higher educational level and living in cities contribute to higher levels of happiness whereas being unemployed and being divorced cause lower levels of happiness. However, as we interact HDI with education variable, we can see that the positive effect of educational level transforms into a negative effect. This result indicates us that the positive effect of educational variable on happiness is caused by the higher HDI values of more developed countries. This is a new result that proves higher levels of happiness is not associated with higher educational levels but higher HDI values.
This study has some restrictions that should be taken into account. For instance, all state-level variables that are likely to affect happiness state-levels such as GDP per capita, democracy, political stability, government effectiveness and other institutional factors are not included in this study. Moreover, due to limitations of the data set, Western European countries, Mediterranean countries could not be included into our analysis. Also, some characteristics of the individuals might be associated with happiness levels such as expectations, interpersonal trust are not taken into account in this study.
17 7. APPENDIX
Table 2: Summary statistics for Eastern Europe data used in ordered logit model ( 7362 cases )
Eastern Europe Mean St. Dev. Min value Max value Correlation
Age 45.285 17.169 0 93 -0.153
Age squared 2345.491 1645.825 0 8649 -0.15
Life satisfaction (happiness) 2.747 0.751 0 4 1
Gender effect Female 0.53 0.499 0 1 0.008 Marital status: Married 0.636 0.481 0 1 0.097 Divorced 0.045 0.208 0 1 -0.083 Widowed 0.101 0.302 0 1 -0.146 Single 0.17 0.375 0 1 0.032 Seperated 0.01 0.1 0 1 -0.052 Living together 0.036 0.186 0 1 0.039 Education: Inadequately completed elementary education 0.075 0.263 0 1 -0.122 completed (compulsory) elementary education 0.185 0.388 0 1 -0.098
incomplete secondary school: technical/vocational school
0.131 0.338
0 1 0.056
complete secondary school: technical/vocational school 0.214 0.41 0 1 0.02 incomplete secondary: university-preparation 0.087 0.282 0 1 0.032 complete secondary: university-preparation 0.146 0.353 0 1 -0.009
some university without degree/higher education
0.035 0.183
0 1 0.039
university with degree /higher education 0.114 0.317 0 1 0.099 Type of employment Full time 0.388 0.487 0 1 0.025 Part time 0.028 0.164 0 1 0.007 Self employed 0.032 0.175 0 1 0.012 Retired 0.232 0.422 0 1 -0.143
18 Table 2 (continued) Housewife 0.047 0.211 0 1 0.008 Students 0.033 0.178 0 1 0.065 Unemployed 0.065 0.246 0 1 -0.085 Other 0.016 0.126 0 1 0.005 Social status Upper class 0.009 0.094 0 1 0.034
Upper middle class 0.115 0.319 0 1 0.107
Lower middle class 0.379 0.485 0 1 0.128
Working class 0.345 0.475 0 1 -0.056 Lower class 0.102 0.303 0 1 -0.213 Size of community 2.000 and less 0.22 0.414 0 1 -0.054 2.000-5.000 0.12 0.325 0 1 -0.041 5.000-10.000 0.069 0.254 0 1 -0.011 10.000-20.000/10.000-25.000 0.088 0.284 0 1 -0.015 20.000-50.000 0.081 0.272 0 1 -0.004 50.000-100.000 0.068 0.252 0 1 -0.012 100.000-500.000 0.109 0.311 0 1 0.045 500.000 and more 0.087 0.282 0 1 0.026 Church/mosque attendance
More than once a week 0.051 0.22 0 1 0.024
Once a week 0.19 0.392 0 1 0.059
Once a month 0.115 0.319 0 1 0.002
Only on special holy days /Christmas/Easter days
0.206 0.405
0 1 -0.019
Never practically never 0.237 0.425 0 1 0.003
Once a year 0.057 0.231 0 1 -0.004 Less often 0.143 0.35 0 1 -0.064 Religion Buddhist 0 0.016 0 1 0.006 Greek Catholic 0.004 0.063 0 1 0.007 Jew 0.002 0.04 0 1 -0.013 Muslim 0.019 0.136 0 1 -0.089 Orthodox 0.23 0.421 0 1 -0.161 Protestant 0.056 0.229 0 1 0.003 Roman Catholic 0.614 0.487 0 1 0.197 Hindu 0 0.02 0 1 0.025 Hussite 0.001 0.033 0 1 -0.011
19
Table 3: Summary statistics for Turkey data used in ordered logit model ( 1907 cases )
Turkey Mean St. Dev. Min value Max value Correlation
Age 35.991 14.159 0 84 0.057
Age squared 1495.733 1176.283 0 7056 0.047
Life satisfaction (happiness) 3.36 0.733 0 4 1
Gender effect Female 0.498 0.5 0 1 0.111 Marital status: Married 0.717 0.45 0 1 0.205 Divorced 0.009 0.094 0 1 -0.123 Widowed 0.034 0.18 0 1 -0.015 Single 0.221 0.415 0 1 -0.168 Seperated 0.003 0.056 0 1 -0.092 Living together 0.003 0.056 0 1 0.036 Education: Inadequately completed elementary education 0.1 0.3 0 1 0.011 completed (compulsory) elementary education 0.374 0.484 0 1 0.068
incomplete secondary school: technical/vocational school
0.094 0.292
0 1 0.01
complete secondary school: technical/vocational school 0.019 0.136 0 1 -0.003 incomplete secondary: university-preparation 0.246 0.431 0 1 -0.066 complete secondary: university-preparation 0.004 0.06 0 1 0.02
some university without degree/higher education
0.016 0.124
0 1 -0.013
university with degree /higher education 0.126 0.332 0 1 -0.041 Type of employment Full time 0.282 0.45 0 1 -0.046 Part time 0.021 0.145 0 1 -0.057 Self employed 0.142 0.349 0 1 -0.026 Retired 0.091 0.288 0 1 -0.046 Housewife 0.316 0.465 0 1 0.169 Students 0.069 0.253 0 1 -0.052 Unemployed 0.039 0.194 0 1 -0.08 Other 0.022 0.147 0 1 0.005
20
Table 3 (continued) Social status
Upper class 0.017 0.13 0 1 0.001
Upper middle class 0.239 0.426 0 1 0.062
Lower middle class 0.256 0.437 0 1 0.019
Working class 0.365 0.482 0 1 -0.043
Lower class 0.057 0.232 0 1 -0.081
Size of community
2.000 and less N/A N/A N/A N/A N/A
2.000-5.000 N/A N/A N/A N/A N/A
5.000-10.000 N/A N/A N/A N/A N/A
10.000-20.000/10.000-25.000 N/A N/A N/A N/A N/A
20.000-50.000 N/A N/A N/A N/A N/A
50.000-100.000 N/A N/A N/A N/A N/A
100.000-500.000 N/A N/A N/A N/A N/A
500.000 and more N/A N/A N/A N/A N/A
Mosque attendance
More than once a week 0.168 0.374 0 1 0.088
Once a week 0.146 0.354 0 1 -0.009
Once a month 0.019 0.136 0 1 -0.03
Only on special holy days /Christmas/Easter days
0.105 0.306
0 1 0.064
Once a year 0.049 0.215 0 1 -0.03
Less often 0.017 0.128 0 1 -0.002
Never practically never 0.329 0.47 0 1 -0.094
Religion Buddhist 0 0 0 0 0 Gregorian 0.002 0.04 0 1 -0.002 Jehovah witnesses 0 0 0 0 0 Jew 0.001 0.023 0 1 0.023 Muslim 0.753 0.431 0 1 0.028 Orthodox 0.002 0.04 0 1 -0.002 Protestant 0.003 0.059 0 1 -0.079 Roman Catholic 0.002 0.045 0 1 0.007 Other 0.002 0.045 0 1 0.019
21
Table 5: Marginal effects of ordered logit model
Very happy Quite happy Not very happy Not at all happy Country dummies Bulgaria -0.092*** -0.108* 0.157** 0.035* Czech -0.02 -0.009 0.023 0.004 Hungary 0.007 0.002 -0.007 -0.001 Romania -0.123*** -0.157** 0.215*** 0.052** Slovenia -0.032 -0.017 0.039 0.007 Slovakia -0.055* -0.038 0.075* 0.014 Turkey 0.181** -0.025 -0.129*** -0.021*** Age -0.004** -0.001** 0.005** 0.001** Age squared 0* 0* 0* 0* Gender effect Female 0.019** 0.006** -0.021** -0.004** Marital status: Married 0.077*** 0.041*** -0.096*** -0.018*** Divorced -0.049*** -0.036* 0.069** 0.013* Widowed -0.03* -0.016 0.038* 0.007 Seperated -0.084*** -0.116 0.155** 0.036* Living together 0.08** -0.005 -0.063*** -0.01*** Education: Inadequately completed elementary education -0.035** -0.019 0.044* 0.008* Completed(compulsory) elementary education -0.034 -0.015* 0.04** 0.007**
Incomplete secondary school:
technical/vocational school -0.01 -0.004 0.011 0.002
Complete secondary school:
technical/vocational school -0.013 -0.005 0.015 0.003
Incomplete secondary:
university-preparation -0.021 -0.009 0.025 0.004
Some university without degree
/higher education 0.012 0.003 -0.012 -0.002
University with degree
/higher education 0.019 0.004* -0.019 -0.003
Type of employment
Full time -0.046 -0.02 0.054 0.01
22 Table 5 (continued) Self employed -0.045 -0.03 0.061 0.012 Retired -0.053* -0.031 0.068 0.013 Housewife 0.023 0.005 -0.023 -0.004 Students -0.016 -0.007 0.018 0.003 Unemployed -0.072*** -0.072* 0.114** 0.024* Social status Upper class 0.124* -0.025 -0.083*** -0.013***
Upper middle class 0.166*** -0.033** -0.111*** -0.018***
Lower middle class 0.12*** 0.011* -0.109*** -0.018***
Working class 0.076*** 0.014*** -0.074*** -0.013*** Size of community 2.000 and less -0.043*** -0.023** 0.053*** 0.01** 2.000-5.000 -0.04*** -0.023* 0.052** 0.01** 5.000-10.000 -0.026 -0.013 0.032 0.006 10.000-20.000/10.000-25.000 -0.044*** -0.028* 0.058** 0.011** 20.000-50.000 -0.04** -0.025* 0.053** 0.01* 50.000-100.000 -0.034** -0.019 0.043* 0.008* 100.000-500.000 -0.009 -0.003 0.01 0.002 Church/mosque attendance
More than once a week 0.124*** -0.016 -0.09*** -0.014***
Once a week 0.063*** 0.007** -0.059*** -0.01***
Once a month 0.05** 0.005 -0.045*** -0.008***
Only on special holy days/ feast days 0.046*** 0.007*** -0.044*** -0.007***
Once a year 0.033 0.005*** -0.031* -0.005* Less often 0.016 0.004 -0.016 -0.003 Religion Buddhist 0.403 -0.235 -0.143 -0.021 Greek Catholic 0.189 -0.065 -0.105 -0.016 Jew 0.165 -0.049 -0.098 -0.015 Muslim 0.098 0.003 -0.084 -0.014 Orthodox 0.135 -0.006 -0.107 -0.018 Protestant 0.129 -0.024 -0.088 -0.014 Roman Catholic 0.107 0.03 -0.113 -0.02 Other -0.063** -0.062 0.099 0.021 *p<.05; **p<.01;*** p<.001
23
Table 6: Ordered logistic regression analysis of happiness: Bulgaria, Czech Republic, Hungary, Poland, Slovakia, Slovenia, Romania and Turkey
Bulgaria
Model 1: Full Model
Slovakia
Model 1:Full Model
Age -0.091*** Age -0.116***
Age Squared 0.001** Age Squared 0.001***
Educational level 0.124*** Educational level 0.101**
Income Level 0.017 Income Level 0.073**
Community Size 0.041 Community Size -0.009
Female -0.034 Female 0.163 Married 0.794*** Married 0.808*** Divorced -0.732* Divorced -0.253 Unemployed -0.534** Unemployed -0.691** Religiousity 0.037 Religiousity 0.198* Pseudo-R2 0.063 Pseudo-R2 0.048 Observations 1071 Observations 1095
Czech Republic Slovenia
Age -0.051 Age -0.011
Age Squared 0 Age Squared 0
Educational level 0.124** Educational level 0.144***
Income Level 0.018 Income Level
Community Size Community Size 0.061*
Female 0.218 Female -0.062 Married 0.656*** Married 0.573*** Divorced -0.988*** Divorced -0.528 Unemployed -142138*** Unemployed -0.59* Religiousity 0.13 Religiousity 0.068 Pseudo-R2 0.064 Pseudo-R2 0.045 Observations 1147 Observations 1007 Hungary Turkey Age -0.104*** Age -0.017
Age Squared 0.001** Age Squared 0
Educational level 0.095* Educational level -0.039
Income Level Income Level 0.037
Community Size 0.022 Community Size
Female 0.183 Female 0.574*** Married 0.903*** Married 1.02*** Divorced 0.088 Divorced -0.785 Unemployed -0.644* Unemployed 0.157 Religiousity 0.065 Religiousity 0.094* Pseudo-R2 0.043 Pseudo-R2 0.038
24 *p<.05; **p<.01;*** p<.001
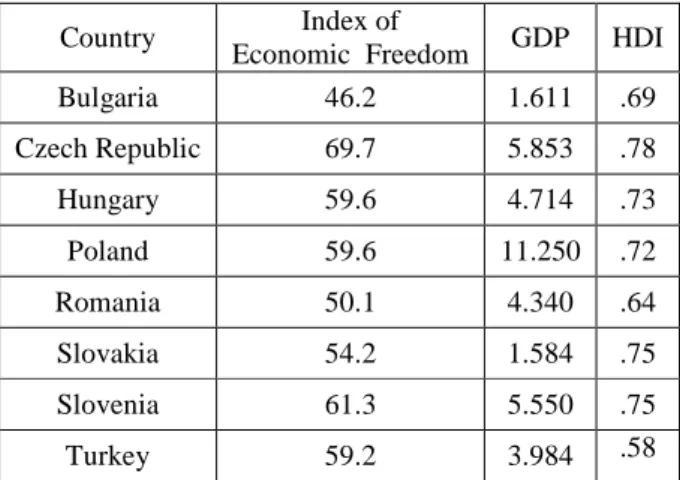
Table 8: Index of Economic Freedom, GDP and HDI values
Sources: Index of Economic Freedom (1999): the Heritage Foundation; HDIvalues(1999) : Worldbank Database; GDP per capita (1999): Worldbank.
Table 9: Most Recent National Happiness Values
Source: World Map of Happiness, Asep JDS, World Values Survey
Observations 650 Observations 1907
Poland Romania
Age -0.089*** Age -0.072**
Age Squared 0.001** Age Squared 0.001**
Educational level 0.136*** Educational level 0.097**
Income Level 0.232 Income Level 0.332***
Community Size 0.023 Community Size 0.064**
Female 0.106*** Female 0.024 Married 1.324 Married 0.345* Divorced -0.282*** Divorced -0.549 Unemployed Unemployed -0.38 Religiousity -0.032 Religiousity 0.23** Pseudo-R2 0.102 Pseudo-R2 0.048 Observations 1153 Observations 1239 Country Index of
Economic Freedom GDP HDI
Bulgaria 46.2 1.611 .69 Czech Republic 69.7 5.853 .78 Hungary 59.6 4.714 .73 Poland 59.6 11.250 .72 Romania 50.1 4.340 .64 Slovakia 54.2 1.584 .75 Slovenia 61.3 5.550 .75 Turkey 59.2 3.984 .58 Bulgaria 2006 115,5 Czech Republic 2001 156 Hungary 2001 150,2 Poland 2005 179,3 Romania 2005 111,3 Slovakia 1999 139,9 Slovenia 2005 161,1 Turkey 2007 172,4
25 8. References
Agresti, A. (1990). Categorical data analysis. New York: John Wiley.
Alesina et al. (2004). A. Alesina, R. Di Tella, R. MacCulloch Inequality and happiness: are Europeans and Americans different? Journal of Public Economics, 88, pp. 2009–2042 Albert, C. and Davia, M. A. (2005). Education, wages and job satisfaction, Paper
presented at the Epunet Conference 2005, Colchester.
Blanchflower, D.G. and Oswald, A.J. (2004). Money, Sex and Happiness: An Empirical Study, Scandinavian Journal of Economics, Wiley Blackwell, vol. 106 (3), 393-415. Blanchflower, D.G. and Oswald A.J.(2007). Is Well-Being U-Shaped over the Life Cycle?,"IZA Discussion Papers 3075, Institute for the Study of Labor (IZA).
Becchetti, L., Castriota, S. and Londoño, D. (2006), Climate, happiness and the Kyoto protocol ,CEIS Working Paper
Clark, A. and Oswald, A.J. (1994). Unhappiness and Unemployment, Economic Journal 104, 648-659.
Clark, A. E. (1997). Job satisfaction and gender: Why are women so happy at work? , Labor Economics 4, 341-372.
Clark A.E., Georgellis, Y. and Sanfey, P. (2001). Scarring: The psychological effect of past unemployment, Economica 68, 221-241.
Cohen, Philip N. and Matt L. Huffman. 2003. "Individuals, Jobs, and Labor Markets: The Devaluation of Women's Work." American Sociological Review 68(3):443-63.
Cummins, R.A. (2000). Personal income and subjective well-being: A review, Journal of Happiness Studies 1, 133-158.
Cuñado J., Gracia F. P. (2010). Education and happiness in Spain,Investigaciones de Economía de la Educación volume 5, chapter 10, pages 206-222
Caporale, G., Georgellis, Y., Tsitsianis, N. and Yin, Y. P. (2009). Income and happiness across Europe: Do reference values matter?, Journal of Economic Psychology, Elsevier, vol. 30(1), 42-51, February.
Cohen, Philip N. and Matt L. Huffman. 2003. "Individuals, Jobs, and Labor Markets: The Devaluation of Women's Work." American Sociological Review 68(3): 443-63.
Dale, B. (1980). Subjective and Objective Social Indicators in Studies of Regional Social Well-being, Regional Studies 14, 503-515.
Diener, E., Gohm, C.L., Suh, E. and Oishi, S. (undated). Similarity of the Relations Between
26 Diener, E., & Seligman, M. E. P.(2004). Beyond money: Toward an economy of well-being. Psychological Science in the Public Interest, 5, 1-31.
Di Tella, R., MacCulloch, R. and Oswald, A.J. (2001). Preferences over Inflation and Unemployment: Evidence from Surveys of Happiness, American Economic Review, forthcoming.
Easterlin, R. (1974). Does Economic Growth Improve the Human Lot? Some Empirical Evidence, in: P.A. David and M.W. Reder (eds.), Nations and Households in Economic Growth: Essays in Honour of Moses Abramovitz, New York: Academic Press, 89-125. Easterlin, R. A. (2001). Life cycle welfare: Trends and differences. Journal of Happiness Studies, 2, 1–12.
Easterlin, R.A. (2009), Lost in Transition: Life Satisfaction on the Road to Capitalism. Journal of Economic Behavior & Organization, Volume 71, Issue 2, 130-145
Frey, Bruno S & Stutzer, Alois, (2000). Happiness, Economy and Institutions, Economic Journal, Royal Economic Society, vol. 110(466), 918-38, October.
Frey, B. S. and Stutzer, A. (2002). Happiness and Economics, Princeton University Press, Princeton
Gardner, J., Oswald, A.J. (2002). Does Money Buy Happiness? A Longitudinal Study Using Data on Windfalls, Royal Economic Society Annual Conference 2002 81, Royal Economic Society
Gropper, D., Lawson R. and Thorne J. (2011). Economic Freedom and Happiness, Cato Journal 31 (2): 237-256.
Hayo, Bernd, (2004). Happiness in Eastern Europe, Marburg Working Papers on Economics 200412, Philipps-Universität Marburg, Faculty of Business Administration and Economics, Department of Economics (Volkswirtschaftliche Abteilung).
Hayo, B. , Seifert, W. (2003). Subjective economic well-being in Eastern Europe, Journal of Economic Psychology, Elsevier, vol. 24(3), 329-348, June.
Heritage Foundation, (1999). Index of Economic Freedom data.
Hope, S., B. Rodgers and C. Power: 1999, Marital status transitions and psychological distress: Longitudinal evidence from a national population sample, Psychological Medicine 29(2), pp. 381_389.
Johnson D. R., Wu J., (2002) , An empirical test of crisis, social selection, and role explanations of the relationship between marital disruption and psychological distress: A pooled time-series analysis of four-wave panel data, Journal of Marriage and the Family , 64 , p211-224.
Kim, K., Lee, Y. and Lee, Y.(2010). A Multilevel Analysis of Factors Related to Poverty in Welfare States, Social Indicators Research, Volume 99, Issue 3, pp 391-404.
27 Kousha, M., , Mohseni, N. (2000). Are Iranians happy? A comparative study between Iran and the United States. Social Indicators Research, 52, 259–289.
Lelkes, O. (2006). Tasting freedom: happiness, religion and economic transition, Journal of Economic Behavior and Organization, 59, pp. 173–194
Lucas, R. E. and Clark, A. E. Do people really adapt to marriage? Journal of Happiness Studies, forthcoming, 2006.
McBride, M. (2001). Relative-income effects on subjective well-being in cross-section. Journal of Economic Behavior & Organization, 45, 251–278.
McConatha, J. T., Rieser-Danner, L., Harmer, K., Hayta, V., & Polat, T. S. (2004). Life satisfaction in three countries. Psychological Reports, 94(3), 795–806.
Muffels, R. , Skugor, D. and Dingemans, E. (2012) . Money Does Not Buy Much Happiness - But What Have Income Inequality, Modernization and Personal Values Got to Do with it?
Namazie, C., Sanfey, P. (2001). Happiness in transition: The case of Kyrgyzstan. Review of Development Economics, 5(3), 392–405.
Raudenbush, S., Bryk, T. ,Congdon, R. (2004). HLM 6, Hierarchical Linear and Nonlinear Modeling, Scientific Software International
Raudenbush, S., Bryk, T. ,Congdon, R. (2002). Hierarchical Linear Models (Second Edition).Thousand Oaks: Sage Publications.
Raudenbush, S., Bryk, T.. (1992). Hierarchical Linear Models in Social and Behavioral Research: Applications and Data Analysis Methods (First Edition). Newbury Park, CA: Sage Publications.
Selim, S. (2008). Happiness and Life Satisfaction in Turkey, Social Indicators Research, Volume 88, Number 3, 531-562
Steffen, S, Vatter, A. (2011). Does Satisfaction with Democracy Really Increase Happiness? Direct Democracy and Individual Satisfaction in Switzerland, Political Behavior, May 2011, 0190-9320, 1-25
Swinyard, W.R., A.-K. Kau, and H.-Y. Phua (2001). Happiness, Materialism, and Religious Experience in the US and Singapore, Journal of Happiness Studies 2, 13-32. UNDP, (1999). International Human Development Indicators, Human Development Index data.
Veenhoven, R. (2000). Freedom and Happiness: A Comparative Study in 44 Nations in the Early 1990s. In E. Diener and E. M. Suh (eds.) Culture and Subjective Well-Being. Cambridge, Mass.: MIT Press.
Winkelmann, L., Winkelmann, R., (1995). Unemployment: Where does it Hurt?,CEPR Discussion Papers 1093, C.E.P.R. Discussion Papers.
28 Worldbank Database, (1999). World Bank national accounts data and OECD National Accounts data files, Catalog Sources World Development Indicators.
World Values Survey (1981-2008). Official Aggregate v.20090901,2009. World Values Survey Association. Aggregate File Producer: ASEP/JDS, Madrid.
Yang, Y. (2008). Social inequalities in happiness in the United States, 1972 to 2004: An age-period-cohort analysis. American Sociological Review, 73(2), 204–226.