Selçuk J. Appl. Math. Selçuk Journal of Vol. 12. No. 1. pp. 127-148, 2011 Applied Mathematics
A Model for Blood Flow in Capillaries and Its Numerical Solution Gül¸sen Yaman1, Bülent Tunçay2
1 Department of Mecanical Engineering, Balıkesir University, Ça˜gı¸s Campus, 10145
Balıkesir,Turkiye
e-mail: gyam an@ balikesir.edu.tr
2Turkish Airlines, Maintanence Center, Ataturk Airport, Ye¸silköy, 34830 ˙I stanbul,
Turkiye
e-mail: btuncay@ thy.com
Received Date: June 10, 2010 Accepted Date: October 19, 2010
Abstract. Developments in computing and experimental instruments help to solve problems of all medical sciences. Simulations of microcirculation have started to help scientists to make right decisions on microcirculation problems. In this study, earliest studies of the blood circulation in capillary region have been investigated and an existing numerical model of the blood flow in capillary has been studied and compared with the results from the available literature. Key words: Blood flow; capillary; microcirculation; numerical model. 2000 Mathematics Subject Classification. 76, 74L15, 92C10, 65. 1.Introduction
The necessities of tissues and cells are provided by a matter of exchange with blood in capillaries and thus one of the most important regions of blood circu-lation is in the capillary region. Investigations of blood flow on capillaries have been carried out from the 17th century to our time [1]. Even though, there had been many methods implemented to model of the system, since all involved methods have some borders and limitations, accurate and satisfactory results have yet to be obtained. Since high technological instruments cannot provide high accuracy on results from human body and even from microcirculation in-vestigations, laboratory works and numerical models still play an important role on diagnosis and treatments. Investigations show that fluid mechanics ap-proaches can examine the blood circulation and blood flow on living organisms. On the base of this remark, a numerical model is taken into consideration. The
influence of exchange between blood and tissues and cells were considered to have a small affect on the flow and therefore it was ignored. Red blood cells were assumed to behave as in axial train model and laminar flow equations were derived considering the contraction of red blood cells due to the flow in capillaries. Implemented an existing model which then depends mainly on the idea of separating a capillary into equal segments in length, was implemented. To conclude the implementation, a FORTRAN code was used. By examining all the segments separately, pressure, speed, radius and flow rate values were calculated. Results were compared with the values on available references. As a result, implementation of numerical model on references had consistent values within themselves.
2. Short Literature Review for Blood Flow
In bioengineering many mathematical models have been developed for different purposes and some of those models have been concentrated on the blood flow and microcircular systems [2,3,4,5]. The flow rate of blood in microcircular sys-tem is important in many cases. There are several approaches to measure blood flow in the system. For example, as explained in [6] flow measurements have been reported using techniques of scanning laser doppler imaging and anemome-ter, Doppler ultrasound system [7,8,9], dye dilution [10], endoscopies [11], and fluorescent-labelled microspheres [12]. Each of these methods has some inher-ent restrictions and limitations. Accurate scanning laser Doppler velocimetry measurements can be obtained only from blood vessels that are 40 or more in diameter, and the measurements are not specific to red or white blood cells [13]. The dye dilution technique measures the flow of whole blood volume but not blood cells velocity. Endoscopy causes injury to the surrounding tissue from the insertion of the endoscope and does not account for the resultant change intraocular pressure. Because of their rigidity and spherical shape, fluorescent-labelled microspheres do not have exactly the same homodynamic properties as red blood cells. Moreover, the spheres used by Khoobehi et al., were smaller than red blood cells, being 1-2 in diameter [12].
According to the results of the experimental studies, doing experiment on human subjects is not easy and they also have some assumptions and errors because of their difficulties. The other point for the experimental studies is that their set-ups are difficult and expensive. Theoretical studies and models have been carried out since 1842 as mentioned in [14]. Some of the mathematical models have lost their importance with development electronic test systems. However the value of right and precise models will never lost their importance, because of their guidance on the experimental studies.
In this study, an existing numerical model is going to be investigated with some improvements to determine flow properties for microcircular system.
2.1. A Brief Review for Capillary Flow Measurement Models
There are several studies for blood flow in vessels. However, microcircular sys-tem has not been studied as much as an ordinary syssys-tem. To reduce the number
of difficulties and number of experiments, precise models are necessary for the microcircular system.
Some models have been established and studied as mentioned in [14] and [2]. Most accepted and studied models have been investigated by Charm and Kur-land who were published in 1974. Charm and KurKur-land’s model has also been taken as a base for the model that is considered in this study which model will be investigated with some more details and with improvements in the following sections.
2.2. A Closure on Mathematical Models with Capillary Blood Flow There are some theoretical studies on the microvascular blood flow, which are based on only assumptions and mathematical calculations. They do not use any experimental results that may help the model accuracy. For example, some of the models assume that the system is an electrical network, there are some models using an iterative mathematical model of network blood flow [15,16,17] and some use finite element for computational fluid dynamics results [2,18]. The literature survey shows that capillary blood flow has been originated from relative movement of red blood cells in the plasma. The red blood cells have to be contracted in capillaries to move. For this reason, the red blood cells have to be specially considered [2,6,19].
With this basic background, an existing model has been taken in consideration as explained in [14] which is the most relevant and detailed model for this study. In the study [14] the analytical model has been investigated with a numerical approach and the results of the numerical approach have been compared with some experimental results from the literature.
3. Flow in the Capillaries
Vessels of the circulatory system are not rigid. They respond to changes in internal pressure changing in their diameter. In larger vessels of the microcircu-lation (e.g. small arteries, arterioles, venues and veins), vessel wall diameter is principally responsive to nervous control rather than transmural pressure and wall elasticity. In capillaries, however, diameter is not subject to nervous control [14].
3.1. Derivation of Vessel Diameter in Capillary
The relationship between pressure and radius in cylindrical vessels can be ex-pressed with Laplace’s equation [14,20].
(1) =
Where is tension force/length, and are the transmural pressure differ-ence and vessel radius respectively.
Although, equation (1) seems to be convenient expression, placeLaplace’s equa-tion does not consider the thickness of the vessel wall and thus omits an impor-tant parameter from consideration.
The properties of vessel wall material that determine the relationship between transmural pressure and vessel radius are the elastic modulus ()and the Pois-son ratio (). The thickness of the vessel wall plays an important role in setting the relationship between vessel diameter and pressure.
The simplest relationship between elongation and stress, which is known as Hook’s law is given by
(2) =
Where and mean, respectively, stress and the elastic modulus. denotes the strain, which is the fractional elongation of an element, that is, ∆where ∆ is the change in the length of the material with length . The stress (or force/unit area) acting in the wall of a thin cylindrical vessel under pressure is defined by
(3) =
The strain in this case is ∆. The wall thickness varies with the change in radius. The relationship between and is
(4) = − 0 =() − 0
Where is Poisson ratio for material or vessel wall (for isotropic materials = 025), 0 denotes thickness of wall at “rest” radius 0and 0 indicate cylinder radius with transmural pressure difference and cylinder rest radius or radius with zero transmural pressure respectively.
The vessel wall acts as a Hookian material for small changes in radius, and the relationship between transmural pressure in the vessel and the vessel radius defined as (5) = 20 0 µ 0 ¶ + 0
During the blood flow in a vessel filled with reduced radius, the pressure de-creases, as it can be seen in equation (5). The shape of a vessel depends on the hydrostatic and osmotic pressure differences along its length and its elastic properties. With knowing the transmural pressure along the vessel, it is possible to calculate the vessel shape using equation (5).
3.2. Derivation of the Velocity of Red Cell in a Capillary
Cell in capillaries may flow in “stacked” flow as described in Figure 1. or the cells may orient “edge on” with the opposite sides of the cell pushed in and the
central part of the disc pushed out. The shape is cylindrical, with the leading edge convex and trailing edge concave. The type of orientation occurs at low velocities as 0.2 mm/sec and tube diameters less than cell diameters [14] and [21].
Figure 1. The shapes of cell during blood flow (stacked flow) [21] Consider a capillary with a radius 0 which is larger than the rest radius of a cell . is the distance between the radius of a cell and capillary of radius (see Figure 2.).
During the blood flow in capillary, the cell distorts under pressure, causing an increase in the gap between the cell and the wall (Figure 3). When the cells are oriented to move downstream in the same position, as in Figure 3., (stacked flow), the velocity profile must be a plug flow type, since the entire cell moves with the same velocity as at the cell edge. The velocity at the cell edge is determined by the plasma velocity that is undergoing laminar flow between the vessel wall and the edge of the cell. As pressure increases, the cell distorts, shortening the cell radius rc by an amount ∆r.
Figure 2. Vessel and a cell at rest [14]
The velocity of the cell in a capillary is the same as the velocity at the streamline at the edge of the cell, which is at a distance − ∆ from the center (=cell radius at rest; ∆ =change in cell radius due to distortion), see Figure 2. The velocity equation can be produced with assumption of full developed and laminar flow using control volume analysis [22]. The formulation detail of ve-locity equation can be found in [23].
The point velocity of the cell is found from (6) 2 R −∆ = R0 − = 4 h 2− (− ∆)2 i
where ∆ expresses change in projected radius of cell due to deformation under pressure and is the plasma viscosity. denotes the rest radius of cell.
Figure 3. Cell and vessel under pressure [14]
3.3. Derivation of the Flow Rate in the Capillary
The flow rate through the cell under these flow conditions may be calculated by integrating the incremental flow through an annulus of radial width at radius across the flow from
= 0 to = = 2 (7) = Z 0 2
Substituting for in to the above equation, and integrate over the conditions yields an expression as below.
(8) = 8 µ ∆ ¶ h 4− (− ∆)4 i
The flow rate through a capillary is slightly larger than cell as seen in equation (8).
3.4. Cell Distortion in Capillary
Cell distortion due to pressure gradient across a cell can be determined by considering the forces acting on a cell in a capillary. The cell is idealized to appear in cross section as in Figure 2. (i.e. a torus encircling a disc). When
a cell flow exists in a capillary, as in Figure 4., a net drag force acts on the torus and a pressure load () acts in the opposite direction on the central portions of the cell. In the Figure 4., is the force per unit of a circumference exerted on torus by the central membrane of the cell, a is the radius of the torus, is the cell radius at rest, and is the drag force [14].
Force acting on the torus in Figure 4. can be resolved into an equivalent force system of a horizontal component and a moment for S and a horizontal and vertical component for . If the velocity of the cell is constant, there cannot be a net force acting on the cell, and is that = as can be seen in Figure 4. The moment Sa acts uniformly all around the torus and is therefore self-equilibrating. It is assumed that the twisting action of the distributed moment does not grossly deform the membrane. The distributed force is the force of primary concern, since it causes a radial contraction of the torus. The circumferential stress in the torus is approximately
(9) =
cos 2 and the circumferential strain is
(10) ∆ = cos 2 or (11) ∆ = cos ³ ´2
It is necessary to relate and to the geometric and material properties and the applied loading () across the cell.
Figure 4. Forces acting on an idealized cell in capillary flow [14] Consider the central portion of the cell, it has previously been observed that red cells deform in the shape of a paraboloid. Thus,
(12) =
2
where is the lateral displacement of membrane and is the radial distance measured from axis of symmetry. After differentiating of gives
(13) µ ¶ =(−∆) = (− ∆) 2 tan
Assuming that can be replaced by (for ≤ 300 the error is 10%) it can be written
(14) = (− ∆)
2
Now is related to the applied pressure by noting that an originally flat mem-brane loaded by a uniform pressure will deflect into a spherical segment and that (15) = " (− ∆)2()2 24 (1 − ) #13
If the paraboloid is shallow, the equation (15) is accurate, for under these con-ditions the distinction between a paraboloid and a spherical segment can be ig-nored. When the membrane deflection is large, a nonlinear analysis is required and equation (15) gives only an approximation. Assuming that the approxi-mation is adequate for these purposes and substituting equations (15) and (14) into (11), then equation (16) is obtained,
(16) ∆ = µ ¶23 2 2 [(−∆)2] 13 24(1−)13 cos ( 1 2 µ (− ∆) [24 (1 − )] ¶13)
where the thickness is a function of ∆. This relationship can be determined by assuming that the volume of the cell 0 is constant and that
(17) 0=
where is the surface area of one side of the cell and can now be found from a consideration of the surface of revolution generated by the trace of the paraboloid cell. Thus, it can be obtained by
(18) = Z max 0 2 = Z −∆ 0 ³ ´ (19) = (− ∆) 3 3 " 24(1 − ) ()2(− ∆) #13
Substituting this for an in equation (17), solving for and substituting for in equation (16) can be found the change in cell radius due to stress distortion as follow,
(20) ∆ =3 02 h ∆ (−∆)524(1−)2 i13 cos µ 1 2 h ∆ (−∆) 24(1−) i13
When the capillary wall is not fully rigid, this plays an important role on the elasticity of the cell. Although, the elasticity value of the cell is close enough the capillary elasticity, the cell elasticity is not important for the flow [3]. 4. Numerical Study of the Model
According to the previous explanations, Charm and placeKurland’s numerical model may be investigated to determine of blood pressure, velocity, value of vessel diameter with some improvements. The original model [14] could be considered for some evaluations. These evaluations require separate unite cal-culations. This numerical model procedures and inputs have been explained as follows.
4.1. Numerical Model Inputs
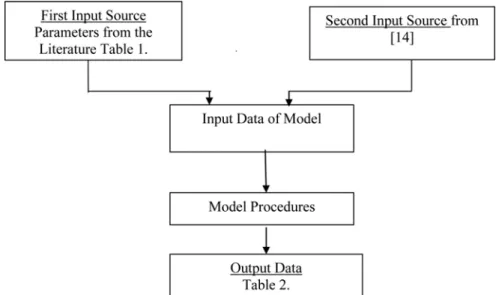
There are different input values that are required by the evaluated model. Av-erages of these input values have been used in the model. These inputs have been summarised in the Table 1. Elasticity and Poisson constants have been taken from [14] and these values are also used for the original model. The input data sources for the model and the output are shown in Figure 5. as a block diagram.
4.2. The Procedures in the Model
The procedures of the model are taken from the analytical model, which is used in the literature [14]. Within the procedures, two main improvements have been achieved from that model; first, the velocity equation is added to the developed model. The second difference is related to come from the fluid rate. In the analytical model [14], fluid rate has been used as a control parameter for conversion of the result. In the developed model, on the other hand, the fluid rate is taken as a constant value. In the analytical model total pressure difference and input/output pressure differences are compared with conversion the developed model pressure differences (from the literature) and determined pressure differences have been compared to conversion.
In this improved numerical model, first of all, the pressure difference (∆) is defined for the cross section. Transmural pressure (Pt ) is determined from assumed section pressure difference (∆) and osmotic pressure. First section radius has been calculated from the equation (5). This calculation requires iterations because of the radius function (= ()) has a recursive structure. This is started by an assumed value, than the equation (5) calculates a new value. The assumed and calculated radiuses are expected approximate each other within a defined tolerance. This has been carried out an iterative structure.
Cell distortion (equation 20) which is a function of itself (∆ = (∆)) has a similar structure to the radius calculation equation and its calculations are carried in a similar way as the radius calculations. This procedure has also a recursive structure. All these calculations are based on values for flow rate and velocity of first zone. The criteria of calculations are the number of sections on the model. A new pressure value of the cross section is the difference of the pressure and the pressure difference of the previous cross section ( () = ( − 1) − ∆( − 1)). From these known values, the transmural pressure can be calculated easily. In the following stage, radius is calculated as previously explained. The calculations could be carried out, because the first pressure difference has already been assumed. However, other sections require pressure difference calculations for velocity and flow rate. There are no specific equations for pressure difference calculations. For this reason existing equations which is the equation (8), have to be considered.
In this model, it has been assumed that, there is not any material transfer (water, proteins, etc.) between capillary wall and tissues, which reminds that flow rate is constant for all sections. The pressure difference can be calculated from solutions of equation (8) and equation (20) together. From input data and calculated values, the velocity could be calculated easily using equation (6). When the calculations are completed for all sections, the values are checked for integrity. This is a comparison between last section pressure and exit pressure, which is given as an input data values. If the differences between those values are out of tolerance, all the calculations need to be started from the beginning with a new assumed pressure difference. If differences are in tolerance of the calculations, procedure will be stopped.
For this model, a FORTRAN programming code has been completed that could handle precise values and iterations in a convenient way. The flow chart of the program is presented in the Appendix A.
4.3. Concluded Results from the Model and its Applications
The numerical model has ran with inputs that were gathered from related liter-ature. These input values and results from the model have been shown in Table 2.
This table also presents error percentages of the calculated values that have been based on related literature. Some of the percentages are relatively high because the values are very small and precise.
As seen from Table 2, calculated capillary diameters and gathered diameters (from available literature) are consistent. However, there are a few available velocity values in the literature; also the calculated velocities do not verify them. It is an advantage that the model provides a calculation approach for capillaries’ velocity values. But the inconsistency between the literature and calculated velocity values forces the researchers for the reconsideration on the model and gathered values. Reasons for the differences will be explained in the section 4.3.2 in more details.
The radius and flow rate have a right proportion. They both increase and decrease. Pressure has no direct relation with flow rate as it can be seen in Table of App. B. These results have been presented in a tabular form (Table of App. B) that makes it easy to compare. Following graphics present calculated results and literatures values, they have been based input parameters from literature. However behaviour of [14] (from literature) may be accepted as the response of the model, since all the required parameters for the model cannot be found at the same time in the same literature. Necessary parameters may be gathered from [14] (see Figure 5.).
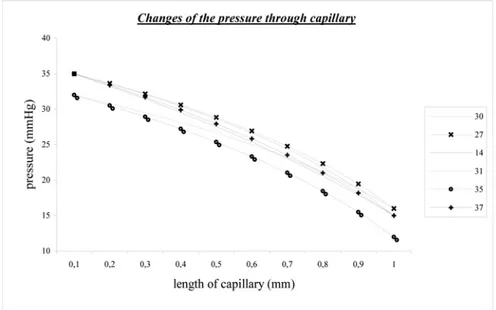
4.3.1. The Comparison of the Calculated Pressure Values
The calculated pressure values comparison has been presented in Figure 6. The pressure change through the capillary length has been calculated for different diameters from available references. When Figure 6. is investigated, the input pressures are from 32 to 35 ([31] and [35]), and they drop down to 20 until the end of the capillary for each references. This means that the pressure drops to 20 for metricconverterProductID1 mm1 mm capillary. This has similar change with body pressure as mention in [45]. The heart beats do not affect pressure change of the capillaries, the affect can only be observed on the veins. This also validates the model pressure calculations and their values.
Figure 6. Comparison of the pressure changes
4.3.2. The Comparison of the Calculated Velocity Values
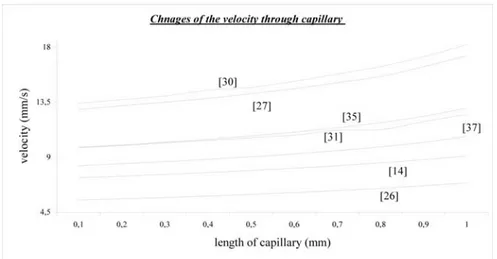
The velocities of red blood cells have been compared for different input para-meters from different references as seen in Figure 7.
The calculated velocity values do not agree with each other when their input values are taken from different literature. This is usual as they have different input values in different body sections. The experimental measurements from retina show that the velocity ratio of capillary is 15 ratio [6]. The other source of disagreement is viscosity of the blood, it shows difference from 75 − 1510 − 6 in different literature. This could also be source of the disagreements.
Figure 7. Comparison of the velocity changes
According to calculations the literature [26], velocity value starts with a low value and ends with small increment along capillary. However, in [30] velocity value starts with a high value and it ends with a high increment when it is compared with literature [26]. As a result of this and other elements of the graphic, when initial value is high the last velocity also is high; the difference between beginning and ending is related. When Table 2 is considered, stationary capillary diameter is high and its initial velocity value is high.
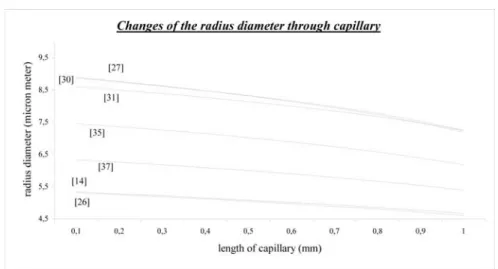
4.3.3. The Comparison of the Calculated Radius Values
Figure 8 presents different calculated radius values through the capillary length. The calculations based on different input values of the available literature. The first concentration should be on stationary capillary radius values. These values are lined up as seen in Figure 8. The radius of capillary has a relationship with initial pressure value. When the pressure is high the radius also increases. The radius of capillary decreases with length of capillary. With the pressure decrements radius also decreases.
Figure 8. Comparison of the radius diameter changes
5. Conclusion
Studies and available references show that the capillaries and blood flow do not have the same features for different body sections. This is the main reason for that the studies not being able to be carried out on the capillary found on the same body section. The number of considerate parameters for calculations increases with daily improvements and this makes it impossible to get the same results for the calculations. Even though the study for parameters of the specific sections of the capillaries (brain, eye, etc) has been taken into consideration, the results do not have a clear agreement. This is usual because of the nature the subject matter.
These type numerical models and simulations may help to cut down the number experiments on the real measurements and testing of real systems. This type models may gain importance when they are used with electronic test systems and their applications.
The low cost of the model is the major advantage of the approach. Rather than producing final results, the model aims to steer some clinical experiments and reduce the number of experiments.
6. Further Works
More studies may be done to create more realistic models which can be taken into consideration the material transfer between capillaries and tissues. Also models and their solutions could be carried out for specific capillaries as brain, heart etc.
References
1. Popel, A.S., Johnson, P.C., Microcirculation and Hemorheology, Annu. Rev. Fluid Mech., 37:43-69, 2005.
2. Lordache, B., E., Remuzzi, A., Numerical Analysis of blood flow in reconstructed glomelar capillary segments, Microvascular Research, Vol.49, No.1, 1-11, 1995. http://www.idealibrary.com/links/doi/10.1006/mvre.1995.1001
3. Tang P., Wang, S.,M., Fung, Y.,C., Model of structural and mechanical properties remodelling of blood vessels due to change in pressure, Bioengineering Conference, June 16-20, 1999, Big Sky, Montana.
http://asme.pinetec.com/bio1999/data/pdfs/a0200003.pdf.
4. Berger, S., A., Carlson B., E., Sickle cell blood flow in the microcirculation, Proceed-ings of the 26th Annual International Conference of the IEEE EMBS San Francisco, CA, USA September 1-5, 2004
5. Payne S.J., Analysis of the effects of gravity and wall thickness in a model of blood flow through axisymmetric vessels, Medical & Biological Engineering & Computing 2004, Vol. 42, 799-806, 2004.
6. Wajer, D., S., Taoomoto, M., McLeod, D., S., McCally, L.,R., Nishiwaki, H., Fabry, E., M., Nagel, L., R., Lutty, A., G., Velocity measurements of normal and sickle red blood cells in the rat retinal and choroidal vasculatures, Microvascular Research, 60, 281-293, 2000.
7. Stacker, M., Baier, V., Reuther, T., Hoffman, K., Kellam, K., Altmayer, P., Capil-lary blood cell velocity in human skin capillaries located perpendicular to skin surface: Measured by a new Laser Doppler Anemometer, Microvascular Research 52, 188-192, 1996. http://www.lawrenz.com/cam1lit2.htm
8. Madycki, G., Staszkiewics, W., Hendiger, W. and Slowinski, P., Validation of mea-surement in capillary blood flow by means of laser Doppler capillarometer (anemome-ter), 21 st European Conference on Microcirculation, Stockholm, 2000.
9. Forrester, K.R., Leonard, T.C., Stewart, C., Bray, R.C., A Laser Speckle Imaging Technique for Measuring Tissue Prefusion, IEEE Transactions Biomedical Engineer-ing, Vol. 51, No. 11, 2074-2084, 2004.
10. Duijim, H.F., Rulo, A.H., Astin, M., Maepea, O., Van den Berg, T.J., and Greve, E.L., Study of choroidal blood flow by comparison of SLO fluoresce in angiography and micro spheres, Epee Res., Vol. 63, No. 6, 693-704, 1996.
11. Jensen, P.S., and Blacksburg, M.R., Regional variation in capillary homodynamic in the cat retina, Invest. Ophthalmology Vis. Sci., Vol. 39, No. 2, 407-415, 1998. 12. Khoobehi, B., Shoelson, B., Zhang, Y.Z., and Peyman, G.A., Fluorescent mi-crosphere imaging: a particle-tacking approach to the hemodynamic assessment of the retina and choroid, Ophthalmic Surg. Lasers, Vol. 28, No. 11, 937-947, 1997. 13. Feke, G.T., Yoshida, A., and Schepens, C.L., Laser based instruments for ocular blood flow assessment, J. Biomed. Optics, Vol. 3, 415-422, 1998.
14. Charm, S. E, Kurland, G. S., Blood Flow and Microcirculation, John Wiley & Sons, New York, 1974.
15. Kılavuz, M., Cardiac parameters estimation by simultaneous solution of hemo-dynamics equations using the 6800-microprocessor, B. S. Thesis, Bogazici University, 1987
16. Kiani, F., M., Cokelet, R., G., Sarellus, H., I., Effect of diameter variability along a microvessel segment on pressure drop, Microvascular Research, Vol. 45, No. 3, 1993 17. Mitsis, G.D., Poulin, M.J., Robbins, P.A., Marmarelis, V.Z., Nonlinear Modeling of the Dynamic Effects of arterial pressure and CO2 variations on Cerebral Blood flow in healthy humans, IEEE Transactions on Biomedical Engineering, Vol. 51, No. 11, 2004.
18. Sharan, M., Singh, B., Kumar, P., A two-layer model for studying the effect of plasma layer on the delivery of oxygen to tissue using a finite element method, Appl. Mathematics Modelling, 21: 419-426, 1997.
19. Das, B., Johnson, P.C., Popel, A., S., Computational fluid dynamic studies of leukocyte adhesion effects on non-Newtonian blood flow through microvessels, Biorhe-ology 37, 239-258, 2000. http://www.aps.org/bapsdfd98/abs/s8040009.html
20. Roberson, J.A. and Crowe C., Engineering Fluid Mechanics, Houghton Mifflin Comp., USA, 1990.
21. Prof. Dr. Ba¸skurt, K.O., Akdeniz Üniversitesi, Tıp Fakültesi, Fizyoloji Anabilim Dalı,
http://www.akdeniz.edu.tr/tip/fizyolo ji/d2/hem o dinam i/hem odinam i% 20sunu.p df,2009
22. Fox, R. W., Introduction to Fluid Mechanics, 5th Edition, John Wiley & Sons, New York., 1987.
23. Tunçay B. Kılcal Damarlarda Kan Akı¸sının ˙Incelenmesi Bir Nümerik Modelin Uygulaması, Yüksek Lisans Tezi, Balıkesir Üniversitesi, 2003.
24. Cardiac Output, Blood Flow, and Blood Pressure http://www.bioprof.com/bmed108/14.doc
25. Huskey, R. J., University of Virginia, United States, www.people.virginia.edu/~rjh9u/lect11.html
26. Segal, M., Capillary Dynamics and the microcirculation, http://umds.ac.uk/physiology/segal/cvr29.pdf
27. Öztürk, C., Bo˘gaziçi Üniversitesi, Biomedikal Enstitüsü
http://www.bme.boun.edu.tr/ozturkc/bm581/cardiac_capillary.html
28. Gore, R., W., Arizona University, Physiology Department, Cardiovascular Physi-ology 485 http://omaha.physiol.arizona.edu/PhysiPhysi-ology485/485Schedule.html 29. Guyton A. C., Tıbbi Fizyoloji, 3. Baskı, Nobel Kitabevi, ˙Istanbul, 1989 30. Blood pressure in the capillaries
http://users.rcn.com/jkimball.ma.ultranet/BiologyPages/C/Circulation2.html# 31. Huxley, V., University of Missouri,
http://www.missouri.edu/~physfrog/biophysics2000.html 32. Sonwalkar, N., Fluid mechanics of human physiology, http://www.webzip.com/search=fluid+physiology.html 33. Common Misconcepts in Biology, Circulatory System
h t t p : / / w w w . f e d . c u h k . e d u . h k / ~ j o h n s o n / m i s c o n s e p t i o n / c e / m i s c o n c e p t i o n s / m i s _ i n _ b i o / c i r c u l a t i o n . h t m 34. Adamson, M., Capillary exchange,
http://musr.physics.ubc.ca/~jess/sci1/biol/gradients/node2.html
35. The Capillary Circulation, Some major points about the microcirculation http://www.umds.ac.uk/physiology/rbm/capdyn.htm
36. Bard, P., Medical Physiology, 11th Edition, Mosby, 1981
37. Fedida, D., Cardiovascular Physiology, The Microcirculation
http://www.physiology.ub c.ca/Courses/M icro circulation% 20and% 20sm o oth% 20muscle.PDF
38. Lyon, M., J., Davis, R., J., Age-related blood flow and capillary changes in the rat utricular macula: A quantitative Stereological and Microsphere Study, Journal of the Association for Research in Otolaryngology
h t t p : / / w w w . l i n k . s p r i n g e r n y. c o m / l i n k / s e r v i c e / j o u r n a l s / 1 0 1 6 2 / c o n t e n t s / 0 0 / 2 0 0 2 2 / p a p e r / i n d e x . h t m l 39. Hwang, M., The human blood circulatory System
h t t p : / / w w w . m a s . n c l . a c . u k / ~ s b r o o k s / b o o k / n i s h . m i t . e d u / 2 0 0 6 / T e x t b o o k / N o d e s / c h a p 0 9 / n o d e 2 2 . h t m 40. Pulmonary Circulation: Blood flow, blood Pressure & resistance http://www.acbrown.com/lung/Notes/RsCrcl/RsCrclFlow.htm 41. Blood Flow, http://fog.ccsf.org/~rmeckler/bloodflow.htm
42. Baer, A., Physiology IDIS 150, School of Medicine, Faculty of Health Sciences, Queens University Kingston, Canada
http://meds.queensu.ca/medicine/phsiol/undergrad/150/cardiac/cardiac5.htm 43. Türk Kardioloji Derne˘gi, Mikrodola¸sım Toplam Efektif Yüzey Alanı, http://www.tkd.org.tr/kilavuz/glcntnts.asp?wbnum=1108
44. Schechtman, University of Southern California, Department of Biomedical Engi-neering, Hemodynamics
![Figure 1. The shapes of cell during blood flow (stacked flow) [21] Consider a capillary with a radius 0 which is larger than the rest radius of a cell ](https://thumb-eu.123doks.com/thumbv2/9libnet/4626851.85928/5.892.263.653.284.406/figure-shapes-stacked-consider-capillary-radius-larger-radius.webp)
![Figure 3. Cell and vessel under pressure [14]](https://thumb-eu.123doks.com/thumbv2/9libnet/4626851.85928/6.892.295.618.360.524/figure-cell-and-vessel-under-pressure.webp)
![Figure 4. Forces acting on an idealized cell in capillary flow [14] Consider the central portion of the cell, it has previously been observed that red cells deform in the shape of a paraboloid](https://thumb-eu.123doks.com/thumbv2/9libnet/4626851.85928/7.892.205.520.456.640/figure-forces-idealized-capillary-consider-previously-observed-paraboloid.webp)