FEM based Design and Simulation Tool for MRI Birdcage Coils
including Eigenfrequency Analysis
Necip Gurler
*1and Yusuf Ziya Ider
1 1Department of Electrical and Electronics Engineering, Bilkent University, Ankara, Turkey
*Corresponding author: [email protected]Abstract: Radio Frequency (RF) birdcage coils are widely used in Magnetic Resonance Imaging (MRI). Before the actual construction of the coil, not only calculating the capacitance value, which is necessary for the coil to resonate at the desired frequency, but also modeling the birdcage coil in a 3D simulation environment and making electromagnetic analysis in the volume of interest have importance in terms of observing the resonance behavior of the coil, electromagnetic field distributions inside the coil, or specific absorption rate (SAR) distribution for any object. For this purpose, we have made two different electromagnetic analyses of low-pass and high-pass birdcage coils in COMSOL Multiphysics. These are frequency domain analysis and eigenfrequency analysis. We have also developed a software tool using MATLAB® to make these electromagnetic analyses easily and according to the user-specified parameters. Simulation results for these analyses are provided. For the experimental results, we have constructed a hand-made low-pass birdcage coil and measured the resonant modes of the coil for different capacitance values. Our eigenfrequency analysis tool calculates the resonant modes with high accuracy.
Keywords: RF birdcage coils, electromagnetic simulations, frequency domain analysis, eigenfrequency analysis, specific absorption rate (SAR)
1. Introduction
Radio Frequency (RF) birdcage coils are widely used in Magnetic Resonance Imaging (MRI) since they can generate a very homogenous RF magnetic field in the volume of interest with a high signal-to-noise ratio (SNR) [1]. Additionally, birdcage coils can be used for quadrature excitation and reception that provides better power efficiency in transmit mode and higher MR signal sensitivity in receive mode compared to linear excitation and reception [2].
In practice, designing a birdcage coil is a time-consuming and difficult task. Calculating the necessary capacitance value to resonate the coil at the desired resonance frequency is the starting point of the design process. It is also important to know the complete resonance frequency spectrum (or resonant modes) of the birdcage coil that helps the coil designers to be sure that working mode is far away from the other modes so that tuning and matching procedures can be done without interfering with the other modes [3]. For this purpose, several studies have been presented in the literature to calculate the capacitance value and the resonant modes of the birdcage coil. Chin et al. have presented a useful method to calculate the necessary capacitance value for the given resonance frequency [4]. Jin, on the other hand, proposed a method to calculate the resonant modes of the birdcage coil [5]. Both methods are based on the lumped circuit element model and therefore errors in the capacitance and resonant mode calculations increase as the frequency increases to a point at which the wavelength is comparable with the coil dimensions. In addition to the calculation of the capacitance value and resonant modes of the birdcage coil, modeling the coil in a 3D simulation environment and making electromagnetic analyses in the volume interest is also important in terms of observing the electromagnetic field or any variable distribution at a desired frequency (or frequencies) inside the coil such as B1 field distribution inside the coil or induced currents in the conductive object. Furthermore, one can estimate the SAR distribution of any object inside the coil by making these electromagnetic analyses.
For this purpose, we have proposed two different Finite Element Method (FEM) based simulation methods which are performed using the developed low-pass and high-pass birdcage coil models in COMSOL Multiphysics. One of them is the frequency domain analysis which is used to solve for the electromagnetic fields of a birdcage coil for the specified frequency (or
frequencies). The other one is the eigenfrequency analysis of a birdcage coil and is used to determine not only the resonant modes of the birdcage coil but also the electromagnetic field distributions inside the coil at these resonant modes accurately. Additionally, we have developed a software tool using MATLAB® which has graphical user interface (GUI) to apply these simulation methods easily and for the user-specified parameters. In order to compare the results of FEM based eigenfrequency analysis and the results of Jin’s method with the experimental results; we have constructed a handmade low-pass birdcage coil and measured the resonant modes of the coil for different capacitance values. Simulation results for both simulation methods and experimental results for the measured resonant modes of the coil are provided.
2. Theory
2.1 RF Birdcage Coils
RF birdcage coils consist of two circular conductive loops referred to as end rings, N conductive straight elements referred to as rungs (or legs) and capacitors on the rungs or end rings or both. According to the location of these capacitors on the coil geometry, there are three types of birdcage coils: low-pass, high-pass and band-pass. Illustrations of the low-pass and high-pass birdcage coils are given in Figure 1.
Figure 1. Illustration of a) low-pass and b) high-pass
birdcage coils
A birdcage coil with N number of legs and equal valued capacitors has N/2 distinct resonant modes. From these modes, m=1, which is the lowest frequency mode for the low-pass birdcage coils or highest frequency resonant mode for
high-pass birdcage coils, is the desired mode for MRI applications since it generates very homogenous B1 field inside the coil.
2.2 Lumped Circuit Element Model
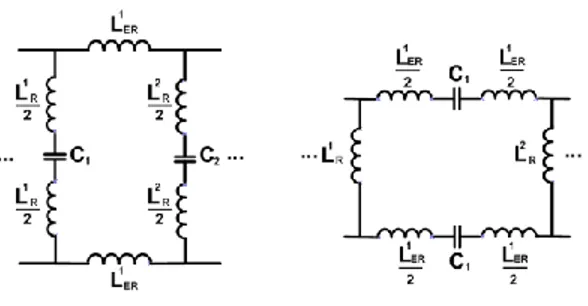
The most widely used technique in capacitance and resonant modes calculation of birdcage coils is based on the lumped circuit element model. In this model, rungs and end rings are first modeled as inductors. Then, self and mutual inductances of these elements are calculated using handbook formulas [6]. Finally, equivalent circuit (LC network) is solved by using Kirchoff’s voltage and current laws. Equivalent lumped circuit element model of one loop of low-pass and high-pass birdcage coils are illustrated in Figure 2.
Figure 2. Illustration of lumped circuit element model
of a low-pass birdcage coil (left) and a high-pass birdcage coil (right)
It is important to note that self and mutual inductance calculations of the coil elements are made under the quasi-static assumptions in the lumped circuit element model method. As a consequence of this assumption, errors in the calculations of capacitance and the resonant modes increase as the resonance frequency increases to a point where the wavelength is in the order of the coil dimensions. There is an important criterion, which is used for determining whether a wire can be modeled as lumped circuit element or not, and is given as [7]
where is the wavelength at the operating frequency. According to this criterion, if the coil length is larger than one twentieth of the wavelength at the desired frequency, using lumped circuit element model in birdcage coil design will give unreliable results.
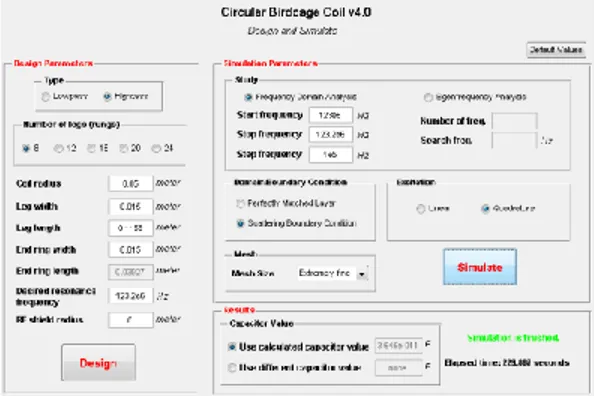
3. Methods
In this section, FEM models developed for low-pass and high-low-pass birdcage coils and the two electromagnetic analyses performed in COMSOL Multiphysics are presented.
3.1 FEM Models of Birdcage Coils
First, geometries of low-pass and high-pass birdcage coils are constructed. This is shown in Figure 3.
Figure 3. High-pass (left) and low-pass (right)
birdcage coil geometric models
As given in Figure 3, rungs and end rings are modeled as rectangular strips without thickness (surface boundary) and capacitors are modeled as parallel plate capacitors (domain). Capacitance value is set by changing the relative permittivity of the material assigned to capacitor domain using the formula
where is the permittivity of free space, is the area of the parallel plates, and is the distance between the parallel plates.
After modeling the coil geometries,
Electromagnetic Waves interface is added under
the Radio Frequency branch for the physics selection of the model. This interface solves the electromagnetic wave equation which is given as
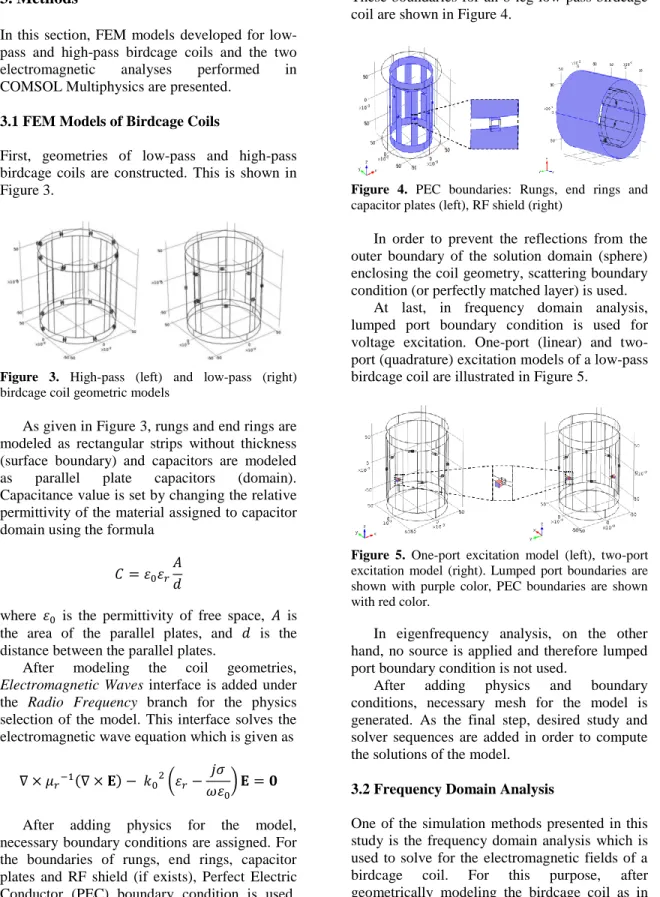
After adding physics for the model, necessary boundary conditions are assigned. For the boundaries of rungs, end rings, capacitor plates and RF shield (if exists), Perfect Electric Conductor (PEC) boundary condition is used.
These boundaries for an 8-leg low-pass birdcage coil are shown in Figure 4.
Figure 4. PEC boundaries: Rungs, end rings and
capacitor plates (left), RF shield (right)
In order to prevent the reflections from the outer boundary of the solution domain (sphere) enclosing the coil geometry, scattering boundary condition (or perfectly matched layer) is used.
At last, in frequency domain analysis, lumped port boundary condition is used for voltage excitation. One-port (linear) and two-port (quadrature) excitation models of a low-pass birdcage coil are illustrated in Figure 5.
Figure 5. One-port excitation model (left), two-port
excitation model (right). Lumped port boundaries are shown with purple color, PEC boundaries are shown with red color.
In eigenfrequency analysis, on the other hand, no source is applied and therefore lumped port boundary condition is not used.
After adding physics and boundary conditions, necessary mesh for the model is generated. As the final step, desired study and solver sequences are added in order to compute the solutions of the model.
3.2 Frequency Domain Analysis
One of the simulation methods presented in this study is the frequency domain analysis which is used to solve for the electromagnetic fields of a birdcage coil. For this purpose, after geometrically modeling the birdcage coil as in
the previous section, frequency domain study is added as study type and stationary node, which is default solver sequence of this study, is used. Additionally, Biconjugate Gradient Stabilized (BiCGStab) method with a left pre-conditioner is used as the solver. After specifying the operating frequency (or frequencies) from the study settings, one can compute the electromagnetic field solutions of the developed birdcage coil model in COMSOL Multiphysics. 3.3 Eigenfrequency Analysis
The other simulation method presented in this study is the eigenfrequency analysis which is used to calculate the resonant modes of a birdcage coil and electromagnetic field distributions at these resonant modes inside the coil. For this purpose, eigenfrequency study is added as the study type and eigenvalue solver is used as the solver sequence. In nonlinear eigenfrequency problems, using the default value of the linearization point (which is zero) causes an error because λ is generally in the denominator in the equation system and leads to division by zero. One can specify a non-zero linearization point manually from the solver settings in order to avoid this problem. After making necessary adjustments for the study and solver sequences, one can compute the eigenfrequencies which correspond to the resonant modes of the coil in COMSOL Multiphysics.
3.4 Software Tool
In order to provide convenience for the coil designers and the researchers in the field of MRI to apply these two simulation methods easily and according to the parameters they specify, we have developed a software tool using MATLAB® which connects to the COMSOL Multiphysics server and make all the FEM based design and simulation steps such as modeling the coil geometry, adding physics and boundary conditions, generating mesh and computing the solutions in the background. When the simulation is finished, the user can import the model from the server and observe any electromagnetic field or variable distribution in the volume of interest.
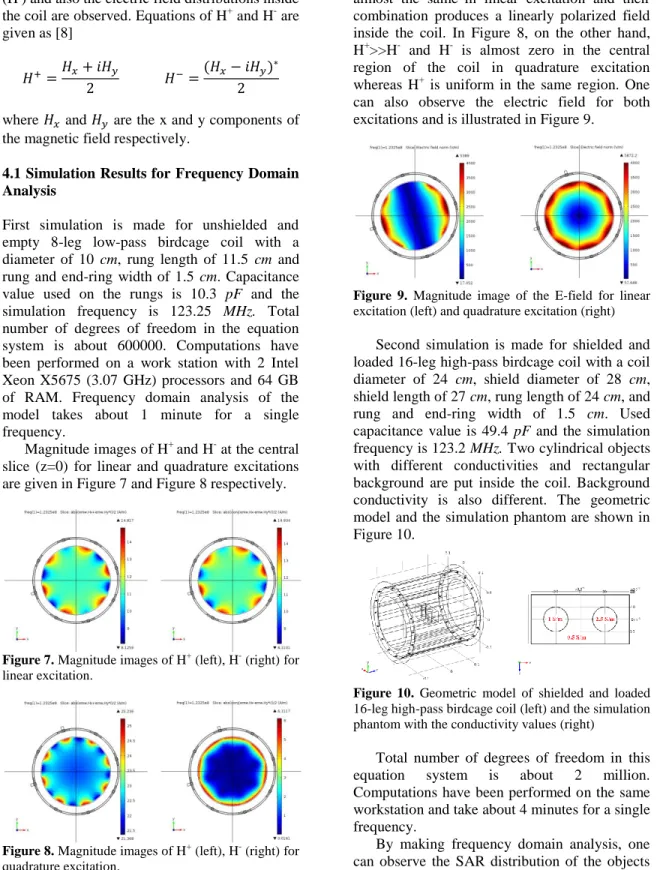
Graphical User Interface (GUI) of the developed software tool is shown in Figure 6.
Figure 6. GUI of the developed software tool
As given in Figure 6 there are three sections of this software tool: Design parameters, simulation parameters, and results.
The user first starts with specifying the design parameters. By clicking the Design button, necessary capacitance value is calculated according to the user-specified parameters by using lumped circuit element model method [4]. Then, user chooses the study type from the simulation parameters section and specifies the necessary parameters that correspond to that study type. In frequency domain analysis, user can select the excitation type in order to generate linearly or circularly polarized field inside the coil. Additionally, simulations can be made for different capacitance values by selecting the use
different capacitor value choice in the results
section. After specifying all necessary parameters, the user can start the simulation by clicking the Simulate button.
When the simulation starts, the program connects to the COMSOL Multiphysics server via COMSOL Multiphysics Livelink for MATLAB environment and makes the FEM based design and simulations according to the user-specified parameters. During the simulation, the tool informs the user about which step is being performed at that moment. When the simulation is finished, the program notifies the user and the results can be observed in COMSOL Multiphysics by importing the model from the server.
4. Simulation Results
In this section, simulation results of each electromagnetic analysis are given separately. In these results, left hand rotating (or excitatory) component of the magnetic field (H+) and right
hand rotating component of the magnetic field (H-) and also the electric field distributions inside the coil are observed. Equations of H+ and H- are given as [8]
where and are the x and y components of the magnetic field respectively.
4.1 Simulation Results for Frequency Domain Analysis
First simulation is made for unshielded and empty 8-leg low-pass birdcage coil with a diameter of 10 cm, rung length of 11.5 cm and rung and end-ring width of 1.5 cm. Capacitance value used on the rungs is 10.3 pF and the simulation frequency is 123.25 MHz. Total number of degrees of freedom in the equation system is about 600000. Computations have been performed on a work station with 2 Intel Xeon X5675 (3.07 GHz) processors and 64 GB of RAM. Frequency domain analysis of the model takes about 1 minute for a single frequency.
Magnitude images of H+ and H- at the central slice (z=0) for linear and quadrature excitations are given in Figure 7 and Figure 8 respectively.
Figure 7. Magnitude images of H+ (left), H- (right) for linear excitation.
Figure 8. Magnitude images of H+ (left), H- (right) for quadrature excitation.
As can be seen in Figure 7, H+ and H- are almost the same in linear excitation and their combination produces a linearly polarized field inside the coil. In Figure 8, on the other hand, H+>>H- and H- is almost zero in the central region of the coil in quadrature excitation whereas H+ is uniform in the same region. One can also observe the electric field for both excitations and is illustrated in Figure 9.
Figure 9. Magnitude image of the E-field for linear
excitation (left) and quadrature excitation (right)
Second simulation is made for shielded and loaded 16-leg high-pass birdcage coil with a coil diameter of 24 cm, shield diameter of 28 cm, shield length of 27 cm, rung length of 24 cm, and rung and end-ring width of 1.5 cm. Used capacitance value is 49.4 pF and the simulation frequency is 123.2 MHz. Two cylindrical objects with different conductivities and rectangular background are put inside the coil. Background conductivity is also different. The geometric model and the simulation phantom are shown in Figure 10.
Figure 10. Geometric model of shielded and loaded
16-leg high-pass birdcage coil (left) and the simulation phantom with the conductivity values (right)
Total number of degrees of freedom in this equation system is about 2 million. Computations have been performed on the same workstation and take about 4 minutes for a single frequency.
By making frequency domain analysis, one can observe the SAR distribution of the objects using the formula given as
where and are the conductivity and density of the object respectively. Normalized SAR distribution image at y=0 slice is given in Figure 11.
Figure 11. Normalized SAR distribution image (right)
at the slice given on the left with a red color
4.2 Simulation Results for Eigenfrequency Analysis
The simulation has been made for unshielded and empty 8-leg low-pass birdcage coil with the dimensions same as the dimensions given in the previous method. Number of eigenfrequencies is specified as 8 and the linearization point is given as – ). Computation of the eigenfrequencies takes about 10 minutes.
There are four distinct resonant modes calculated in this eigenfrequency analysis. Results for the magnitude images of H+ at these resonant modes are given in Figure 12.
Figure 12. Magnitude image of H+ at the resonant
modes (m=1 mode (left-top))
As can be seen in Figure 12, m=1, which is the desired mode, is found at 123.27 Mhz, and the other modes, m=2, 3 and 4, are found at 182.57 MHz, 211.83 MHz, and 220.84 MHz respectively.
5. Experimental Results
In this section, measured resonant modes of the handmade low-pass birdcage coil are compared with the results of FEM based eigenfrequency analysis tool (FEM-EFAT) and with the results of Jin’s software, MRIEM [5] (downloaded from http://jin.ece.illinois.edu/mriem.dir/mriem.html).
The coil is an 8-leg low-pass birdcage coil with a diameter of 10 cm and is built on plexiglass tube with a length of 16.5 cm. It is illustrated in Figure 13 without capacitor placement.
Figure 13. Handmade low-pass birdcage coil
Measurements have been made for five different capacitance values (Dielectric Laboratories High-Q Multi-Layer and Broadband Blocking Capacitors) and S11 of the coil using Agilent Technologies E5061A Network Analyzer is measured in order to determine the resonant modes. These capacitance values are 47 pF, 10 pF, 3.3 pF, 1.8 pF, and 1pF. Then, measured and calculated resonant modes for each method are tabulated for each capacitance value. As an example, measured and calculated resonant modes for 47 pF is given in Table 1.
Table 1. Measured and calculated resonance
frequencies (in MHz) for 47 pF
Mode Measured MRIEM FEM-EFAT
m=1 60.75 67.46 59.1
m=2 85.88 90.64 87.22
m=3 93.38 102.2 101.1
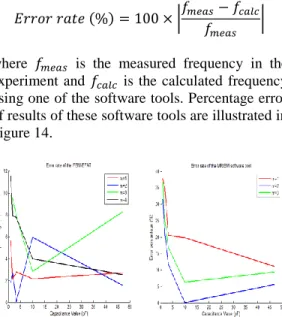
Using the results, one can calculate the percentage error of the results of two software tools (FEM-EFAT and MRIEM) relative to the values measured experimentally using the formula
where is the measured frequency in the experiment and is the calculated frequency using one of the software tools. Percentage error of results of these software tools are illustrated in Figure 14.
Figure 14. Percentage errors of the results of
FEM-EFAT (left) and MRIEM (right)
As can be seen in Figure 14, resonant modes calculated using the FEM-EFAT are more accurate compared with the experimental results. For the worst case scenario, in which the used capacitance value is 1 pF, our software tool calculates the resonance frequencies with a maximum of %10-12 error whereas MRIEM calculates with a maximum of %35-37 error. As previously mentioned, when the wavelength is comparable with the coil dimensions, calculation of the resonant modes using lumped circuit element model will give unreliable results. We can see this phenomenon in the MRIEM results which are given in Figure 14; as the capacitance decreases (or the resonance frequency increases), error in the calculated resonant modes significantly increases.
6. Conclusions
In this study, design and simulation of RF low-pass and high-low-pass birdcage coils in COMSOL Multiphysics are presented. For the design process, resonant modes of the birdcage coil are calculated accurately using eigenfrequency analysis. In the simulation process, frequency
domain analysis is used to observe any electromagnetic field or variable distribution for any scenario (such as loaded or shielded birdcage coil) in the volume of interest. Furthermore, this analysis can be used to estimate SAR distribution for any arbitrary object inside the coil. Additionally, user-friendly software tool is developed in order to make these simulations easily. Experimental results show that our tool is more accurate than the other software tool, which uses lumped circuit element model.
7. References
1. C. Hayes et al., “An efficient, highly homogeneous radiofrequency coil for whole-body NMR imaging at 1.5T,” Journal of
Magnetic Resonance, Vol. 63, pp.622-628
(1985)
2. C. Chen et al., “Quadrature detection coils–a further √2 improvement in sensitivity,” Journal
of Magnetic Resonance, Vol. 54, pp. 324-327
(1987)
3. G. Giovannetti et al., “A fast and accurate simulator for the design of birdcage coils in MRI,” Magnetic Resonance Materials in
Physics, Biology and Medicine, Vol. 15,
pp.36-44 (2002)
4. C.-L. Chin et al., “Birdcagebuilder: Design of specified-geometry birdcage coils with desired current pattern and resonant frequency,”
Concepts in Magnetic Resonance, Vol.15, no. 2,
pp. 156-163 (2002)
5. J. Jin, Electromagnetic Analysis and Design in
Magnetic Resonance Imaging. CRC Press, Boca
Raton, FL (1989)
6. F. W. Grover, Inductance Calculations. Dover Publications, Inc., Mineola, NY (2004)
7. A. Deutsch et al. ““When are transmission-line effects important for on-chip interconnections?,” Microwave Theory and
Techniques, IEEE Transactions on, Vol.45, pp.
1836-1846 (1997)
8. D. I. Hoult, “The principle of reciprocity in signal strength calculations a mathematical guide,” Concepts in Magnetic Resonance, Vol.12, no.4, pp. 173-187 (2000)
8. Acknowledgements
This study is supported by TÜBİTAK 111E090 project grant.