EGE AKADEMİK BAKIŞ / EGE ACADEMIC REVIEW Doi: 10.21121/eab.795986SS. 231 / 244 Başvuru Tarihi: 31.07.2019 • Kabul Tarihi: 28.06.2020
An Analysis of out of Pocket Education Expenditures in
Turkey: Logit and Tobit Models
Özlem KUVAT
1https://orcid.org/0000-0001-7017-4557
Özlem AYVAZ KIZILGÖL
2https://orcid.org/0000-0001-9996-7892
1Dr. Öğr. Üyesi, Balıkesir Üniversitesi, İİBF, İşletme Bölümü, [email protected] 10145 Balıkesir
2Dr. Öğr. Üyesi, Bandırma Onyedi Eylül Üniversitesi, İİBF, Ekonometri Bölümü,[email protected], Bandırma/Balıkesir ABSTRACT
This study used data acquired from the 2017 Household Budget Survey from the Turkish Statistical Institute and used Logit and Tobit models and researched the risk of out-of-pocket education expenditures creating catastrophic expenditures. The study also researched the interactions of the out-of-pocket education expenditures by 20% income quintile based on the socioeconomic properties of the household. As a result of the analysis, it was seen that the catastrophic and out-of-pocket education expenditures increase in situations in which the household annual income, income quintiles, head of household age and education level increased and in which the household owns the house in which it resides. In case of difficult access to education services and increasing household size per equivalent individual, it was seen that out-of-pocket education expenditures decreased. It was concluded that an increase in the number of preschool children and the number of children studying in primary school and university reduced both expenditures but that an increase in the number of children studying in high school increased these expenditures.
Keywords: Out of pocket education expenditures, catastrophic expenditures, logit model, tobit model, turkey JEL Classification: I21, I22, I32
İD
İD
1. INTRODUCTION
Education carries significant importance for incre-asing the level of welfare for people who live all over the world and especially in developing countries and ensuring economic growth and development. Educa-tion economists must develop policies by considering the importance of education while developing policies and planning investments. Primary school in particular is an important cornerstone in the provision of socio-e-conomic development and the reduction of poverty for countries (Boateng, 2014: 536). It has emerged that educational gains are important not only for the economic welfare of individuals but also for nations. Access to and the completion of education is a key in accumulating human capital and in economic growth. The results of education extend beyond individual and national revenue. Education is also in a position of power that develops multifaceted individuals and establishes more consistent and participatory societies (OECD, 2002: 5).
The concepts of human capital and related educa-tion economy have been widely chosen as a field of study since 1960s. The effect of education in possessing high- and low-income professions in the economy, educational investments influence of personal income distribution, and the role in revealing the income inequ-alities for education level are important research topics. The fact that education is accepted as an investment tool beyond being a consumer product led to the question of who will finance education expenditures considering being made for education (Yolcu, 2011: 13, Yumuşak, 2008: 15).
Although a large portion of education expenditures are covered by the public, the rates of households joining in education costs is gradually increasing. The expenditures that households make to benefit from education services are called the special costs of edu-cation. Special education costs are opportunity costs with direct and indirect expenses. Direct expenses are expenditures like school fees, books, school supplies
and uniforms that households pay for while indirect expenses are expenditures like food and housing. Opportunity costs also represent the income that the student gave up on acquiring by receiving an education rather than working with regards to a different econo-mic activity (Yolcu, 2011: 13).
Some of the households’ income can be used for compulsory consumption expenditures, some for optional consumption expenditures and some for investment purposes. The realization of these expen-ditures also gains importance in the identification of impoverishing effects. An increase in financial burden created by out-of-pocket education expenditures and catastrophic education expenditures over the impo-verished segments of society constitute an important study in the determination of development and welfare (Çınaroğlu and Şahin, 2016: 87). The total out-of-pocket education expenditures for households must be noted in the investigation into the impoverishing effect of the expenditures made out of pocket. The status of the burden of an out-of-pocket expenditure being catast-rophic, meaning the possibility of there being a heavy financial burden, can be measured proportionally to annual total income or expenditure for the financial burden of the education services. The calculation of financial burden is completed under the assumption that family members share their financial resources (Sülkü and Abdioğlu, 2014: 341).
The purpose of this study was to reveal the risks of accruing catastrophic education expenditures for households that education expenditures out of pocket in Turkey. The study, on the one hand, tried to deter-mine with the Logit model the factors that effect the catastrophic education expenditures for households using the 2017 Household Budget Survey and, on the other hand, researched with the Tobit model the determinants for out of pocket education expenditures. The study finally noted the 20% income quintiles and studied the interactions based on socioeconomic levels for the households for out of pocket education expenditures.
Studies regarding education expenditures found in the study are discussed in the second section of this research, analysis results were interpreted by introducing the data set, variables and method used for the empirical analysis in the third section, and the fourth section comprises the presentation of results and recommendations.
2. LITERATURE REVIEW
There are numerous examples of studies performed on the determinants of education expenditures and education financing for households.
The study that Tilak (2002) conducted researched the education expenditures based on different groups for households using data from the “NCAER, Human Development in rural India (HDI)” survey in 1994. Household income and head of household education level were found to be significant as determinants for household expenditures. Household size, class and belief are the other important variables.
Aslam and Kingdon (2008) studied whether the distribution of a household budget for education supported men compared with women in a study they conducted in Pakistan. The indirect expenditure (Engel curve) methodology was used to research prejudice in households on the topic of gender discrimination. According to the acquired results, there is strong evi-dence that there is male bias in education expenditures, especially in the 10-14 and 15-19 age groups. Most of this different treatment shows itself in rural areas.
Mettle et al. (2011) used the Ghana Living Stan-dards Survey Round 4 and tried to determine the rate of households that accrued catastrophic education expenditures in Ghana. The Catastrophic Expenditure Gap (CEG) was calculated for different situations. Ac-cording to the acquired results, the tendency to make catastrophic education expenditures increases when the head of household is female, divorced, or lives in a coastal region. In addition, according to the results of the study, gender, age, head of household education level, household size, and region of settlement are significant determinants for catastrophic education expenditures.
Donkoh and Amikuzuno (2011) used data from the 2006/2007 Ghana Living Standards Survey Round Five (GLSS-V) survey in their study they conducted in Ghana. They created the Logit model to find the socio-economic determinants for the possibility that a household performs education expenditure. As a result of the study, two household categories, which had high possibilities of accruing expenditures for education, were identified. The first of these was the group of households whose head received formal education, that possesses land and vehicles and other durable assets and that lives in forested areas. The other is the households whose head is female and in which live
more children attending school, rural households and the households living far from the capital city.
Qian and Smyth (2011) considered survey data from 32 provinces selected from throughout China in 2003. The study researched education expenditures for the children of parents from two perspectives. First are the factors that influence local education expenditures while second are the factors that influence international education expenditures. According to the results they obtained, household income had significant effects over the size of domestic and international education expenditures. The possibility of a greater expenditure for education is high for children of households whose mothers have a middle school or prep school education and of fathers who work in professional occupations. In addition to this, the possibility of sending children abroad to for education increases in households in the highest income category, with a father who has received a university education, with a permanently employed or secondarily professional mother and that lives in a coastal region.
The study that Andreou (2012) conducted showed that the level of education expenditures for households in Cyprus increased with income over the years. The rates of expenditures households make for special edu-cation varies between 60-90% in the level of primary and middle school education. The most important factors that influence households’ level of education expenditures are income, number of children within the household, region of residence, and age and education level of the head of household. However, the effect of the age and education level of the head of household decreases over time.
Quang (2012) reviewed with the Tobit model the factors that influence household expenditures for the education of children using the Vietnamese Household Living Standards Survey from 2006 (VHLSS 2006). According to the acquired results, it is seen that hou-sehold income significantly affects the total amount of education expenditures. The possibility of making education expenditures increases in households in which the heads of household have a higher level of education and have a professional job. Households with primary- or middle-school-aged children accrue more expenditures for education, and those preschool- or university-aged children accrue fewer expenditures.
Sulaiman et al. (2012) reviewed the determinants of the demand for education for households in Malaysia using household survey data acquired from 10
pro-vinces in their study. They also noted the awareness of parents on the topic of globalization in their children’s education. According to the results of the study, some characteristics of parents are variables that are influen-tial in the education expenditures of children. Among these are household income, mother’s employment status, head of household job category, and household education level. The variable of awareness of parents as to the effects of globalization significantly affected education expenditures.
According to the study using the Engel model made by Azam and Kingdon (2013) in India, pro-male gender bias occurred in the allocation of domestic education expenditures in 1993-2005 despite significant progress in gender equality in education. It is decided to enroll the sons, not the girls in the middle school age group. Bias is significantly higher in rural than urban areas.
Ahmad and Batul (2013) analyzed the situation of poverty and education in Pakistan. Considering the 1971-2011 period, they studied the Granger causality relationship between the variables of poverty, educa-tion expenditures and educaeduca-tion status. The research also included the variables of the percentage of the po-pulation within the national limits of poverty, the adult literacy rate above the age of 15, the percentage of total state expenditures, and the total school life expectancy. The research determined that there existed a strong single-directional causality relationship between total school living expectations and poverty in Pakistan. It is seen that there is a two-way causality relationship between the rate of adult literacy and poverty.
Rizk and Owusu-Afriyie (2014) examined the deter-minants of education expenditures they made for the households of children using data acquired from the 2010/2011 Egyptian Household Income, Expenditure and Consumption Survey in their study. In the study, they researched the effects of income and of the chara-cteristics of the household regarding the distribution of education expenditures among school-aged children. The Ordinary Least Squares (OLS) and Generalized Method of Moments (GMM) were used. The education level for the head of household gradually created a more positive impact. It was specified that expenditures made for children’s education increased significantly together with the increase in the household income level.
The aim of Habibov and Cheung (2016)’s study is to determine the impact of informal out-of-pocket pay-ments on satisfaction from education in the countries
of the former Soviet Union and Mongolia. Therewithal the interaction model shows that the negative impact of paying unofficial out-of-pocket payments decreases as the quality of education increases. As the quality of education deteriorates, the negative impact of paying informal out-of-pocket payments increases significant-ly. These findings also suggest that more efforts should be made to reduce corruption.
In the study of Rizk and Abou-Ali (2016), a compara-tive study was presented for the pattern of household education expenditures using different population groups. In the study Harmonized Household Income and Expenditure Surveys (HHIES) data were obtained from four countries. The datasets used consisted of 2009 for Sudan and 2010/2011 for Egypt, Jordan and Palestine. In the study, the determinants of family spending on education for different population groups and the size of household spending for schooling were examined. In the study, a certain degree of consistency was found in education spending patterns among countries.
In the study of Wongmonta and Glewwe (2017), gender bias was investigated in the allocation of educational resources in Thailand. Data on education expenditures were used from the 2009 Socioeconomic Survey, including certain types of education expendi-tures. In the empirical study, the curves of Engel were estimated and gender bias was tested. The results show that girls receive more education.
The aim of the study of Zhang and Zhou (2017) is to examine the impact of household education expen-ditures on the performance of the National College Entrance Exam (NCEE) in China. Using a comprehensive data set with a sample size of 5840 students gathered in Jinan, China, this study found that the average impact of household education spending on NCEE performan-ce was not significant, but could have a significant and positive effect on those with higher test scores.
Ebaidalla (2018) reviewed the factors that influence the education expenditures of household in Sudan using National Baseline Household Survey (NBHS) data from 2009 for national, urban, and rural areas. The study used the Tobit model. According to the results, household income, head of household education, household size, number of school-aged children, and residence in urban areas are the most important factors that influence education expenditures.
In their study, Acerenza and Gandelman (2019) analyzed households’ educational spending using
micro data from income and expenditure surveys for 12 Latin America, Caribbean countries and the USA. Bahamas, Chile and Mexico have the highest household spending in education, while Bolivia, Brazil and Para-guay have the lowest share. Higher education is the most important form of spending. According to the results obtained, gender bias was not found in primary education. More educated and richer household heads spend more on the education of household members. Urban households spend more than rural households. There are studies that have been conducted in Turkey on the topic of education expenditures. Some of these were summarized below.
Tansel and Bircan (2006) completed the analysis of expenditures made for private tutoring centers in Tur-key with the Tobit model. They used data from the 1994 Household Budget Survey. As a result of the analysis, it was concluded that households whose parents are high-income and have high levels of education transfer more resources to private tutoring centers. Also, ex-penditures tied to the age of the head of household exhibited, but a decreasing rate.
Tansel and Bodur (2012) study, male wage inequa-lity in Turkey during the period from 1994 to 2002 and studied the returns to education. It is aimed to estimate Mincerian wage equations using normal least squares and quantile regression techniques. According to the obtained results were higher male wage inequality in Turkey. Education level had a positive effect on wage inequality.
In the study of Güriş and Çağlayan (2012), human capital theory was taken into account for wage deter-mination. The differences in wage differences between education returns, returns and genders were analyzed. This study provides evidence for the return of education in Turkey. For this, Mincerian wage equation by using OLS, robust and resistant regressions were used. The results clearly show that return training for female employees is higher than male employees. However, when the results of experience returns were analyzed, it was seen that men definitely had higher returns than women in 2003 and 2006.
Ulusoy and Yolcu (2013) used data from 707 households with varying socioeconomic feasibilities in the 2011-2012 academic year in the province of Kastamonu. They performed the data analyses with the Kruskal Wallis H Test, t-test, and ANOVA test. Based on the acquired results, household education expen-ditures vary significantly based on the socioeconomic
environment of the school and transportation type. But the form of education created no significant difference. The education expenditures of families differentiate based on with whom the child lives, parental levels of education, parental occupational status, income level of the household, type of home residence, number of children studying in primary school and grade of enrollment.
Güngör and Göksu (2013) researched the topic of financing education in Turkey in their study and perfor-med an international comparison. The study used data obtained from the World Bank, OECD, EUROSTAT and BUMKO in the comparison of education expenditures and mentioned the education budget goal for the futu-re. As a result of the study, it was concluded that there was not adequate education financing in Turkey and that there existed differences between the countries.
Sülkü and Abdioğlu (2014) utilized the “Household Budget Survey” data in the study they conducted for the years 2003 and 2009 and comparatively studied the financial burden of out-of-pocket education ex-penditures over the income of households. They used the variables of income level, household type, income percentages, head of household education status, level of education, and status of access to education services. It was seen that situations of an increase in the education level of the head of household, increase in the household income level, being located in a city, living in socioeconomically developed regions, and having at least one child over the age of 18 increased the heavy financial burden of education expenditures. It was determined on the topic of access to education services that those living in rural areas and the impo-verished were at a disadvantage.
Acar et al. (2016) estimated education expenditures for income groups with the Tobit model based on the Household Budget Survey data for the years 2003, 2007, 2012 and analyzed income elasticity for education expenditures with the Engel curve in their study. The variables of residing in rural areas, working status, age, head of household education, household size, shares within the household of female students and primary school students, and the total number of students were considered as demographic characteristics for the household. Based on the results of the analysis, education expenditure flexibility grew for all income groups. Although household size was significant in all estimations, the head of household education status was not found to be significant in any estimate. And despite the expenditures in households living in urban
areas being higher in 2003, they decreased in later years and were not meaningful.
Patrinos, Psacharopoulos and Tansel (2019) study in 2017 Household Labor Force Survey, the authors estimated the private and social returns on investment in education in Turkey by using the data. According to the results obtained, the average schooling income is 7.9 percent in the public sector and higher in the private sector compared to 6.5 percent. In addition, the private return to vocational secondary education is higher with 6.5% compared to general secondary education 5.7.
There are numerous examples of studies conducted on financing education and the education expenditures of households in the literature. But the impoverishing effect of households’ out-of-pocket expenses, meaning catastrophic expenditures, was realized more in the field of healthcare than education (Waggstaff and Do-orslaer, 2003: 921; Xu et al., 2007: 973, Yereli et al., 2014: 281, Kuvat and Ayvaz Kızılgöl, 2018). In the literature, there is only the study by Sülkü and Abdioğlu (2014) regarding catastrophic education expenditures. This study completed a heavy financial burden definition for out-of-pocket expenditures; performed a detailed review for income level, household type, income percentages, head of household education status, rural-urban divide, lived region, education level and status of access to educational services; and completed separate evaluations with these variables.
The literature contribution of this study has four di-mensions: First is the revelation of the determinants of the education expenditures that households make out of pocket and the determinants of catastrophic educa-tion expenditures and the measurement of the effect of these determinant factors over these expenditures. Second is the identification of the interaction of the education expenditures made out of pocket in terms of socioeconomic characteristics based on 20% income quintiles for the household. Third is the determination of the risk of out of pocket education expenditures being catastrophic. Fourth is that this study is one of the first conducted on this topic, differently from the studies found in the literature because no other study was encountered in the literature other than that which Sülkü and Abdioğlu (2014) conducted regarding catastrophic expenditures in the field of education in Turkey. It is also a study with a newer and larger-scale data set for Turkey.
3. DATA SET AND METHOD 3.1 Data Set and Variables
The study identified households that perform catastrophic education expenditures and attempted to determine the factors that affect these households’ catastrophic education expenditures. The education expenditures households make out-of-pocket were analyzed by considering the socioeconomic properties of the households. The study also studied the interacti-ons based on socioeconomic levels for the households for education expenditures made out of pocket for the 20% income quintiles.
The data used in the study was obtained from the 2017 TUIK Household Budget Survey microdata. The Household Budget Survey is one of the most impor-tant resources that provides information about the socioeconomic structures, levels of life, and models of consumption for households and is used to identify the needs of society, to know how usable income is dist-ributed among households and members, and to test the validity of implemented socioeconomic policies. Information is compiled about types of consumption expenditure and the diversity of goods and services expenditures, the socioeconomic characteristics of the household, the employment status of members of the household, the total income of the household, the resources obtained with the income, and similar topics with this survey that reveals the consumption structu-res and income levels of individuals and the households they create based on socioeconomic group, rural, urban, and regions (www.tuik.gov.tr). There are three separate data sets in which household, member, and expenditure information are found in the Household Budget Survey. In these data sets are the variables re-garding households, the variables rere-garding members, and the variables for consumption expenditure found based on 12 expenditure-groups comprising all goods and services expenditures that the household made in the month of the survey. This study used the education expenditures and total household expenditures found in the 10th group. The education expenditures in the 10th group are classified as expenditures relating to preschool, primary school, high school, post-secondary education and pre-higher education, university educa-tion and educaeduca-tion that cannot be defined based on level (computer course, foreign language course, music and drawing course, exam form fees, and private class fees). The education expenditures of the household are all the expenditures made out-of-pocket to access educational products and services.
The 2017 Household Budget Survey was admi-nistered to a 1296 sample households each month for an annual total of 15552 sample households over the course of a year between January 1-December 31, 2017. Information was included for a total annual 12166 households because 3386 households did not respond to the survey. This study did not include all households in the Household Budget Survey into the analyses. The analyses included households whose total education expenditure was greater than zero, meaning households that made education expenditures. Thus, the analyses were completed with 2781 households.
In line with the studies in the literature, three variables were identified as the factors that determine the catastrophic education expenditures and the de-terminants for out-of-pocket education expenditures. These are variables relating to the head of household (age, gender, education status, marital status, and employment status of the head of household), vari-ables relating to the characteristics of the household (household income, 20% income quintiles, household type, ownership status of household, status of access to education services, and per equivalent adult hou-sehold size), and variables relating to students in the household (number of preschool-aged children, and number of primary-aged children, high school-aged children, and university-aged children). Households are separated into 20% income quintiles based on annual total disposable income while creating the 20% income quintiles, and the houses found in the 1st 20% income quintile are defined as the poorest while the houses in the 5th 20% income quintile are defined as the richest. The per equivalent adult household size is the renewed OECD equivalence scale and was taken from the Household Budget Survey.
3.2 Method
The factors that determine catastrophic education expenditures were analyzed using the Logistic regres-sion method because the status of whether or not to accrue catastrophic education expenditure assumes a two-result value and the data are more consistent with the model. Catastrophic education expenditure is evaluated with the rate of household education expenditures to total consumption or income. This rate’s exceeding certain threshold values is qualified as a catastrophe. There is no accepted approach in the literature regarding this threshold level. In some studies, 2.5%, 5%, 10%, 15%, and 20% are accepted as threshold values (Yereli et al., 2014: 281).
Households whose total education expenditure was greater than zero were considered in the study. The total
expenditures and total education expenditures for the households were made real with the CPI. Catastrophic education expenditures are defined as the rate of the education expenditures a household makes to the total expenditures:
Catastrophic Education Expenditure = Total household education expenditures / Total household expenditures
It is explained with the measurement of catastrophe with consumption rather than income, consumption being relatively more balanced than income, and inco-me being more perceptive to conjectural fluctuations (Yereli et al., 2014: 281, Xu et al., 2007: 973). And con-sumption is evaluated as a better indicator compared with income in the empirical literature and is influenced less by measurement errors (Acar et al., 2016: 10). If the catastrophic education expenditure is equal to or greater than the threshold values mentioned above, then these households are specified as households that make catastrophic education expenditures. Therefore, the dependent variable of the Logit model takes a value of 1 for households that make catastrophic education expenditures and a value of 0 for households that do not. This study determined the households that do and do not make catastrophic education expenditures while noting the threshold values as 5%, 10%, and 20%. But the model was created regarding catastrophic education expenditures compared based on only a 5% threshold because statistically significant conclusions could not be reached in the models in which the factors
that effect catastrophic education expenditures based on 10% and 20% thresholds were specified.
The education expenditures that households make out of pocket were analyzed from the Tobit model by noting the socioeconomic characteristics of the household. This study was selected as a Tobit model estimation method because it possessed an aggrega-tion at the zero point for the distribuaggrega-tion of educaaggrega-tion expenditures. This is because this method allows for the aggregation of the distribution for dependent variables at a point.
On the other hand, households were separated into 20% income quintile based on their annual total dispo-sable income and the interactions of the household’s out-of-pocket education expenditures based on the socioeconomic characteristics they possessed were reviewed using the Tobit models based on each income quintile. The dependent variables for the Tobit models are a logarithm for the total education expenditures for households.
4. ANALYSIS RESULTS
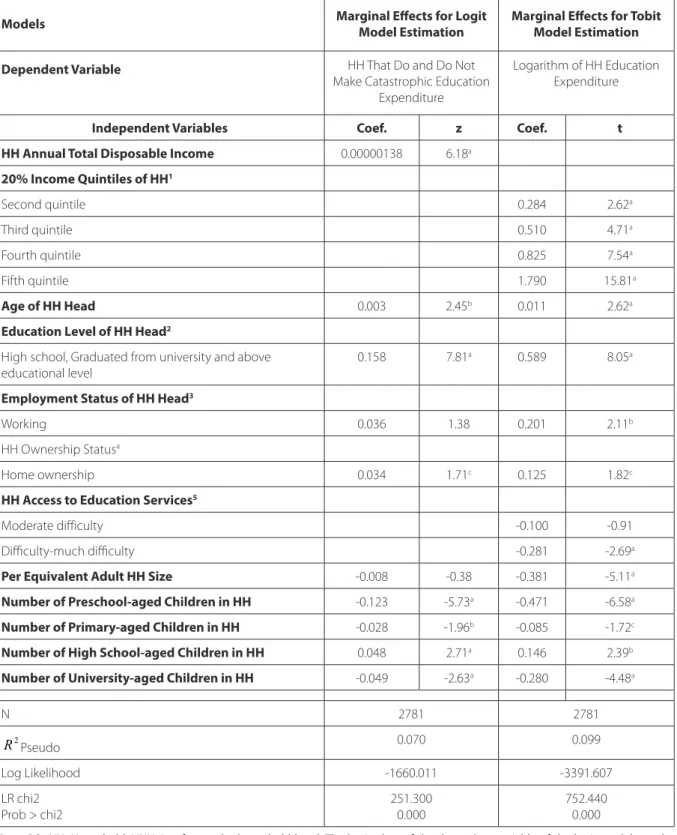
The empirical section of the study primarily deter-mined the factors that affect catastrophic education expenditures for households and tried to reveal the effect of these factors over catastrophic education expenditures with help from the Logit model. The determinants for the education expenditures that households make out of pocket were analyzed with the help of the Tobit model. Table 1 presents the marginal effects for the Logit and Tobit model estimations.
Table 1: The Marginal Effects of the Logit and Tobit Model Estimations
Models Marginal Effects for Logit Model Estimation Marginal Effects for Tobit Model Estimation
Dependent Variable HH That Do and Do Not
Make Catastrophic Education Expenditure
Logarithm of HH Education Expenditure
Independent Variables Coef. z Coef. t
HH Annual Total Disposable Income 0.00000138 6.18a
20% Income Quintiles of HH1 Second quintile 0.284 2.62a Third quintile 0.510 4.71a Fourth quintile 0.825 7.54a Fifth quintile 1.790 15.81a Age of HH Head 0.003 2.45b 0.011 2.62a
Education Level of HH Head2
High school, Graduated from university and above
educational level 0.158 7.81
a 0.589 8.05a
Employment Status of HH Head3
Working 0.036 1.38 0.201 2.11b
HH Ownership Status4
Home ownership 0.034 1.71c 0.125 1.82c
HH Access to Education Services5
Moderate difficulty -0.100 -0.91
Difficulty-much difficulty -0.281 -2.69a
Per Equivalent Adult HH Size -0.008 -0.38 -0.381 -5.11a
Number of Preschool-aged Children in HH -0.123 -5.73a -0.471 -6.58a
Number of Primary-aged Children in HH -0.028 -1.96b -0.085 -1.72c
Number of High School-aged Children in HH 0.048 2.71a 0.146 2.39b
Number of University-aged Children in HH -0.049 -2.63a -0.280 -4.48a
N 2781 2781 2 R Pseudo 0.070 0.099 Log Likelihood -1660.011 -3391.607 LR chi2 Prob > chi2 251.300 0.000 752.440 0.000
Note: P.S.: HH: Household, HHH: It refers to the household head. The basic class of the dependent variable of the logit model are, the
households whose catastrophic education expenditure level is less than 5% threshold. For the dependent variable of the Tobit model, ln (household education expenditures) = 2.534, the number of observations from the left censored is 1390 and the number of uncensored observations is 1391. The main classes of the independent variables are (1): 1. 20% income bracket, 2: Illiterate or primary school graduates, 3: Not working, 4: Tenants, lodging or homeowners, 5: Easy-very easy. a, b and c show the statistical significance of the coefficients at 1%, 5% and 10% significance levels, respectively.
When evaluating the analysis results found in Table 1, an increase of the annual income of the household
increases the possibility of the household accruing catastrophic education expenditures. The education
expenditures made by households found in the 2nd, 3rd, 4th and 5th 20% income quintiles are greater than the households found in the 1st 20% income quintile. This is because households in the 1st 20% quintile, which contains the most impoverished families, spend a significant portion of their incomes for their needs but are able to set aside only a small portion of their budgets for education expenditures. Therefore, this finding in the analysis is consistent with expectations. The results found for household income and percenta-ge income quintiles exhibit similarities with the results of Qian and Smyth (2011) and Ebaidalla (2018). As the age of the head of household increases, it is observed that the level of catastrophic education expenditures and out-of-pocket education expenditures increase compared to the 5% threshold value for the household. This is consistent with the results obtained by Acar et al. (2016), Ebaidalla (2018), Sulaiman et al. (2012) and And-reou (2012). It was seen that the catastrophic education expenditures for households in which the head has completed high-school, university, or postgraduate stu-dies increased compared with the households in which the head is illiterate or is a primary school graduate and that out-of-pocket education expenditures similarly increased. In the literature, the head of household is expected to be educated and to be a positive effect over the education investments of his or her children. Heads of household with high levels of education are more conscious about the importance of education and can make greater education expenditures for the education of their children. The results acquired in this study support the conclusion of Acar et al. (2016), Eba-idalla (2018) and Quang (2012). While the employment status of the head of household is not effect over the ca-tastrophic level of expenditure, it effects out-of-pocket expenditures in a statistically significant manner. When comparing heads of household who work with those who do not work, it is determined that the households made greater out-of-pocket education expenditures. Qian and Smyth (2011) reached the same conclusion when reviewing the literature. Home ownership in households increases both catastrophic expenditures and expenditures made from their own budgets for education compared with home renters, public housing and those who do not own their home. When regarded from the perspective of household access to education services, it is seen that the out-of-pocket education expenditures of households that have some or much difficulty accessing education services decrease relative to households that can access easily or very easily. While per equivalent adult household size is not a
determi-nant factor over catastrophic education expenditures, it does have a statistically significant effect over the education expenditures that the household makes out of pocket. An increase in the number of members living in the household decreases expenditures the household makes for education. Because there is a patriarchal family structure in Turkey, it is a common situation for large families (crowded families compri-sing parents, child/ren, grandparents, aunts, uncles and similar relatives) to live together in the same household. This situation is more often compared in lower-educa-tion households (in low-income households). In other words, impoverished households are generally more crowded than high-income households. They can, for this reason, set aside a smaller portion of their income for education expenditures. In this situation, the size of household is expected to have a negative effect on education expenditures. The conclusion reached in this study meets expectations. When reviewing the education expenditures in terms of the number of children being educated per household in Table 1, it is seen that catastrophic education expenditures and education expenditures the household makes from its own budget decrease should the number of preschool children and the number of children studying in pri-mary school and university increase but also that the possibility of both expenditures increases should the number of children studying in high school increase. Textbooks have been distributed to students for free in our country since 2004. Therefore, it appears to be a result that expects education expenses for children studying in primary school to be few. The ability for students studying at university to fund their own edu-cation expenditures by working is relevant. Thus, the limited amount of education expenditures for children studying at university is an expected result. But because students studying in high school must go to tutoring centers or take special courses to be able to prepare to take the university entrance exam, they are forced to set aside a significant portion of their household incomes for education expenditures. In other words, the finding of education expenditures being greater for students studying in high school meets expectations.
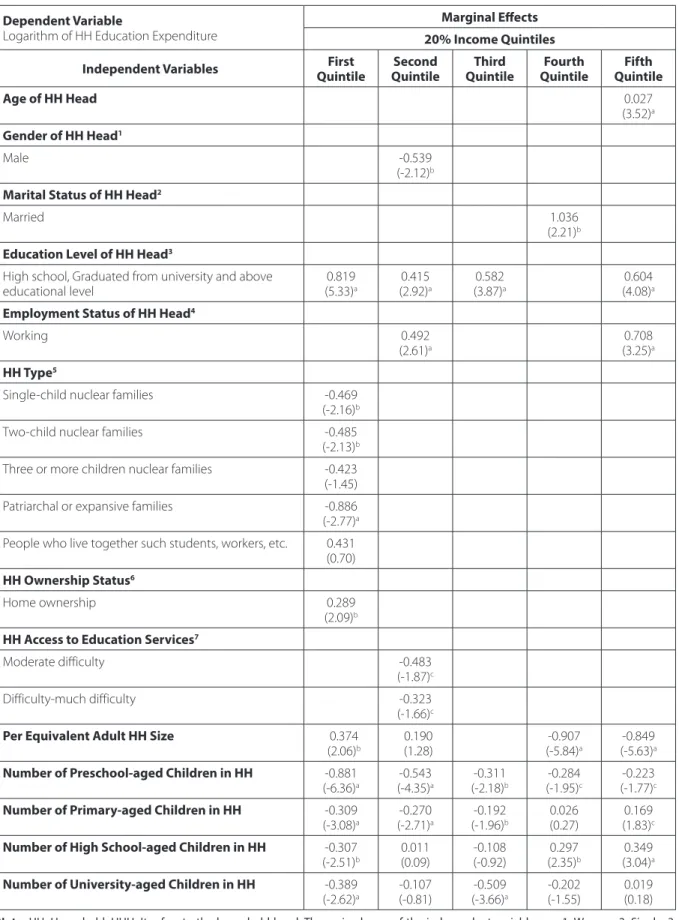
The study also studied the interactions based on socioeconomic levels for the households for education expenditures made out of pocket for the 20% income quintiles using Tobit models. Households found in the 1st 20% income quintile were specified as the poorest and those found in the 5th 20% income quintile were specified as the richest. Table 2 provides the marginal effects for Tobit model estimations.
Table 2: Marginal Effects for Tobit Estimations for Household Education Expenditure by Income Quintile
Dependent Variable
Logarithm of HH Education Expenditure
Marginal Effects 20% Income Quintiles
Independent Variables QuintileFirst Quintile Second QuintileThird QuintileFourth QuintileFifth
Age of HH Head 0.027
(3.52)a
Gender of HH Head1
Male -0.539
(-2.12)b Marital Status of HH Head2
Married 1.036
(2.21)b Education Level of HH Head3
High school, Graduated from university and above
educational level (5.33)0.819a (2.92)0.415a (3.87)0.582a (4.08)0.604a
Employment Status of HH Head4
Working 0.492
(2.61)a (3.25)0.708a
HH Type5
Single-child nuclear families -0.469
(-2.16)b
Two-child nuclear families -0.485
(-2.13)b
Three or more children nuclear families -0.423
(-1.45)
Patriarchal or expansive families -0.886
(-2.77)a
People who live together such students, workers, etc. 0.431 (0.70)
HH Ownership Status6
Home ownership 0.289
(2.09)b HH Access to Education Services7
Moderate difficulty -0.483
(-1.87)c
Difficulty-much difficulty -0.323
(-1.66)c
Per Equivalent Adult HH Size 0.374
(2.06)b 0.190 (1.28) (-5.84)-0.907a (-5.63)-0.849a
Number of Preschool-aged Children in HH -0.881
(-6.36)a (-4.35)-0.543a (-2.18)-0.311b (-1.95)-0.284c (-1.77)-0.223c
Number of Primary-aged Children in HH -0.309
(-3.08)a (-2.71)-0.270a (-1.96)-0.192b (0.27)0.026 (1.83)0.169c
Number of High School-aged Children in HH -0.307
(-2.51)b 0.011(0.09) -0.108(-0.92) (2.35)0.297b (3.04)0.349a
Number of University-aged Children in HH -0.389
(-2.62)a -0.107(-0.81) (-3.66)-0.509a (-1.55)-0.202 0.019(0.18)
Note: HH: Household, HHH: It refers to the household head. The main classes of the independent variables are 1: Women, 2: Single, 3:
Illiterate or primary school graduates, 4: Not working, 5: Children without children or single adults, 6: Tenants, lodging or homeowners, 7: Easy-very easy. Values in parentheses are t statistics. a, b and c show the statistical significance of the coefficients at 1%, 5% and 10% significance levels, respectively.
According to Table 2, education expenditures increase for the households characterized as the richest as the age of the head of household increases. Education expenditures of households whose head is male decrease in the 2nd 20% quintile compared with those whose heads of household are female while the education expenditures of households whose head is married increase compared with those whose heads are unmarried. The education expenditures that househol-ds whose head has completed high-school, university, or post-graduate studies increase in all income quintiles relative to the households whose head is illiterate or has graduated from primary school. When comparing heads of household who work with those who do not work, it is observed that education expenditures increase in the 2nd and 5th 20% income quintiles. When evaluating in terms of household type, it was concluded that the education expenditures lowered in single-child and two-child nuclear families and in male-dominated or expansive families compared with families without children or single-parent families in the income qu-intile defined as the poorest (1st 20%). It is seen that households comprising people who live together such students, workers, etc. and nuclear families with three or more children had no statistically significant effect over out-of-pocket education expenditures. The household owning its home increases education ex-penditures relative to being a renter, residing in public housing, or not being a home owner. Households that own their home make greater education expenditures compared with others. When evaluated in terms of access to education services, those who have moderate difficulty, difficulty, or much difficulty accessing make fewer education expenditures compared with those who easily or very easily access education. When the number of individuals living in the household increases, education expenditures increase in the 1st 20% income quintile while decreasing in the 4th and 5th income quintiles. When evaluating education expenditures based on school-aged children in a household, the education expenditures decrease in all income qu-intiles when the number of preschool-aged children increases. Should the number of children studying in primary school increase, expenditures decrease in the first three income quintiles while the out-of-pocket education expenditures increase in the richest income quintile. An increase in the number of children studying in high school in a household reduces the education expenditures for households in the poorest income quintile (1st 20%) while increasing in the rich income quintiles (4th and 5th 20%). Finally, an increase in the
number of children studying at university within the household reduced the education expenditures for the poorest and average-income families.
5. CONCLUSION
In this study, using the logit and Tobit models in Tur-key in 2017 with the data obtained from the Household Budget Survey of factors affecting catastrophic educa-tion expenditures of households and determinants of out-of pocket education expenditures is evaluated. The results of the study show that some characteristics of households and parents are incredibly important in the determination of household education expenditures. According to the results obtained from the Logit and Tobit analyses, as the annual household income, age of the head of household and the education level increase and in situations where the household owns the home, the catastrophic household education expenditures and out-of-pocket education expenditures increase compared to a 5% threshold value. Compared to the households in the 1st 20% income quintile, the out-of-pocket education expenditures in the other percentage income quintiles is greater. Households in the 1st 20% quintile, which contains the most impo-verished families, spend a significant portion of their incomes to resolve their needs and are able to set aside only a small portion of their budgets for education expenditures. In situations where access to educati-onal services is difficult or very difficult and when the number of individuals living in a household increases, out-of-pocket education expenditures decrease. The increase in the number of pre-school-, primary-school-, university aged children receiving an education in the household reduces the catastrophic education expen-ditures and the out-of-pocket education expenexpen-ditures. Despite this, both expenditures exhibit an increase when the number of children studying in high school increases. Even if the employment status of the head of household is not effect over the catastrophic level of expenditure, it has a statistically significant effect over out-of-pocket expenditures.
Using the Tobit models, the study also researched the interactions based on socioeconomic levels for the households for out of pocket education expenditures 20% income quintiles. As the age and education level of the head of household increases, education expen-ditures also increase should the head of household be working, married and own the home. On the other hand, the head of household being a male and access to education services being moderate and difficult-very
difficult reduce out-of-pocket education expenditures. Education expenditures decrease in single-child nuc-lear families, two-child nucnuc-lear families and patriarchal or expansive families compared to families without children or single-parent families. An increase in the number of individuals living in the household increases education expenditures in the 1st 20% income quintile while decreasing in the 4th and 5th percentage income quintiles. When reviewing in terms of the number of children, increases in the number of pre-school-, pri-mary-school- and university-aged children generally reduces the education expenditures. An increase in the number of children studying in high school reduces the education expenditures for households in the poorest income quintile (1st 20%) while increasing in the rich income quintiles (4th and 5th 20%).
The development of education opportunities and providing for the continuity of services are two of the main elements in the increase of socioeconomic development. An increase in the amount of support given to education per capita will open the door to multifaceted advancement and the gaining of educa-tional growth. The decrease in out-of-pocket education expenditures and the drop in the possibility of accruing catastrophic expenditures bring along with them an increase in both the quality of education that people receive and people’s length of education. However,
the determination of the amounts of support to be given for educational gains and the determination of to whom the support will be given are important problems that must be resolved. Also; the government should take measures to enable its citizens to benefit from educational opportunities in line with the needs of the labor market. For this reason, it is very important to design a more inclusive education system that enables students to benefit from a diversified environment and to ensure the functioning of this system. Individuals who are educated in this way will reach their highest potential and the results of this will create social and economic gains. These acquired results are a resource that educational economists and decision-makers can use in developing policies, planning investments in education and evaluating education processes that are currently being conducted. In short, we believe that the findings of this study will be beneficial to policy makers in creating an effective, equal and equitable education finance system.
In the continuation of the research, estimating equations for households with students who attend public schools and private schools can be established for policy developers to define private schools and their effects can be analyzed. In addition, trend relationships rather than snapshots can be examined through longi-tudinal long-term studies.
REFERENCES
Acar, E. Ö., Cilasun, S. M. and Günalp, B. (2016, April). An Analysis of Education Expenditures in Turkey by Income Groups. The Economic Research Forum Working Papers (No. 991), 1-28.
Acerenza, S., and Gandelman, N. (2019). Household Education Spending in Latin America And The Caribbean: Evidence From Income And Expenditure Surveys. Education Finance and Policy, 14(1), 61-87. Ahmad, Z. and Batul, T. (2013). Relationship among
Pov-erty, Education Expenditure, and Education Status: Empirical Evidence from Pakistan.. In Proceedings of the World Congress on Engineering (1), 3-5.
Andreou, S. N. (2012). Analysis of Household Expendi-ture on Education In Cyprus. Cyprus Economic Policy Review, 6(2), 17-38.
Aslam, M. and Kingdon, G. G. (2008). Gender and House-hold Education Expenditure In Pakistan. Applied Economics, 40(20), 2573-2591.
Azam, M., and Kingdon, G. G. (2013). Are Girls The Fairer Sex in India? Revisiting Intra-Household Allocation Of Education Expenditure. World Development, 42, 143-164.
Boateng, N. A. (2014). Does Public Expenditure Man-agement Matter For Education Outcomes?. Devel-opment Southern Africa, 31(4), 535-552.
Çınaroğlu, S. and Şahin, B. (2016). Katastrofik Sağlık Harcaması ve Yoksullaştırıcı Etki. Hacettepe Sağlık İdaresi Dergisi, 19(1), 73-86.
Donkoh, S. A. and Amikuzuno, J. A. (2011). The Deter-minants Of House Hold Education Expenditure in Ghana., Educational Research and Reviews, 6(8), 570-579.
Ebaidalla, E. M. (2018). Understanding Household Education Expenditure In Sudan: Do Poor and Rural Households Spendless on Education?. African Journal of Economic Review, 6(1), 160-178.
Güngör, G. and Göksu, A. (2013). Türkiye’de Eğitimin Finansmanı ve Ülkelerarası Bir Karşılaştırma. Yönetim ve Ekonomi: Celal Bayar Üniversitesi İktisadi ve İdari Bilimler Fakültesi Dergisi, 20(1), 59-72.
Güriş, S., and Çağlayan, E. (2012). Returns To Education And Wages In Turkey: Robust And Resistant Regres-sion. Quality and Quantity, 46(5), 1407-1416. Habibov, N., and Cheung, A. (2016). The Impact Of
Unof-ficial Out-Of-Pocket Payments On Satisfaction With Education in Post-Soviet Countries. International Journal of Educational Development, 49, 70-79.
Kuvat, Ö. and Ayvaz Kızılgöl, Ö. (2018, December). Türki-ye’de Katastrofik Sağlık Harcamaları: 2016 Hanehalkı Bütçe Araştırmasının Analizi, II. International Sym-posium on Economics, Finance and Econometrics, Bandırma Onyedi Eylül Üniversitesi, Balıkesir. Mettle, F. O., Nortey, E. N., Aikins, M. and Ennin, C. (2011).
Catastrophic Spending on Education in Ghana: An Analysis of the Ghana Living Standards Survey (Fourth Round). Research Journal of Mathematics and Statistics, 3(4), 123-129.
OECD (2002). Financing Education, Executive Summary, Investment and Returns Analysis of the World Edu-cation Indicators, UNESCO/UIS, Paris.
Patrinos, H. A., Psacharopoulos, G., and Tansel, A. (2019). Returns To Investment in Education: The Case Of Turkey. Turkish Economic Association Discussion Paper 2019/2, 22 pages.
Qian, J. X. and Smyth, R. (2011). Educational Expenditure in Urban China: Income Effects, Family Characteris-tics and The Demand For Domestic and Overseas Education. Applied Economics, 43(24), 3379-3394. Quang, V. (2012). Determinants of
Educational Expen-diture in Vietnam. International Journal of Applied Economics, 9(1), 59–72.
Rizk, R. and Owusu-Afriyie, J. (2014). Determinants of Household Expenditure on Childrens Education in Egypt. International Journal of Education Economics and Development, 5(4), 332-360.
Rizk, R., and Abou-Ali, H. (2016, May). Out Of Pocket Education Expenditure And Household Budget: Evidence From Arab Countries. Economic Research Forum Working Papers (No. 996).
Sulaiman, N., Ismail, R., Othman, N. and Tin, P. B. (2012). The Determinants of Demand For Education Among Households In Malaysia. International Business Man-agement, 6(5), 558-567.
Sülkü, S. N. and Abdioğlu, Z. (2014). Cepten Yapılan Eğitim Harcamalarının Hanehalkı Gelirine Mali Yükü: Türkiye İçin İstatistiksel Bir Analiz. Yönetim ve Ekonomi Araştırmaları Dergisi, 12(24), 338-355. Tansel, A. and Bircan, F. (2006). Demand for Education In
Turkey: A Tobit Analysis of Private Tutoring Expendi-tures. Economics Of Education Review, 25(3), 303-313. Tansel, A., and Bodur, F. B. (2012). Wage Inequality And
Returns To Education In Turkey: A Quantile Regres-sion Analysis. Review of Development Economics, 16(1), 107-121.
Tilak, J. B. (2002). Determinants Of Household Expen-diture on Education in Rural India. National Council of Applied Economic Research, (No. 88). New Delhi: TÜİK (2017), Hanehalkı Bütçe Anketi Mikro Veri Seti,
Ankara.
TÜİK, http://www.tuik.gov.tr (01.01.2019).
Ulusoy, B. and Yolcu, H. (2014). Household Expenditures on Education by Parents of Students Attending Pub-lics Chools at the Primary Education Level. Kasta-monu Education Journal, 22(3), 1091-1112.
Wagstaff A. and Van Doorslaer E. (2003). Catastrophe and Impoverishment in Paying for Health Care: With Applications to Vietnam 1993-1998. Health Economics,12(11), 921-34.
Wongmonta, S., and Glewwe, P. (2017). An Analysis Of Gender Differences In Household Education Expenditure: The Case Of Thailand. Education Eco-nomics, 25(2), 183-204.
Xu, K.,Evans, D. B., Kadama, P., Nabyonga, J., Ogwal, P. O., Nabukhonzo, P. and Aguilar, A. M. (2007). Un-derstanding the Impact of Eliminating User Fees: Utilization and Catastrophic Health Expenditures in Uganda, Social Science &Medicine, 62, 866-876. Yereli, A. B., Köktaş, A. M. and Selçuk, I. Ş. (2014).
Tür-kiye’de Katastrofik Sağlık Harcamalarını Etkileyen Faktörler. Sosyoekonomi, 2, 273-296.
Yolcu, H. (2011). Hanehalkının Eğitim Harcamalarını Etkileyen Etmenler: Kuramsal Bir Çalışma. Mehmet Akif Ersoy Üniversitesi Sosyal Bilimler Enstitüsü Dergi-si, 3(5), 12-35.
Yumuşak, İ. (2008). Beşeri Sermayenin Iktisadi Önemi ve Türkiye’nin Beşeri Sermaye Potansiyeli. Sosyal Siyaset Konferansları Dergisi, (55), 3-48.
Zhang, Y., and Zhou, X. (2017). Can Higher Household Education Expenditure Improve the National College Entrance Exam Performance? Empirical Evidence from Jinan, China. Current Issues in Comparative Education, 19(2), 8-32.