A SIMULATION MODEL FOR BREAST CANCER
EPIDEMIOLOGY IN TURKEY
A THESIS
SUBMITTED TO THE DEPARTMENT OF INDUSTRIAL ENGINEERING AND THE GRADUATE SCHOOL OF ENGINEERING AND SCIENCE
OF BILKENT UNIVERSITY
IN PARTIAL FULFILLMENT OF THE REQUIREMENTS FOR THE DEGREE OF
MASTER OF SCIENCE
by
Kumru ADA
August, 2014
ii
I certify that I have read this thesis and that in my opinion it is full adequate, in scope and in quality, as a dissertation for the degree of Master of Science.
___________________________________ Asst. Prof. Özlem Çavuş (Advisor)
I certify that I have read this thesis and that in my opinion it is full adequate, in scope and in quality, as a dissertation for the degree of Master of Science.
___________________________________ Prof. Dr. İhsan Sabuncuoğlu (Co – Advisor)
I certify that I have read this thesis and that in my opinion it is full adequate, in scope and in quality, as a dissertation for the degree of Master of Science.
______________________________________ Assoc. Prof. Oğuzhan Alagöz
I certify that I have read this thesis and that in my opinion it is full adequate, in scope and in quality, as a dissertation for the degree of Master of Science.
______________________________________ Asst. Prof. Alp Akçay
Approved for the Graduate School of Engineering and Science
____________________________________ Prof. Dr. Levent Onural
iii
ABSTRACT
A SIMULATION MODEL FOR BREAST CANCER EPIDEMIOLOGY IN TURKEY Kumru ADA
M.S. in Industrial Engineering Supervisor: Asst. Prof. Özlem Çavuş Co-Supervisor: Prof. Dr. İhsan Sabuncuoğlu
August 2014
Breast cancer has a vital importance in women's life. In the world, breast cancer incidence and mortality rates are increasing. Considering the burden of disease, in 2012 1.67 million women got breast cancer and about 522,000 women died due to breast cancer. With this numbers, breast cancer ranks as the most common cancer among women in the world and the fifth cause of death from cancer overall. Breast cancer has a high incidence and mortality rates especially in developing countries, where late diagnosis of cancer is also increasing the disease burden. Lack of knowledge of the exact causes of breast cancer increases the importance of early detection. The most effective way of early detection is to apply mammography screening. Screening the accurate target population increases the rate of early detection of breast cancer and lessens the economic and health burden of disease. In this study, two simulation models were constructed in order to analyze the population-based mammography screening programs for Turkey. The first model was run for 10 years for validation purpose while the second one was run for the women born in 1980 during their lifetime to analyze several screening programs. The screening programs differ from each other in terms of beginning and final age of screening and screening frequency. Costs and health outcomes of the screening policies were examined and non-dominated screening policies are determined according to these performance measures.
iv
ÖZET
TÜRKİYE’DE MEME KANSERİ EPİDEMİYOLOJİSİ SİMULASYON MODELİ Kumru ADA
Endüstri Mühendisliği Yüksek Lisans Danışman: Yrd. Doç Dr. Özlem Çavuş Eş-Danışman: Prof. Dr. İhsan Sabuncuoğlu
Ağustos 2014
Meme kanseri kadınların hayatında yaşamsal bir öneme sahiptir. Dünyada meme kanseri görülme sıklığı ve ölüm oranları artmaktadır. Hastalık yükü olarak bakıldığında, 2012 yılında 1.67 milyon kadın meme kanserine yakalanmış ve yaklaşık 522,000 kadın meme kanseri nedeniyle ölmüştür. Dünyada, meme kanseri kadınlar arasında en sık görülen kanser çeşididir ve kanser ölümleri arasında beşinci sıradadır. Özellikle gelişmekte olan ülkelerde meme kanseri görülme sıklığının ve ölüm oranlarının çok yüksek olmasının yanı sıra, meme kanseri teşhisinin geç evrelerde yapılmasına bağlı olarak hastalığın yükü de artmaktadır. Meme kanserinin kesin nedenlerinin bilinmemesi hastalığın erken teşhisinin önemini arttırmaktadır. Erken teşhisin en etkili yolu da tarama politikalarının uygulanmasıdır. Doğru risk grubundaki popülasyonu hedef alan bir tarama politikası, erken teşhis oranını arttırmakta ve kanserin hem ekonomik hem de sağlık yükünü azaltmaktadır. Bu çalışmada, Türkiye için toplum tabanlı tarama programları analiz edilmesi amacıyla, iki ayrı simülasyon modeli kurulmuştur. Modellerden ilki doğrulama amacıyla 10 sene için çalıştırılmış, diğeri ise farklı mamografi tarama politikalarının analizinin yapılması amacıyla, 1980 yılında doğan kadınlar için hayatları süresince çalıştırılmıştır. Tarama politikaları, mamografi taramasına başlama ve bitiş yaşı ve tarama sıklığı bilgilerine göre birbirlerinden farklılaşmaktadır. Tarama politikalarının maliyet ve sağlık çıktıları incelenmiş ve baskın olan tarama politikaları bu performans ölçütlerine göre belirlenmiştir.
v
ACKNOWLEDGEMENT
I would like to express my gratitude to Asst. Prof. Özlem Çavuş, Prof. Dr. İhsan Sabuncuoğlu and Assoc. Prof. Oğuzhan Alagöz for their guidance, support, patience and insight. Their help was an irreplaceable guidance from beginning to the end of this research. It is a great pleasure to work with them and learn from them. I am grateful to Asst. Prof. Alp Akçay for his attention in reading the material and his encouraging comments on my thesis.
This study was financed by TUBITAK (The Scientific and Technological Research Council of Turkey), National Scholarship Program no.2210.
Most importantly, I would like to express my sincere appreciation to my mother, Buket Ada, who has been a source of infinite love, moral support and inspiration to me throughout my life and to my father, Mehmet Ada, for his unrequited love, encouragement, support and realizing my potential. And very special thanks go to my brother, Celâl Ada, for his endless support, friendship, guidance and inspiration. I am very lucky to have such a perfect family and I am always proud to be a member of this family.
And I would also like to thank to my dearest friends Ebru Akagündüz, Emel Elmacı, Sezin Ulukütük and Zeynep Özkan for their love and support.
vi
Contents
Chapter 1 ... 11 Introduction ... 11 Chapter 2 ... 17 Literature Review ... 17 Chapter 3 ... 24 Problem Definition ... 24 Chapter 4 ... 27 Model Development ... 27 4.1 General ... 27 4.2 Model ... 28 4.3 Model Data ... 33 Chapter 5 ... 51 Results ... 51 5.1 Validation ... 515.2 Computational Results and Analysis ... 61
Chapter 6 ... 81
Conclusion ... 81
7
List of Figures
Figure 1: Cancer Incidence Rates in Turkey (per 100,000) ... 13
Figure 2: Flow Chart of the First Simulation Model ... 31
Figure 3: Flow Chart of the Second Simulation Model ... 32
Figure 4: Structure of the Screening Decision ... 40
Figure 5: Markov Chain Model... 44
Figure 6: Clinical Diagnose Model ... 45
Figure 7: Breast Cancer Incidence Rates (per 100,000) ... 53
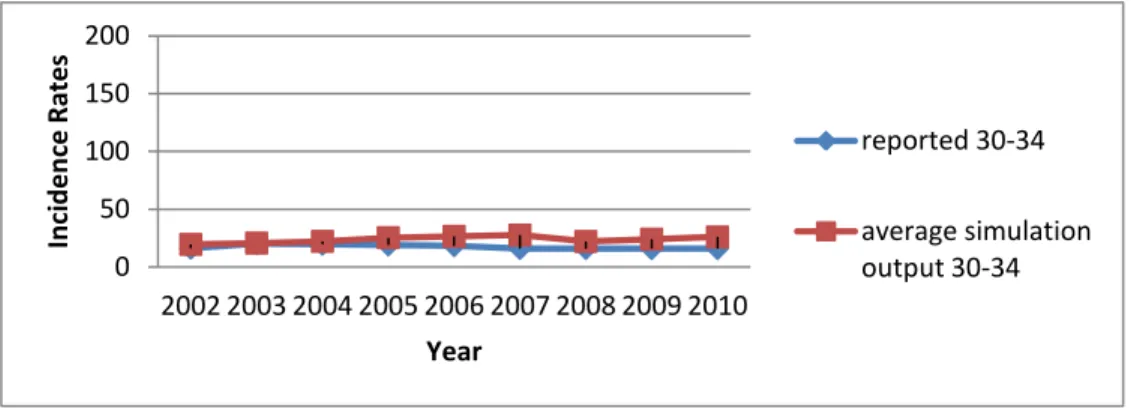
Figure 8: Breast Cancer Incidence Rates for Women Aged Between 30-34 (per 100,000) ... 54
Figure 9: Breast Cancer Incidence Rates for Women Aged Between 35-39 (per 100,000) ... 54
Figure 10: Breast Cancer Incidence Rates for Women Aged Between 40-44 (per 100,000) ... 55
Figure 11: Breast Cancer Incidence Rates for Women Aged Between 45-49 (per 100,000) ... 55
Figure 12: Breast Cancer Incidence Rates for Women Aged Between 50-54 (per 100,000) ... 56
Figure 13: Breast Cancer Incidence Rates for Women Aged Between 55-59 (per 100,000) ... 56
Figure 14: Breast Cancer Incidence Rates for Women Aged Between 60-64 (per 100,000) ... 57
Figure 15: Breast Cancer Incidence Rates for Women Aged Between 65-69 (per 100,000) ... 57
8
Figure 16: Breast Cancer Incidence Rates for Women Aged Between 70-74 (per
100,000) ... 58
Figure 17: Breast Cancer Incidence Rates for Women Aged Over 75 (per 100,000) ... 58
Figure 18: Breast Cancer Mortality Rates (per 100,000) ... 60
Figure 19: Average Incidence Rates (per 100,000) ... 65
Figure 20: Breast Cancer Stage Diagnosis Ratios (percentage)... 67
Figure 21: Breast Cancer Mortality Rates (per 100,000) ... 69
Figure 22: Screening, Treatment, False Positive Result and Total Costs ... 71
Figure 23: The Space of Policies ... 72
Figure 24: QALY-Total Cost for All Alternative Screening Policies ... 78
9
List of Tables
Table 1: Recommended Mammography Screening Policies and Organized
Population-Based Cancer Screening Programs ... 19
Table 2: Female Population in Turkey in 2000 ... 33
Table 3: Number of Women at Age 30 in Turkey ... 34
Table 4: The Reported Breast Cancer Incidence Rates by the Ministry of Health of Turkey for Female Population ... 35
Table 5: Breast Cancer Incidence Rates Estimated by the Ministry of Health of Turkey for all Female Population for Every Five-Year-Age-Group (per 100,000) ... 36
Table 6: Female Population in Turkey ... 37
Table 7: The Estimated Breast Cancer Incidence Rates for Female Population over Age 30 in Turkey ... 38
Table 8: The Number of All Deaths for Female Population in Turkey by Age Group and by Year ... 39
Table 9: The Number of Breast Cancer Deaths for the Female Population in Turkey .... 40
Table 10: The Number of Mammograms Taken in Turkey ... 41
Table 11: Sensitivity and Specificity of Screening Mammography According to Age ... 42
Table 12: Cost Data (TL) ... 48
Table 13: QALY Score of a Healthy Woman ... 49
Table 14: Overall Incidence Rates (per 100,000) for Validation ... 52
Table 15: Breast Cancer Mortality Rates for Validation (per 100,000) ... 59
Table 16: Screening Policies ... 61
Table 17: Average Incidence Rates of Breast Cancer for 1980 Cohort (per 100,000) .... 64
Table 18: Breast Cancer Stage Diagnosis Ratio of Each Screening Policy for 1980 Cohort (percentage) ... 66
10
Table 19: Mortality Rates Due To Breast Cancer among Female Population for 1980
Cohort (per 100,000) ... 68
Table 20: Costs by Screening Policy for 1980 Cohort (TL) ... 70
Table 21: LY, QALY and Cost Data for 1980 Cohort ... 74
Table 22: LY, QALY and Cost Data for 1980 Cohort (per Person) ... 75
Table 23: QALY-Total Cost (TL) Data for 1980 Cohort for All Alternative Screening Policies ... 77
Table 24: QALY-Total Cost (TL) Data for 1980 Cohort for Non-Dominated Screening Policies ... 79
11
Chapter 1
Introduction
Cancer is a group of diseases that cause body cells grow out of control by changing their form or structure [37]. If the abnormal and uncontrolled spread of cells is not controlled, cancer can cause death. Cancer is the third most common disease worldwide, while the first two ones are cardiovascular and infectious diseases [38].
Cancer has shown an increase all over the world in recent years due to the increase in life expectancy and change in lifestyles, mostly in the western part. According to the World Health Organization’s statistical data, approximately 12 million people were diagnosed with cancer in 2008, and in 2030 this number is expected to increase to at least 26 million, which means 13.1 million more people for the year 2030 will be diagnosed with cancer [39].
12
Being the third most common disease worldwide, today, deaths due to cancer constitute 13% of all deaths, which makes about 8.2 million people. The great majority of cancer deaths are related to [40]:
lung (1.59 million deaths/year)
stomach (723,000 deaths/year)
liver (745,000 deaths/year)
colorectal (694,000 deaths/year)
breast (521,000 deaths/year)
oesophageal (400,000 deaths /year) cancers.
There are more than 200 different types of cancer and the most common types are: lung, stomach, liver, colorectal, and breast cancers, as stated above. These most frequent types differ between men and women. To give an example, breast cancer, a disease that formed in the tissues of the breast, is the leading cancer type among female population in the world. The percentage of breast cancer among other cancer types is 14.1% according to SEER data [42]. In developing countries, insufficient awareness of female population causes late diagnosis in majority of cases and this is the reason why breast cancer incidence rates are increasing in particular. In 2012, 1.67 women diagnosed with cancer and 522,000 of women died due to breast cancer [42]. The incidence rates of breast cancer are the highest in women aged 55-64 years, thus it is more likely to be seen in middle-aged or older women. Looking into the age groups of ten years, from 25 to 34, from 35 to 44, from 45 to 54, from 55 to 64, from 65 to 74, from 75 to 84 and greater than 85, the percentage of new cases are 1.8, 9.6, 22.2, 25.2, 20.7, 14.8, and 5.7, respectively [42]. The number of estimated new cases of breast cancer in U.S. is about 295,000 in the year 2014 [43].
13
Constituting a significant percentage of all deaths around the world, the percentage of breast cancer specifically in all deaths caused by cancer is 6.9% [42]. It is estimated 522,000 women died worldwide in 2012 due to breast cancer [41].
With Turkey in closer look, breast cancer is also the leading cancer type among female population, with an average incidence rate of 40.7/100,000 in 2013 which is given in Figure 1.
Figure 1: Cancer Incidence Rates in Turkey (per 100,000) [44]
In Turkey, breast cancer is the eighth most common death reason among female population, with a ratio of 2.1%, more than that of the U.S [4]. This leads us to the importance of early diagnosis and treatment in breast cancer.
0 10 20 30 40 50 60 70 80 Lung, Trackea, Bronchus
Prostate Bladder Colo-Rectal Gastric Larinx Non-Hodgkin Lymphoma Brain, Nervous System Pancreas Kidney Thyroid Breast Uterus, Cervix Ovary Uterus, Corpus Incidence Rates Can ce r Ty p e s Woman Man
14
Existing data show us that breast cancer incidence rate in the western part of Turkey is 50/100,000, whereas it is 20/100,000 in the eastern part. This significant difference between two parts of Turkey is caused mainly by early menarche, late menopause, first birth > 30 years, less breast feeding, and other related factors [1].
Cancer statistics have not been evaluated accurately for years in Turkey. The exact incidence rates are hard to be assessed in Turkey because of the lack of regular screening record system. Then in 2004, transformation program in health was put into practice and cancer records became more reliable. That is, the cancer incidence rates increase in years thanks to the recovery in cancer statistics. However, taking into account the total cancer burden in Turkey, we find out that Turkey’s total cancer burden is behind the other countries and the health registry system needs to be improved.
Unlike other cancer types, the probability of developing a breast cancer does not depend on the environmental risk factors. Prevention, early detection, diagnosis and treatment, and rehabilitation are some prominent methods of controlling breast cancer to develop. Exact causes of breast cancer are yet unknown. However, lack of activity, alcohol intake, overweight, tobacco usage, and obesity could have some impact in increasing breast cancer incidence rates. The statistical data collected by World Health Organization points out that reasons of increase in breast cancer rates are obesity, using of tobacco, and increase in elder population. There are some certain risk factors such as age, personal and family history, genetic alterations, reproductive and menstrual history, alcohol, obesity, and race [6].
Preventive activities are hard to implement since the causes of breast cancer are unknown. Thus, this is the reason that leads to the conclusion of the big importance of early detection and early treatment of the breast cancer, because it has the biggest respond ratio to the treatment. The earlier women are diagnosed for the breast cancer, the higher the rate of survival they have. In developed countries, if a woman is
15
diagnosed with breast cancer in the early stages, the 5 year survival rate is 80%. On the contrary, in developing countries, this rate is reduced to 40-60%. The success of breast cancer diagnosis by breast cancer screening methods in early stages is 63.7%. Early detection increases one’s 5-year survival rate up to 97.9% and it saves thousands of lives every year [4].
Early detection and starting treatment in early stages are the most effective way of reducing breast cancer mortality rates and relevant treatment costs. Breast cancer is detected by screening, before symptoms have developed or when a woman feels a breast abnormality. Clinical and self breast examinations, mammography, ultrasound, and magnetic resonance imaging are the methods of diagnosis. Mammography is the most successful tool for the early detection and moreover it is cheap, easy to apply and access. Use of these two or three screening methods together increases the effectiveness of screening. The efficiency of screening methods and the accuracy of the results are important since they directly affect the follow-up procedures as well as treatment costs. Breast cancer has the most significant incidence and mortality rates in the women, among all other cancer types. It is not possible to control breast cancer incidence rates by controlling relevant risk factors as it is not a risk factor dependent disease. Therefore, diagnosis of breast cancer in early stages gains meaning and the most efficient way to do this is mammography screening. Targeting the right population group ensures an increase in the number of early detection of breast cancers. Discussions about the optimal screening period are still ongoing; however the Ministry of Health of Turkey, Department of Cancer published breast cancer screening standards in 2004. According to these standards, proposed screening policy in our country is screening women aged 50-69 every two years [14].
The purpose of this study is to analyze the advantages and disadvantages of the population-based mammography screening programs, to decide the initial and final
16
screening ages of women, and a good frequency of the screening program. We try to reduce screening, false positive and treatment costs, and mortality rates while detecting more breast cancer cases. In addition, we then examine the expected life years and quality adjusted life years of the screening programs.
17
Chapter 2
Literature Review
Breast cancer is a leading disease among female population around the world and certain causes of it are unknown yet. Therefore, it is important to investigate the alternative solutions for reducing breast cancer incidence rates. The most effective way to do this is to spread breast cancer screenings.
Breast cancer staging, is mainly about determining the presence and size of the tumor, and where positive lymph nodes are located. In the simulation model, breast cancer stages are assigned according to the SEER historical stages; (1) in situ, (2) localized, (3) regional, (4) distant stages. In situ stage is defined for tumors with negative nodes and below a critical size. The survival rate probabilities are extremely high for this stage. Once tumor reaches the critical size but still there are no positive nodes, the stage is called localized stage. If the critical size is exceeded and there is metastasis to the lymph
18
nodes, then the stage is called regional stage. Tumors with more than four positive nodes are defined as distant stage. As breast cancer spreads to the lymph nodes, the survival rates become lower. There are some in situ cancers which are not lethal. In addition, this kind of cancers does not show any progression [8].
It is possible to categorize the most common methods for breast cancer screening into three parts: examination, clinical examination, mammography [45]. Breast self-examination increases breast cancer awareness in women and helps them to understand the symptoms of breast cancer. Clinical breast examination has contribution to diagnose breast cancer early in women under the age of 40 years. Being used in addition to mammography, in women over the age of 40, this instrument helps early diagnosis of breast cancer. Finally, mammography screening is the most efficient way to diagnose and also the best tool to screen. In reality, it is inappropriate to apply all alternative screening policies and find the effective one considering the patients. Moreover, it would be quite costly even if it was applicable.
Mammography has been proven to detect breast cancer at an early stage [15]. However, this tool has still some potential limitations [46]:
- False negative results - False positive results
- Over diagnosis and overtreatment - Radiation exposure
- Pain and complications
As stated, one of the important things is the performance of mammography screening. The sensitivity of mammography is the probability of a positive result among patients with disease and the specificity is the probability of a negative result among patients without breast cancer [47]. Sensitivity depends on tumor size, breast tissue density, patient age and also the image quality and skill of the radiologist. If the specificity is
19
low, it results in many positive mammography screening results. When false-positive result probabilities become higher, it results in unnecessary follow-up examinations and procedures [48].
The screening guidelines vary from country to country; this is because of the characteristics of the female populations and their lifestyles. Furthermore, several major health organizations in the same country, namely the US, recommended different mammography screening policies (see Table 1).
There are several studies in the operations research literature that consider optimization of cancer screening and diagnosis such as [20], [30], [31], [32], [33], [34], [35], [36]. We do not consider an optimization approach so our study is different than such studies. More information about these studies is available in [30].
In literature, the studies have been generally interested in breast cancer by medical terms. Only few studies consider the outputs of screening; such as, mortality, quality adjusted life years or cost considerations. Some of these studies are explained below.
Table 1: Recommended Mammography Screening Policies and Organized Population-Based Cancer Screening Programs [20]
Institution/Country Initial Age Final Age Screening Frequency (Year) American Cancer Society, American Medical
Association, American College of Radiology 40 - 1
National Cancer Institute 40 - 1-2
20
American College of Preventive Medicine 50 - 1-2 American Academy of Family Physicians 50 - 1-2 American College of Obstetricians and
Gynecologists 40 -
Age 40-49, 1-2 Age 50+, 1
Canada, Italy, Japan 50 69 2
France, Netherlands 50 74 2
Spain 45 69 2
United Kingdom 50 70 3
In U.S., a significant decline in breast cancer mortality rates was observed from 1989 to 2000 [49]. Investigators want to determine whether this decline is a result of mammography screening or adjuvant therapy. For this reason, seven groups build their own models to estimate impact of screening and adjuvant therapy on population. The target group is modeled under some scenarios; such as, no screening and no adjuvant therapy, screening only, chemotherapy only, tamoxifen only, adjuvant therapy only, and screening and adjuvant therapy [27]. The observations, data, analysis technique and theories have an effect on the approach to modeling the system. The groups have met and discuss their findings since 2000 [27].
In one of these studies by Fryback et al. [8], a discrete-event, stochastic simulation model is developed to model the breast cancer incidence and mortality in the U.S. population. The proposed Wisconsin Breast Cancer Epidemiology Simulation Model has four main processes; natural history of breast cancer, breast cancer detection, breast cancer treatment, and competing cause mortality. The main purpose is to answer the
21
questions about effectiveness of screening, treatment protocols, and to estimate benefits to women of specific ages and screening histories [8].
Yılmaz and Yazıhan [4] have analyzed the economical benefits of breast cancer screening among women between 50 and 70 ages. This study only focuses on economic benefits of screening and neither considers life years and quality-adjusted life year effects of screening nor evaluates the economical benefits of alternative screening policies. What they only come up with in their study is to answer whether the women over the age of 50 are screened biennially is beneficial in terms of costs.
A study by Ohnuki et al. [3] compares the cost-effectiveness ratio among three strategies: (1) annual clinical breast examination; (2) annual clinical breast examination combined with mammography; and (3) biennial clinical breast examination combined with mammography for Japanese women aged between 30–79 years. The study aims to search the economic efficiency of mammography screening between different age groups, and it also compares the economic efficiency of different screening methods. In this study, the mammography screening scenarios are selected according to age and screening interval. Annual and biennial policies are tested for all screening policies. The cost-effectiveness of different screening scenarios is found by running a simulation model. The simulation model is run for 15 years, costs and effects are collected.
Another study in literature, by Wong et al. [2], tries to answer the question whether, for Chinese women ages between 40 and 79, the population based mammography screening is cost efficient or not. No screening strategy and 4 screening strategies (biennial screening of women between ages 40-69, 40-79, 50-69, 50-79) are compared in terms of costs, quality-adjusted life years saved and life years saved. They developed a Markov model by which mammography, diagnosis, and treatment are simulated and with the help of that the optimal screening age is tested. The model is run for 50 years and life expectancy, quality-adjusted life expectancy, and lifetime costs are collected to compare
22
the 5 different strategies; no screening, biennial screening of women between ages 50-69, 50-79, 40-69 and 40-79 [2].
A master thesis by Astım [6] analyzes population-based breast cancer screening policies and intends to determine the most cost-effective one. In that study, a simulation model is used to evaluate the cost-effectiveness of alternative breast cancer screening policies. A simulation model is run to obtain the costs and benefits of screening program. The study underlines the importance of breast cancer burden in terms of costs, while reduction in treatment costs and reduction in mortality and morbidity are taken as the benefit of the screening program. Screening policies are determined in terms of screening interval and minimum age to screen. Despite offering a biennial screening program for women over 40 in Turkey; he does not look for the optimal screening program. Moreover, he considers neither outputs of screening policies from the women’s perspective nor age-related effects of breast cancer progress and screening performance.
There are numerous relevant clinical studies in Turkey. Most of them are limited with patients in a Turkish hospital or a sample of the population, for instance the female academicians in a university. Some of the subjects of these studies are summarized below:
Health beliefs in a certain section of female population
Knowledge of mammography and breast self-examination
Performing breast self-examination
Mammography device use in Turkey
Breast cancer diagnosis and treatment
Clinical outcome assessment in mammography
In a study by Alpteker and Avcı [21], 38% of the participants (live in Karaköy, Bolu) had not even heard about breast self-examination and a majority (71.3%) of them had not known how to perform breast self-examination. Even the nursing students do not
23
have a complete belief and knowledge about the breast self-examination performance [23-24].
A study among a group of women in rural area in western Turkey [22] showed that although 76.6% of participants reported that they had heard about breast cancer, only 56.1% of them had sufficient knowledge about it. To summarize the findings of this study, 27.9% of participants had no knowledge about breast-self examination, %89.3 had never had a mammography and 75% had never had a clinical breast examination. The knowledge and usage level of mammography are very low in Turkey. The participants in a study by Sadıkoğlu et al. [25] are women from the training hospital of the medical school in Bursa. It is found that 12.7% of women had no knowledge of mammography, 57.3% had never had a mammogram as a result of this study.
The studies show that the knowledge and awareness of breast cancer among Turkish women are not sufficient. The importance of breast cancer incidence and mortality rates in Turkey has not known by Turkish women. Moreover, a majority of the population do not realize the significance of mammography screening and breast examination. Those who undergo mammography screening or do breast examination are a very little part of the population. These results clearly demonstrate the current situation in Turkey and increase the importance of the need of studies.
24
Chapter 3
Problem Definition
In the developed and developing countries, breast cancer is the most widespread cancer type and one of the primary causes of death among female population. High mortality rates and unnecessary follow-up procedures are the undesired results of breast cancer. With awareness among women, organized population-based screening programs provide early diagnosis of cancer, reduction in mortality rates and follow-up procedures. However, unless the importance of early diagnosis is known by the target population, it is hard to get any meaningful result from the screening programs. To get a good result, we emphasize the importance of the education of women and the awareness of cancer. In America and most of the European countries, government raises the awareness of female population about breast cancer thanks to their own breast cancer screening programs. In Turkey, there is no such screening program; moreover most of the women
25
do not have enough knowledge about breast cancer. Even though there are some training programs about raising awareness of this disease, they are not sufficient at all.
In general, a healthy woman goes to a doctor for clinical examination at specific time intervals and if the woman is in target population, she takes mammography in specific intervals. Thus, early diagnosis of cancer may be possible in such a case. In our country, because of the lack of awareness, these procedures do not work in this way. Therefore, breast cancer is generally detected in later stages.
As mentioned above, breast cancer is a disease that has significant reflections all around the world such as incidence rates, mortality rates, and related costs etc. There is no such a method to prevent or treat the breast cancer completely. Nevertheless, what we mean is that early diagnosis is an effective way to treat the breast cancer. Since the exact causes of the breast cancer are unknown, screening programs gain importance to detect, diagnose, and treat breast cancer.
There are more than one breast cancer screening methods: digital mammography, magnetic resonance imaging (MRI), positron emission tomography (PET) scanning, molecular breast imaging, and diffuse optical tomography. When abnormal results occur by using these screening tools, they should be followed up with diagnostic mammograms, ultrasound, or biopsy [46]. Mammography screening, the most common way of screening, has two types: Population-based mammography screening and patient-based mammography screening. Patient-based mammography screening programs target at achieving the aim of personalized medicine, in the basis of a more individualized approach which considers patient-specific features, such as age, breast density, and personal history. In population-based screening programs, a test is offered to all individuals in a defined target population according to a policy. The policy is selected according to specific features of the target population and target population is usually defined by age.
26
The preparation and implementation of the breast cancer early diagnosis and screening programs are planned and organized studies which are seriously needed. As a result of these studies, diagnosis in early cancer stages and mortality reduction can be possible. Population-based mammography screening programs have both harms and benefits. So, it is important to investigate the effects of screening programs before providing any recommendations on the issue. This study mainly aims at selecting the screening program for Turkey. Basically two central questions are to be answered while selecting a good scenario: what is the screening age interval and what is the frequency of screening? For this purpose, a realistic discrete-event simulation model is developed according to the epidemiology of breast cancer in Turkey. Initial and final ages of mammography screening and screening frequency will be determined through this model. In addition, the model is also used to study whether a decrease in breast cancer mortality among women in defined aged intervals is related to the scope of mammography screening. Effects of screening and diagnosis on incidence and mortality rates are to be analyzed. The different breast cancer screening policies are examined and compared with each other. Also, we try to answer the question how the total cost and quality-adjusted-life-years (QALYs) are affected under different screening policies. Furthermore, the model will be analyzing how the epidemiology of breast cancer in Turkey changes if there is no practice of any screening policy.
To briefly summarize, to develop a validated simulation model to analyze different screening policy recommendations for breast cancer is our contribution in this research. However, it is not possible to suggest one policy that effective in terms of all outcomes. Nevertheless, this study is useful in order to provide an opinion about the overall problem.
27
Chapter 4
Model Development
4.1 General
The two simulation models are built in order to propose good breast cancer screening policies for Turkish women. These simulation models generate a cancer registry for the corresponding years. The inputs of the model are obtained from the literature; from the databases of SEER, World Health Organization, the Ministry of Health of Turkey, Turkish Institute of Statistics, and from the health record systems of Cancer Early Diagnoses and Treatment Centers. The purpose of this study is to evaluate the outcomes of different breast cancer screening policies and compare them with each other.
Two simulation models are built. The first model is simulated between the years 2000-2010 for the Turkish female population aged in the range of 30-79 years. The first model is run for approximately 14 million women, which is the female population in 2000, are
28
created in a single run. In each year of the interval 2000-2010, we add to the simulated cohort the women aged 30 years in that year and they stay in the system until they die due to the breast cancer or other reasons.
The second simulation model tracks a cohort of cancer-free women aged 30 years in the year of 2010 over their lifetimes. Similar to the first model each women stays in the system until she dies or reaches the age of 100 years.
4.2 Model
The general flow chart of the first simulation model is given in Figure 2. In this figure, each year is represented by a loop. At time zero, which corresponds to the beginning of year 2000, we create all the female population aged between 30-79 years. At the beginning of the successive years, only the women at the age of 30 are created. All women are created as alive and at the time of creation, the attributes such as age, life status (being dead or alive), and cancer stages are assigned. Breast cancer can be detected by either mammography screening or clinical breast examinations.
Created entities (the women) are transferred to the decision node where, with some probability, each woman dies due to the reasons other than the breast cancer. This death probability is estimated using the data obtained from Turkish Institute of Statistics for the years 2000-2010. An entity is either disposed from the system due to a death cause other than the breast cancer or transferred to the decision node where the clinical breast examination decision is made. In this node, if there is an abnormal finding as a result of clinical diagnosis, the entity is transferred to the treatment decision node.
If there is not such a finding or there is no requirement for a clinical breast examination, the entity is re-sent to the decision node which decides whether the entity will have a
29
mammography screening or not, considering the screening strategy given before. If the screening is taken and the result is positive, meaning that mammography finds something abnormal, then the entity is transferred to the treatment decision node. If the screening is not taken or the result is negative, then the entity is sent to the tumor progress node.
In the treatment node, the entity is disposed from the system due to either breast cancer or another reason. In the tumor progress node, basically a woman’s cancer status changes according to a Markov chain, which is an output of the study by Fryback et al. [8] and is adjusted for the situation in Turkey. The structure of the Markov chain is as follows: if the woman is diagnosed with a breast cancer, then the stage of the disease may stay the same, or progress to a later stage, or the woman may die. If the woman is not diagnosed with cancer, then she may stay healthy or she may have a breast cancer in her later ages. The details will be discussed in later sections.
At the end of the year loop, corresponding counters are calculated and each entity’s age attribute is increased by one and entities are sent back to the top of the loop. The calculated counters are listed below:
- Total incidence rates for each year - Incidence by stage for each year - Breast cancer mortality rates - Other causes mortality rates
- The number of mammograms for each year
- The number of true positive and false positive results for mammography - The number of clinical diagnosis
- Total life year for each year
30 - Total cost for each year
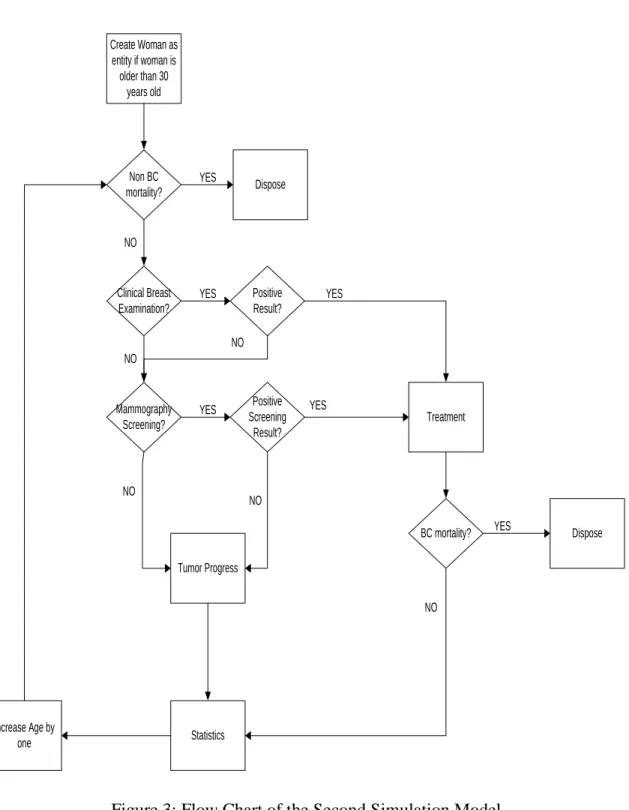
The second simulation model with the flow chart in Figure 3, basically has similar structure with the first simulation model, however, the entity creation and simulation length differ from the first simulation model. There is only one entity creation, which is at the beginning of the simulation as the number of living women with the age of 30 years and over, and the simulation was run until they reach age 100.
31 Create woman as entity if woman is older than 30 years old Non BC mortality? Dispose Clinical Breast Examination? Mammography Screening? Positive Screening Result? Treatment BC mortality? Dispose Tumor Progress Statistics Increase Age by one YES YES YES YES YES NO NO NO NO NO Positive Result? YES NO
32 Create Woman as entity if woman is older than 30 years old Non BC mortality? Dispose Clinical Breast Examination? Mammography Screening? Positive Screening Result? Treatment BC mortality? Dispose Tumor Progress Statistics Increase Age by one YES YES YES YES YES NO NO NO NO NO Positive Result? YES NO
33
4.3 Model Data
The methods we used to estimate the input data of the model are described below.
4.3.1 Population
The number of women that contributes to simulation for each year is the first and the most important input in order to run a simulation model and to discover the benefits of a population based breast cancer screening policy.
The population data for the year 2000 are obtained from the population database of the Turkish Institute of Statistics (see Table 2). The database does not report the population of each age, instead groups the ages in increments of five years and reports the data accordingly. However, since every component of the simulation model depends on the age of the entity, we cannot use these data directly. To make things easier, the population of each age group is divided by five to generate the data needed for the simulation model.
Table 2: Female Population in Turkey in 2000 Age Group Female Population
30-34 2,457,285 35-39 2,400,808 40-44 1,985,225 45-49 1,658,012 50-54 1,360,958 55-59 1,042,168 60-64 964,989 65-69 850,636 70-74 654,773 75+ 603,977
34
As pointed out before, in the first model, the first entity creation is performed in the year 2000 for the female population aged over 30 years. Then, at the beginning of the successive years, 30-year-old female population is added to the simulation cohort using the numbers given in Table 3, which are taken from the population database of the Turkish Institute of Statistics. In other words, in the year 2001, we create 502,465 entities and add them to the system.
Table 3: Number of Women at Age 30 in Turkey Year Number of Women at Age 30
2001 502,465 2002 513,472 2003 524,480 2004 535,487 2005 546,495 2006 557,502 2007 568,507 2008 574,118 2009 582,514 2010 612,751
In the second simulation model, we only create the female population aged 30 in the year of 2010, which makes 612,751 women. And there is no entity creation for the successive years.
4.3.2 Prevalence
The overall breast cancer incidence rates for the years 2002-2008 are taken from the data of the Ministry of Health of Turkey (see Table 4). The estimation of the breast cancer incidence rates for the years 2009 and 2010 are also provided from Ministry of Health of
35
Turkey. The received data includes all live women at any age. However, because breast cancer is age-related and it generally appears after the age of 30, we calculated the incidence rates for the women over age 30. For this reason, overall incidence values for the women over 30 years are generated by calculating the product of each five-years-age-group’s incidence rate (see Table 5) and its population (see Table 6), which also gives the number of women who has cancer (see Table 7).
Table 4: The Reported Breast Cancer Incidence Rates by the Ministry of Health of Turkey for Female Population
Year Overall Incidence (per 100,000) 2002 31.96 2003 33.93 2004 34.7 2005 35 2006 37.6 2007 35.9 2008 36.5
Prevalence is the actual number of cases alive and depends on both the incidence rates and the duration of the cancer.
Therefore, we cannot directly use the incidence rates as prevalence because there are many women who are unaware of their growing disease hence these breast cancer cases are not diagnosed yet. In our simulation model the incidence rate value of the 2002 is used for the prevalence value at the year 2000 instead, which is the beginning year of the simulation. In other words, in the simulation model the probability of having breast
36
cancer in the year 2000 is calculated by using the incidence rate at the year 2002 and the female population in the year 2002.
Table 5: Breast Cancer Incidence Rates Estimated by the Ministry of Health of Turkey for all Female Population for Every Five-Year-Age-Group (per 100,000)
Age Group 2002 2003 2004 2005 2006 2007 2008 0--4 0 0 0 0 0 0 0 5--9 0 0 0 0 0 0 0 10--14 0 0 0 0 0.2 0 0 15--19 0.5 0.5 0 0.2 0 0.2 0.2 20--24 1.2 1.5 0.9 2.1 0.8 2.2 2.4 25--29 5.5 6.1 7.2 7.2 6.5 6.7 6.9 30--34 16.4 20.5 19.8 19.2 18.6 16.1 16.1 35--39 38.7 37 44.1 44.4 40.7 40.8 41.2 40--44 67.9 76.2 75.3 68.5 80.9 74 75.1 45--49 90 100.5 91.6 88.6 100.1 96.2 97.3 50--54 115.1 104.1 93.3 102.8 106 101.4 99.3 55--59 114 112.7 100.6 108.4 110 111 110.5 60--64 119.7 111.3 117.9 117.9 123.2 116.6 116.1 65--69 103.5 120 99.9 94.3 119.3 112.2 113.7 70--74 119.8 138.4 87.7 85.8 109.7 104.7 102.4 75--79 125 125.1 123.1 117.6 99.4 109.2 106.7 80--84 72.2 111.2 79.7 132.4 162.7 94.7 99 85+ 62.8 40.1 78.3 75.7 71.8 71.5 73
37
Table 6: Female Population in Turkey Age Group 2002 2003 2004 2005 2006 2007 2008 2009 2010 30--34 2,567,360 2,622,398 2,677,435 2,732,473 2,787,510 2,842,548 2,870,589 2,912,568 3,063,753 35--39 2,431,243 2,446,460 2,461,677 2,476,894 2,492,112 2,507,329 2,649,543 2,740,457 2,767,247 40--44 2,088,442 2,140,051 2,191,660 2,243,269 2,294,877 2,346,486 2,342,544 2,296,915 2,249,976 45--49 1,763,563 1,816,338 1,869,113 1,921,888 1,974,664 2,027,439 2,130,748 2,228,411 2,341,378 50--54 1,482,010 1,542,536 1,603,062 1,663,588 1,724,114 1,784,640 1,818,561 1,847,369 1,835,058 55--59 1,149,903 1,203,770 1,257,638 1,311,505 1,365,373 1,419,240 1,454,659 1,483,667 1,649,342 60--64 999,717 1,017,081 1,034,444 1,051,808 1,069,172 1,086,536 1,153,037 1,236,594 1,301,377 65--69 869,717 879,257 888,797 898,337 907,878 917,418 917,704 920,652 958,566 70--74 680,220 692,943 705,666 718,389 731,113 743,836 699,248 736,844 787,768 75+ 771,074 854,623 938,172 1,021,721 1,105,269 1,188,818 1,136,990 1,031,173 1,250,373
38
Table 7: The Estimated Breast Cancer Incidence Rates for Female Population over Age 30 in Turkey Year Overall Incidence (per 100,000) 2002 74.06391 2003 77.51916 2004 72.59213 2005 73.61959 2006 79.79504 2007 75.89705 2008 75.86695 2009 76.07786 2010 76.3435
When the simulation is over, the incidence rate outputs of the model are compared with the data taken from the Ministry of Health of Turkey. This comparison will be discussed in later sections.
4.3.3 Mortality
In the model, death depends on breast cancer or other causes. At the end of each year if the woman is dead, meaning life status is zero, she leaves the system; else she lives and goes back to the beginning of the year loop. The number of target population which is given as input, updates itself at the beginning of each year by subtracting dead population from the all given population. This is why; the probability of death needs to be calculated.
Turkish Institute of Statistics publishes the statistics of both the number of dead population and reasons of deaths every year (see Table 8). The probability of death is
39
basically calculated by dividing the number of the dead female population by the corresponding year’s female population. Decision whether the entity leaves the system or continues is taken according to the derived probability.
Table 8: The Number of All Deaths for Female Population in Turkey by Age Group and by Year
Age Group 2000 2001 2002 2003 2004 2005 2006 2007 2008 2009 2010 30-34 831 773 792 908 870 799 856 821 815 1514 1432 35-39 1,103 1,170 1,054 1,139 1,037 1,066 1,084 1,074 1,140 2,046 1,900 40-44 1,520 1,441 1,481 1,599 1,649 1,622 1,745 1,613 1,633 2,707 2,496 45-49 2,042 2,121 2,088 2,301 2,113 2,306 2,225 2,296 2,457 3,991 3,779 50-54 2,826 2,755 2,926 3,338 3,006 3,182 3,363 3,296 3299 5,098 4,865 55-59 3,574 3,334 3,316 3,851 3,620 4,198 4,229 4,208 4,242 6,676 6,465 60-64 5,494 5,452 5,641 5,779 5,287 5,384 5,646 5,275 5,740 9,056 9,323 65-69 8,211 7,920 7,593 7,679 7,300 8,326 8,507 8,381 7,930 12,764 12,408 70-74 11,113 10,963 11,053 11,723 11,492 11,348 11,620 11,373 11,000 17,879 18,583 75+ 28,053 29,071 31,304 33,511 34,565 38,036 42,913 45,203 47,541 86,602 89,423
In the simulation model, the number of deaths due to breast cancer is also going to be used, so to prevent double counting, the probability of death from breast cancer is subtracted from the derived death probability. These non-related-to breast cancer death probabilities are used to find how many women will die at the beginning of each year from a reason other than breast cancer, which are called deaths due to the causes other than the breast cancer. The number of deaths in women due to breast cancer is gathered from Death Statistics which Turkish Institute of Statistics published in 2008 (see Table 9).
40
Table 9: The Number of Breast Cancer Deaths for the Female Population in Turkey
2000 2001 2002 2003 2004 2005 2006 2007 2008 2009 2010 The
number 1,136 1,225 1,176 1,175 1,268 1,615 1,752 1,761 1,809 2,043 2,215
Entities stay in the system until they are completely disposed by the probability of death due to either breast cancer or another reason.
4.3.4 Screening
Entities are dispatched into two paths when they come to mammography screening component. They continue with either screening or not screening path. The screening decision (see Figure 4) is made according to the chosen screening policy and attributes of the corresponding entity.
Result Negative Result Positive Cancer No Cancer Cured Died Cancer with Symptom Cured Died Result Negative Result Positive Cancer with Symptom Cancer No Cancer
Figure 4: Structure of the Screening Decision (Reproduced from Ohnuki et al. [3])
41
The screening probabilities that whether the woman is going to be screened or not are found by using the data from the report of the Ministry of Health of Turkey, called Health Statistics Yearbook (2010). In this report, the number of mammography taken is given from year 2007 to 2010 which is given in Table 10. By using this data, the rate of taking mammography for the women aged 30 and over is calculated for 2007 to 2010. In this step we use linear regression method to estimate the rates of mammography taken for 2000 and 2006. Then, the number of mammograms taken is found by multiplying the corresponding year’s female population and these rates (see Table 10).
Table 10: The Number of Mammograms Taken in Turkey Year The Number of Mammograms Taken
2000 121,417 2001 237,399 2002 359,819 2003 488,679 2004 623,977 2005 765,715 2006 913,892 2007 940,055 2008 1,367,201 2009 1,495,665 2010 1,456,347
Tunçbilek et al. [10] mention the number of mammograms taken for screening and medical diagnosis reasons. In her article, the result shows us that 91% of the mammograms are taken for screening purpose, and other 9% is taken for medical
42
diagnosis reasons. In our study, the data taken from Cancer Early Diagnoses and Treatment Centers’ report are updated with this information. That is, the number of mammograms taken is multiplied by 0.91 to find the number mammograms taken for only screening purpose.
Cronin et al. [9] mention the ratios of annual mammograms taken for ages 18-39, 40-49, 50-59, 60-69, and 70-79. With this information, the number of annual mammograms taken for ages 30-39, 40-49, 50-59, 60-69, 70+ is generated. The probability of being screened is calculated by dividing the number of mammograms taken to the female population for each age group. By using these probabilities, the screening decisions are made for every woman. If no screening decision is made, then entity is transferred to other components. Else, the result of the mammography screening is determined whether it is positive or not.
The mammography result of being false positive or true negative is determined by using specificity values which is given in article of Kerlikowske et al. [7]. An entity’s true positive mammography result means that a woman is actually diagnosed by breast cancer and the stage of the cancer should be decided [50]. Despite of the cancer status, if the result is positive, then the entity is transferred to the treatment component. If the result is negative, then the entity is transferred back to the beginning of the loop for simulation of the next year by increasing age attribute by one. Mammography specificity and sensitivity values which are given in Table 11 are taken from Kerlikowske et al. [7].
Table 11: Sensitivity and Specificity of Screening Mammography According to Age
Age 30-39 40-49 50-59 60-69
Sensitivity in women with no
family history, % 69.5 77.5 80.2 87.7 Specificity in women with no
43
4.3.5 Markov Chain
If cancer is diagnosed by screening or clinical examination, patients are transferred to the cancer progress module. There is a Markov chain process in here (see Figure 5). Markov chain manages the actions which are the progress of cancer and deaths due to breast cancer.
As mentioned before, size of the tumor and presence of positive nodes determine the stage of cancer. In this study the critical size of the tumor and the fraction of the non-fatal in situ cancers are used from the study by Fryback et al. [8]. Each year, a woman will make a transition to 1 to 4 breast cancer stages, or they will die or remain cancer-free. Women who are diagnosed with breast cancer at any stage have a higher risk of death compared to healthy women. This Markov chain is taken from Fryback et al. [8] as an initial data and updated by some estimation for the situation in Turkey and the death probabilities from article Chhatwal et al. [32]. In every loop, transition probabilities vary for each entity due to various factors like age, chosen screening strategy and whether the patient has been diagnosed before or not.
44
Healthy
(cancer-free) In situ Local Regional Distant
Non Fatal Stage I
Death due to breast cancer Death due to other
causes
Figure 5: Markov Chain Model (Modified from Wong et al. [2])
4.3.6 Clinical Breast Examination
Detectability of the cancer is mainly about the tumor size. The probability of detecting distant cancer is much more than the probability of detecting in situ. The decision whether one’s being clinically diagnosed or not, is defined by using the values from Fryback et al. [8]. Although the given data are appropriate for the case of women with the knowledge of breast cancer, it is not valid for the situation in Turkey. Studies that raising the awareness of women is limited in our country. Because of that, this data need to be adjusted for Turkey. For this adjusting process, firstly the studies in our country are examined. In a study by Eryılmaz et al. [11], the self-checked breast examination rate is 18% for the women applying to Konya Early Diagnosis Scanning and Education Centers. Another study [16] is about evaluating the breast self examination rate of
45
female academicians in a Turkish University. And as a result, it is seen that only 27.7% of participants performed breast cancer examination regularly. In the light of these studies, it is not appropriate to take the same clinically diagnosed probability rate in U.S. for Turkey. For this purpose, the clinically diagnosis probabilities of the in situ, local and regional cancer are reduced by the results of the studies mentioned above. The probability is left the same for distant cancer, because it is impossible not to notice and detect the distant stage of breast cancer. By doing this, the input data are derived from literature for Turkey model. If a woman is clinically diagnosed, then she is transferred to the treatment module.
Figure 6: Clinical Diagnose Model (Reproduced from Rojnik et al. [54])
46
4.3.7 Treatment
If a patient’s mammography result is positive, meaning being an abnormal module, or patient is diagnosed clinically, that is, after the cancer is diagnosed, entity is transferred to the treatment component. In this component, the entity leaves the system due to breast cancer death or a reason other than the breast cancer death. In the treatment component, the probability of breast cancer death is calculated differently from the probabilities in Markov chain.
The method and success of the treatment depend on breast cancer estrogen receptor status. Estrogen Receptor-Positive (ER+) cancer cells depend on estrogen for their growth and can be treated with hormone therapies like tamoxifen and aromatase inhibitors to reduce either the effect of estrogen or the actual level of estrogen. ER+ tumors have better survival rates than tumors with Estrogen Receptor-Negative (ER-) [51].
To calculate breast cancer death probabilities under treatment, firstly the ratios of ER+ and ER- are needed [17]. In Chhatwal et al. [32], the reduction of breast cancer death probabilities for each stage is given, whether the tumor is ER+ and ER-, for 50-, 50-69, 70+ age groups. The percentage of reduction is used to find the probabilities of breast cancer deaths for local and regional cancer stages under treatment for corresponding age groups. The probability of breast cancer death under treatment for in situ and distant cancer stages are used the same as the probability of undiagnosed breast cancer death. In the first place, the breast cancer death probability for in situ cancer stage is 0. The 6 month probabilities are needed for the model and these probabilities are obtained for one year, so there is a need to transform these probabilities. To do this transformation, firstly we have to find the percentage of breast cancer death reduction for each stage when the treatment is applied. By using the data of breast cancer death probabilities with no treatment and the reduction rates from Mariotto et al. [28] and the ratios of ER+ and ER-
47
data from Çalıkapan [17], the breast cancer death probabilities under treatment for each stage are calculated. These probabilities are for 1 year cycle. Therefore, the cycle for 6 months is found by applying the formulas below:
, t=1 , t=1/2
We found α values for each stage of cancer by using one year probabilities in the first formula and by using the α values in second one we calculated the six-months probabilities of breast cancer death under treatment.
4.3.8 Costs
Preventive health services improved the quality and quantity of individuals and beside of this cause a significant reduction in the cost of treatment as a result of early diagnosis. The most important parameter defining the cost of treatment for a patient is the stage of cancer at the diagnosis, as it directly affects the medical intervention methods [6]. The cancer diagnosed in later stages has more aggressive and costly treatment processes. Most of the studies also clarify that breast cancer treatment costs depend considerably on the progress of the disease [4,52].
The study by Astım [6] is used for calculating the cost values for this study. According to this thesis, the cost of mammography screening per woman is 15.2 TL. The data used in that study are collected from the cost structures analyzed by Cancer Early Diagnosis and Treatment Centers. If mammography screening is performed and the result is false positive, then further treatment costs for false positive results are 58 TL in 2007 prices. Once woman is diagnosed by breast cancer either by screening or clinically, corresponding treatment cost is added to the total costs. The treatment costs for each stage of cancer per patient are also used from the same study. In Astım [6], these data are obtained from Yılmaz and Yazıhan [4].
48
Cost data of 2007 is used in Astım [6]. Then these costs are escalated from year 2007 to 2013 by using published inflation data of Turkish Institute of Statistics our study. Costs adjusted to the 2013 level are shown in Table 12.
Table 12: Cost Data (TL)
Average Screening Cost Per Patient 23.9
Average Treatment Cost Per Patient
Stage I 4,053.2
Stage II 5,693.3
Stage III 13,722.6
Stage IV 6,285.5
False Positive Result Cost Per Patient 91.1
4.3.9 Life Years Gained
This effect is an outcome measure in economic evaluations of health interventions. Life years gained (LYs gained) is calculated by looking only being alive or dead without distinguishing between young or adult population. LYs gained measure is calculated for every year in the simulation model. This value is calculated using the formula given below:
Dividing total life years gained to the number of women at the beginning of the corresponding year results in life year value per woman.
49
4.3.10 Quality-Adjusted Life Years (QALY)
Quality adjusted life year methodology is one of the measurements of the life quality lost due to the disease. QALY is calculated by taking into consideration of both the quantity and quality of life affected by healthcare interventions [6]. It is basically the combination of quantity and quality of life lived. It provides an assessment of health related quality of life resulting by health interventions [6]. Every health states have utility weights which are located between 1 and 0. Normally, the best health state, perfect health, has a weight of 1. However, the score of perfect health state will generally count less than 1 since it can change easily by some factors, such as; age or current health situation of the woman. In this study, the perfect health state is valued in Table 13 basically due to woman’s age. To calculate QALYs, we multiply life years spent in a given health state by the quality of life score for that health state. The worst health state, meaning death, has a weight of 0.
Table 13: QALY Score of a Healthy Woman
Age Score 30-40 0.893 40-50 0.863 50-60 0.837 60-70 0.811 70-80 0.771 80+ 0.724
The QALY combines mortality and morbidity into a single measure and it allows us to compare alternative screening policies for the same condition. In most of the studies, QALYs lost due to breast cancer are calculated for each phase. Three different factors
50
affect the utility score calculation; taking a mammography, getting a positive mammography result and having breast cancer.
In this research, these QALY disutility values due to having cancer are calculated from Stout [26]. The lost values of QALYs are 0.1, 0.1, 0.25 for two years, 0.4 until death for each cancer stage respectively. That is, QALY lost is low when the cancer is diagnosed in early stages and much higher in other stages. If a woman dies, the QALY value is equal to 0. QALY lost depends in a great extent on the treatment procedure carried on. Since the treatment methodology selected is related to the stage of the breast cancer in diagnosis, QALY is also dependent on the diagnosis stage [6]. When a mammography is taken, a disutility value is subtracted from the QALY score of the women irrespective of the mammography result. In addition, also a disutility score due to a positive mammography result is subtracted from the current QALY score. Having breast cancer has also a disutility score, which is again subtracted from the QALYs score of women as well. The formula we used to calculate QALYs is provided below:
In the simulation model, QALY lost per person is calculated by dividing the total QALY values by the number of women alive for corresponding year.
51
Chapter 5
Results
The first simulation model is run for validation purpose. The second model is constructed to analyze the alternative screening policies for Turkish female population.
5.1 Validation
As explained above, we use several data sources; previous studies in the literature, the records of some institutions in Turkey. Some of the model input parameters derived from literature for our model and some of them were adjusted to make simulation output match as closely as possible to the data of Turkey.
Firstly, we calibrate the model in order to fit the simulation output to the observed incidence rate data of Ministry of Health of Turkey and breast cancer mortality rate data of Turkish Institute of Statistics. Cancer registry in Turkey has started in recent years and not yet fully implemented as required. Therefore, we collected the input data from
52
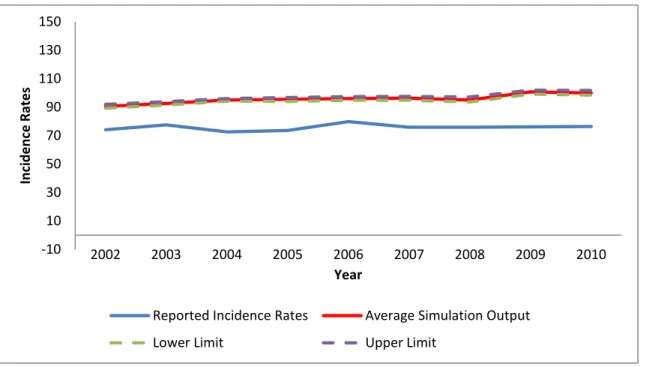
different sources. Because of this, it is normal not to come from the simulation model with incidence rates which are quite close to the incidence rate data of Ministry of Health. As described previously, the Markov chain and breast cancer mortality rate were adjusted in order to conform as much as possible to the current data in Turkey. The reported incidence rate data and simulation output can be seen in Table 14 and Figure 7. The simulation outputs are based on the average of 10 replications. The incidence rates obtained from the simulation model are generally higher than the reported incidence rates. This is an expected result; since the data collected in Turkey are not very reliable because of undiscovered or unreported breast cancer cases.
Table 14: Overall Incidence Rates (per 100,000) for Validation
Year Reported Incidence Rates Average Simulation Output 95% Confidence Interval 2002 74.064 90.582 [89.352 , 92.582] 2003 77.519 92.593 [91.489 , 93.842] 2004 72.592 94.936 [94.235 , 96.057] 2005 73.620 95.526 [93.981 , 96.801] 2006 79.795 96.029 [94.849 , 97.414] 2007 75.897 96.280 [94.855 , 97.518] 2008 75.867 94.989 [93.580 , 97.110] 2009 76.078 100.665 [99.110 , 101.926] 2010 76.344 99.915 [98.425 , 101.668]
![Figure 1: Cancer Incidence Rates in Turkey (per 100,000) [44]](https://thumb-eu.123doks.com/thumbv2/9libnet/6018555.127016/13.918.177.813.388.823/figure-cancer-incidence-rates-turkey.webp)


![Figure 5: Markov Chain Model (Modified from Wong et al. [2])](https://thumb-eu.123doks.com/thumbv2/9libnet/6018555.127016/44.918.197.786.218.542/figure-markov-chain-model-modified-from-wong-et.webp)
![Figure 6: Clinical Diagnose Model (Reproduced from Rojnik et al. [54])](https://thumb-eu.123doks.com/thumbv2/9libnet/6018555.127016/45.918.216.789.506.893/figure-clinical-diagnose-model-reproduced-rojnik-et-al.webp)