NOVEL HYBRID LIGHT EMITTING
DIODES WITH MULTIPLE ASSEMBLIES OF
NANOCRYSTALS TO GENERATE AND
TUNE WHITE LIGHT
A THESIS
SUBMITTED TO THE DEPARTMENT OF PHYSICS AND THE INSTITUTE OF ENGINEERING AND SCIENCES
OF BILKENT UNIVERSITY
IN PARTIAL FULLFILMENT OF THE REQUIREMENTS FOR THE DEGREE OF
MASTER OF SCIENCE
By
Sedat Nizamoğlu
June 2007
ii
I certify that I have read this thesis and that in my opinion it is fully adequate, in scope and in quality, as a thesis for the degree of Master of Science.
Assist. Prof. Dr. Hilmi Volkan Demir (Supervisor)
I certify that I have read this thesis and that in my opinion it is fully adequate, in scope and in quality, as a thesis for the degree of Master of Science.
Assist. Prof. Dr. Mehmet Özgür Oktel
I certify that I have read this thesis and that in my opinion it is fully adequate, in scope and in quality, as a thesis for the degree of Master of Science.
Assist. Prof. Dr. Dönüş Tuncel
Approved for the Institute of Engineering and Sciences:
Prof. Dr. Mehmet B. Baray
iii
ABSTRACT
NOVEL HYBRID LIGHT EMITTING DIODES
WITH MULTIPLE ASSEMBLIES OF NANOCRYSTALS
TO GENERATE AND TUNE WHITE LIGHT
Sedat NizamoğluM.S. in Physics
Supervisor: Assist. Prof. Dr. Hilmi Volkan Demir
June 2007
Today approximately one third of the world population (about two billion people) in under-developed countries has no access to electricity and relies on unhealthy, costly and low-quality fuel-based lighting for home illumination. In the rest of the world, lighting consumes a large portion (20%) of the total electricity production, which significantly contributes to global warming problem. Also given limited resources, such large energy consumption needs to be reduced for sustainable economic growth. Solid state lighting provides remedy to these problems for the entire globe. Therefore, the advancement of white light emitting diodes (WLEDs) becomes a key point for development of human civilization. To this end, the strong demand for the development of high quality WLEDs around the globe motivates our research work on the investigation of white light generation with high color rendering index.
In this thesis, we develop and demonstrate nanocrystal hybridized light emitting diodes with high color rendering index. By the hybridization of multiple layer-by-layer assemblies of CdSe/ZnS core-shell nanocrystals on blue and near ultraviolet (n-UV) InGaN/GaN light emitting diodes, we show white
iv
light generation with highly tunable optical properties such as tristimulus color coordinates, correlated color temperature, and color rendering index. Additionally, by using dual hybridization of nanocrystals in combination with conjugated polymers, we obtain white light sources with high color rendering indices exceeding the requirements of the future solid state lighting applications. In this thesis, we present design, growth, fabrication, experimental characterization and theoretical analysis of these hybrid white LEDs.
Keywords: white light, light emitting diode, color rendering index, tunable,
v
ÖZET
BEYAZ IŞIĞIN AYARLANMASI VE ÜRETİLMESİ İÇİN
YENİ MELEZ NANOKRİSTAL TABANLI
IŞIK YAYAN DİYOTLAR
Sedat NizamoğluFizik Bölümü Yüksek Lisans
Tez Yöneticisi: Yrd. Doç. Dr. Hilmi Volkan Demir Haziran 2007
Günümüzde yaklaşık dünya nüfusunun üçte biri (iki milyar insan) az gelişmiş ülkelerde elektriğe erişememekte ve sağlıksız, pahalı ve düşük kaliteli sıvı yakıt tabanlı aydınlatma kaynaklarını evlerde kullanmaktadır. Dünyanın geri kalanında ise aydınlatma %20 gibi büyük bir oranda üretilen elektriği tüketmekte ve bu da küresel ısınma problemini daha ciddi hale getirmektedir. Kaynakların sınırlı olmasından dolayı, ekonomik büyümenin sürdürülebilmesi için, mevcut olan yüksek enerji tüketiminin azaltılması gerekmektedir. Katı hal tabanlı aydınlatmalar bu problemlere karşı küresel bir çözüm niteliği taşımaktadır. Bu yüzden, beyaz LED’lerin (ışık yayan diyotların) geliştirilmesi insanlık açısından büyük önem taşımaktadır. Yüksek kaliteli beyaz LED’lerin geliştirilmesi konusundaki küresel beklenti araştırma çalışmalarımızdaki motivasyon kaynağımızı oluşturmaktadır.
vi
Bu tez çalışmasında, nanokristal tabanlı yüksek renk dönüşüm indeksine sahip LED’leri çalıştık. CdSe/ZnS çekirdek-kabuk nanokristallerin mavi ve yakın morötesi dalgaboylarındaki LED’ler ile çok katmanlı olarak melezleştirilmesi sonucunda, renk kordinatı, renk sıcaklığı ve renk dönüşüm indeksi gibi optik parametrelerin yüksek ayarlanabilirliliğini gösterdik. Ek olarak, gelecekte beyaz LED’lerin ulaşması öngörülen yüksek renk dönüşüm indeksini, nanokrsital ve konjuge polimerlerle beraber kullanarak elde ettik. Bu tezde, melez beyaz LED’lerimizin tasarımı, büyütmesi, fabrikasyonu, deneysel karakterizasyonu ve kuramsal analizlerini gerçekleştirdik.
Anahtar kelimeler: beyaz ışık, LED, renk dönüşüm indeksi, ayarlanabilir,
vii
Acknowledgements
It is for me a great honor and pleasure being Prof. Hilmi Volkan Demir’s graduate student. His kind, positive, friendly and warm personality and management embraced us, and his invaluable guidance, motivation, encouragement, confidence, understanding, and endless support made him more than a supervisor for me. I learnt a lot from him about academic and social life.
Almost in each experimental setup, I can feel Prof. Ekmel Özbay’s great contribution to national science and makes him another great example for me. Each day, I feel the progress in our research facilities with the great contribution both by Prof. Özbay and Prof. Demir. Additionally Prof. Özbay’s research group helped me a lot about the experimental setups and measurements.
I would like to thank Prof. Mehmet Özgür Oktel for his great contribution to my understanding in quantum mechanics and in the quantum mechanical calculation in this thesis. His positive and warm personality made the quantum mechanics courses and calculations very enjoyable.
I want to thank to all my friends in our Demir Sensor and Devices Research Group: Evren Mutlugün, Emre Sarı, Tuncay Özel, İbrahim Murat Soğancı, Rohat Melik, İlkem Özge Hüyal, Can Uran, Sümeyra Tek, Güliz Zengin, Özgün Akyüz, Emre Ünal, Aslı Koç, additionally, Atilla Özgür Çakmak from Özbay group. My home mate Evren Mutlugün is really a great person, we had very funny days in research, courses and friendship and he remembered me different aspects of life. Yılmaz Dikme significantly contributed us in MOCVD growths.
viii
Also, Yeşim Balıkçıoğlu helped us a lot in organization of our international conferences. Ahmet Levent Subaşı’s great advices and discussions about courses made my life easier. During my MS courses in Bilkent Physics, I meet with many famous physicists in their areas from who I learnt a lot. Additionally, I want to thank to professors and researchers in Nanotechnology Research Center and Advanced Research Laboratory as well. Aşkın Kocabaş and Münir Dede also significantly helped me in clean room work. I want to thank all staff in Bilkent who provide a peaceful place for us for research.
I want to thank to our research colleges Dönüş Tuncel in Chemistery Department; Sameer Sapra, Nikolai Gaponik, Alexandre Eychmüller in Technical University of Dresden and Elisabeth Holder and Nan Tian in University of Wuppertal. Without the help and support of great people mentioned in this text, this research work would not have been able to go this far.
Finally, I want to thank to my lovely family: my father Alican, my mother Aynur and my sister İrem. Also my friends who gave me the life happiness…
ix
Table of Contents
ACKNOWLEDGEMENTS ...VII LIST OF FIGURES... XI LIST OF TABLES... XVI
1. INTRODUCTION ...1
2. GENERAL CONCEPTS AND PARAMETERS ABOUT LIGHT SOURCES ...6
2.1.TECHNICAL CONCEPTS...6
2.2COLOR-MATCHING FUNCTION AND CHROMATICITY DIAGRAM...7
2.3COLOR TEMPERATURE...10
2.4COLOR MIXING...12
2.5COLOR RENDERING...14
3. WHITE LIGHT EMITTING DIODES ...16
3.1WORKING PRINCIPLE OF LEDS...16
3.2.WHITE LEDS...17
3.2.1 Multichip white LEDs...17
3.2.2. Monolithic white LEDs...18
3.2.3 WLEDs based on wavelength converters ...19
3.2.3.1 Dye based WLEDs ... 19
3.2.3.2 Polymers based WLEDs ... 19
3.2.3.3 Phosphors based WLEDs... 20
4. NANOCRYSTALS ...24
4.1SYNTHESIS OF NANOCRYSTALS...25
4.2SYNTHESIZED NANOCRYSTALS AND THEIR PHOTOLUMINESCENCE PEAKS...27
4.3THEORETICAL INVESTIGATION OF ENERGY LEVELS...33
4.4CALCULATION OF ENERGY EIGENVALUES AND ENERGY EIGENFUNCTIONS OF CDSE/ZNS CORE-SHELL NANOCRYSTALS...36
5. NANOCRYSTALS BASED HYBRID LEDS TO GENERATE AND TUNE WHITE LIGHT...43
5.1WHITE LIGHT GENERATION USING CDSE/ZNS CORE–SHELL NANOCRYSTALS HYBRIDIZED WITH BLUE INGAN/GAN LIGHT EMITTING DIODES...43
5.1.1 The operating principle ...45
5.1.2. Device parameters ...45
5.1.3. Nanocrystals ...46
5.1.4. Design, growth, fabrication and characterization of blue InGaN/GaN light emitting diodes...47
5.1.5. Hybridizing single combination of CdSe/ZnS core-shell NCs with blue InGaN/GaN LEDs...50
5.1.6. Hybridizing dual combination of CdSe/ZnS core-shell NCs with blue InGaN/GaN LEDs ...51
5.1.7. Hybridizing trio combination of CdSe/ZnS core-shell NCs with blue InGaN/GaN LEDs ...52
5.1.8. Hybridizing quadruple combination of CdSe/ZnS core-shell NCs of with blue InGaN/GaN LEDs...54
5.1.9 Summary of characterisitics of hybrid white light emitting diodes ...55
5.2HYBRID WHITE LIGHT SOURCES BASED ON LAYER-BY-LAYER ASSEMBLY OF NANOCRYSTALS ON N-UV EMITTING DIODES...56
x
5.2.1. Why n-UV LED platfrom rather than blue? ...57
5.2.2 Hybridization of nanocrystal film on LED platform ...58
5.2.3 Design, growth, fabrication and characterization of n-UV InGaN/GaN LED...59
5.2.5 Dichromic combination of nanocrystals on n-UV InGaN/GaN LED ...62
5.2.6 Trichromic combination of nanocrystals on n-UV InGaN/GaN LED...63
5.3NANOCRYSTAL BASED WHITE LIGHT GENERATION WITH TUNABLE COLOR PARAMETERS BY USING BLUE AND N-UVINGAN/GAN LIGHT EMITTING DIODES...65
5.4. WHITE LIGHT GENERATION TUNED BY DUAL HYBRIDIZATION OF NANOCRYSTALS AND CONJUGATED POLYMERS...72
5.4.1PROPERTIES OF CONJUGATED POLYMERS AND NANOCRYSTALS...74
5.4.2WHITE LIGHT GENERATION BY POLYFLUOERENE WITH SINGLE COMBINATION OF NANOCRYSTAL...76
5.4.3WHITE LIGHT GENERATION BY POLYFLUOERENE WITH DUAL COMBINATION OF NANOCRYSTAL...78
5.4.4WHITE LIGHT GENERATION BY POLYFLUOERENE WITH TRIO COMBINATION OF NANOCRYSTAL...79
5.4.5WHITE LIGHT GENERATION BY MIXING POLYFLUOERENE AND TRIO COMBINATION OF NANOCRYSTALS...82
CONCLUSION ...85
xi
List of Figures
Figure 2.2.1. Spectral distribution of Color matching functions (After Ref. x). .. 8 Figure 2.2.2. CIE 1931 (x,y )chromaticity diagram (After Ref. x). ... 33 Figure 2.4.1. Principle of color mixing illustrated with two light sources with chromaticity coordinates (x1,y1) and (x2,y2). Also the triangular area of the chromatic diagram (color gamut) accessible by additive mixing of a red, green and blue LED is shown (After Ref. x)... 13 Figure 3.2.2.1. An epitaxial design example of monolithic white LEDs. ... 18 Figure 3.2.3.3.1. Wavelength-converting phosphorescence and blue
luminescence. ... 20 Figure 4.1.1. Photograph of nanocrystal synthesis flask with the necessary equipments with their explanation. ... 25 Figure 4.1.2. Photograph of glove box used for taking Selenium solution. ... 26 Figure 4.1.3. Photo of cyan, green and red CdSe core NCs and surface state
emtting CdS NCs (from right to left) ... 27 Figure 4.2.1. PL and absorption spectra of violet (λPL=419 nm) CdS nanoparticle
in solution. ... 28 Figure 4.2.2. PL and absorption spectra of CdS (λPL=445 nm) nanoparticle in
solution. ... 29 Figure 4.2.3. PL and absorption spectra of blue (λPL=456 nm) CdSe nanoparticle
in solution. ... 29 Figure 4.2.4. PL and absorption spectra of CdSe (λPL=485 nm) nanoparticle in
solution. ... 30 Figure 4.2.5. PL and absorption spectra of cyan CdSe (λPL=502 nm) nanoparticle
in solution. ... 30 Figure 4.2.6. PL and absorption spectra of green (λPL=521 nm) CdSe
nanoparticle in solution. ... 31 Figure 4.2.7. PL and absorption spectra of CdSe (λPL=538 nm) nanoparticle in
xii
Figure 4.2.8. PL and absorption spectra of red (λPL=620 nm)CdSe nanoparticle
in solution. ... 32
Figure 4.2.9. PL and absorption spectra of white surface state emitting CdS nanoparticle in solution. ... 32
Figure 4.2.10. PL and absorption spectra of onion like CdSe/ZnS/CdSe (λPL=520, 560 and 620 nm) nanoparticle in solution. ... 33
Figure 4.4.1. Energy diagram of CdSe/ZnS core-shell nanocrystals. ... 36
Figure 4.4.2. Determinant of 2x2 matrix vs. energy for electrons. ... 38
Figure 4.4.3. Determinant of 2x2 matrix vs. energy for holes. ... 39
Figure 4.4.4. Radial probability distribution of electrons. ... 40
Figure 4.4.5. Radial probability distribution of holes. ... 41
Figure 5.1.1. Photographs of our white hybrid NC-WLEDs while emitting white light: (a) yellow NCs (λPL=580 nm) hybridized with blue LED (λEL=440 nm), (b) cyan and red NCs (λPL=500 nm and 620 nm) with blue LED (λEL=440 nm), (c) green, yellow, and red NCs (λPL=540 nm, 580 nm and 620 nm) with blue LED (λEL=452 nm), and (d) green, cyan, yellow, and red NCs (λPL=500 nm, 540 nm, 580 nm, and 620 nm) with blue LED (λEL=452 nm)... 44
Figure 5.1.3.1. Photoluminescence spectra of our CdSe-ZnS core-shell nanocrystals in UV-curable resin. ... 47
Figure 5.1.4.1. Epitaxial structure of our blue LEDs (not drawn to scale). ... 48
Figure 5.1.4.2. Micrographs of our fabricated blue LEDs: (a) with λEL=440 nm and (b) with λEL=452 nm... 49
Figure 5.1.4.3. IV characteristics and electroluminescence spectra (at various current injection levels) of the LEDs with emission at 440 nm and 452 nm: IVs in (a) and (b), and ELs in (c) and (d), respectively... 50
Figure 5.1.5.1. Electroluminescence spectra of yellow NC (λPL=580 nm) hybridized on blue LED (λEL=440 nm) at different levels of current injection at room temperature, along with the corresponding (x, y) coordinates and the pictures of the blue LED, yellow NC film and hybrid NC-WLED while generating white light... 51
xiii
Figure 5.1.6.1. Electroluminescence spectra of a dual combination of cyan (λPL=500 nm) and red (λPL=500 nm) NCs hybridized with blue LED
(λEL=440 nm) at various injection current levels at room temperature, along
with (x, y) coordinates and the pictures of the LED, NC films and hybrid NC-WLED while generating white light... 52 Figure 5.1.7.1. Electroluminescence spectra of a trio combination of green
(λPL=540 nm), yellow (λPL=580 nm) and red (λPL=620nm) NCs with blue
LED (λEL=452 nm) at various currents at room temperature, with (x, y)
coordinates and the pictures of the LED, NC films and hybrid NC-WLED while generating white light. ... 53 Figure 5.1.8.1. Electroluminescence spectra of quadruple combination of green
(λPL=540 nm), cyan (λPL=500 nm), yellow (λPL=580 nm) and red (λPL=
620nm) NCs with blue LED (λEL= 452 nm) at various currents at room
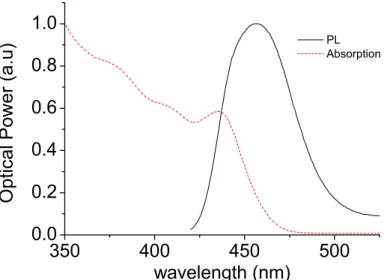
temperature, along with (x, y) coordinates and the pictures of the LED, NC films and hybrid NC-WLED while generating white light. ... 55 Figure 5.1.9.1. CIE 1931 (x, y) coordinates of our white hybrid NC-WLEDs. . 56 Figure 5.2.2.1. Photoluminescence (PL) and absorption spectra of our CdSe/ZnS core-shell nanocrystals in thin films at room temperature. ... 59 Figure 5.2.3.1. Epitaxial structure of our n-UV LED... 60 Figure 5.2.3.2. (a) IV and (b) electroluminescence (EL) spectra (λEL=383 nm)
of our n-UV LEDs under different levels of current injection at room temperature. ... 62 Figure 5.2.5.1. Electroluminescence spectra of dichromatic combinations of
cyan (λPL=504 nm) and red (λPL=615 nm) nanocrystals hybridized on an
n-UV LED for various current levels at room temperature. ... 63 Figure 5.2.6.1. Electroluminescence spectra of trichromatic combinations of
cyan (λPL=504 nm), yellow (λPL=580 nm), and red (λPL=615 nm) emitting
nanocrystals hybridized on an n-UV LED for various current levels at room temperature. ... 64 Figure 5.2.6.2. Color gamut covered using cyan, yellow and red CdSe/ZnS
nanocrystals in the C.I.E. color chromaticity diagram. ... 65 Figure 5.3.1. Tristimulus coordinates of our hybrid NC-WLEDs on the C.I.E.
(1931) chromaticity diagram ... 66 Figure 5.3.2. Electroluminescence spectrum of 150 µl yellow NCs (λPL=580 nm)
xiv
µmol/mL hybridized on blue LED (λEL=452 nm) measured at an injection
current level of 5 mA at room temperature. ... 70 Figure 5.3.3. Electroluminescence spectrum of 75 µl green NC and 9.3 µl
PMMA corresponding to a film concentration of 5.59 µmol/mL and 150 µl yellow NCs (λPL=540 nm and 580 nm) and 18.75 µl PMMA corresponding
to a film concentration of 12.05 µmol/mL hybridized with blue LED (λEL=452 nm) at an injection current level of 5 mA and the
electroluminescence spectrum of 50 µl red NC and 6.2 µl PMMA corresponding to a film concentration of 0.88 µmol/mL and 150 µl yellow NCs (λPL=620 nm and 580 nm) and 18.75 µl PMMA corresponding to a
film concentration of 12.05 µmol/mL hybridized on blue LED (λEL=452
nm) measured at an injection current level of 5 mA at room temperature. 71 Figure 5.3.4. Electroluminescence spectrum of 75 µl cyan NC and 9.3 µl PMMA corresponding to a film concentration of 12.05 µmol/mL and 150 µl yellow NCs (λPL=500 and 580 nm) and 18.75 µl PMMA corresponding to a film
concentration of 12.05 µmol/mL hybridized on blue LED (λEL=452 nm)
measured at an injection current level of 5 mA at room temperature. ... 71 Figure 5.3.5. Electroluminescence spectra of samples 20 and 21. Sample 20
consists of blended mixture of 75 µl cyan NC, 25 µl yellow NC, and 25 µl red NC (λPL=540 nm, 580 nm and 620 nm) and 2 µl, 6 µl and 80 µl PMMA
mixtures respectively, corresponding to film concentrations of 2.54 µmol/ml, 0.19 µmol/ml, and 0.06 µmol/ml. Sample 21 consists of layer-by-layer hybridization of 75 µl cyan NC, 25 µl yellow NC, and 25 µl red NC (λPL=540 nm, 580 nm and 620 nm) and 88 µl PMMA, corresponding to a
film concentration of 2.8 µmol/mL, respectively... 72
Figure 5.4.1. Image of white light emission from hybrid nanocrystal-conjugated polymer based white light emitting diodes: (a) yellow nanocrystals (λPL = 580 nm) and blue polyfluorene (λPL = 439 nm) (b) yellow and green
nanocrystals (λPL = 580 and 540 nm) and blue polyfluorene (λPL = 439 nm)
(c) yellow, green, and red nanocrystals (λPL = 580, 540 and 620 nm) and
blue polyfluorene (λPL = 439 nm), and (d) blends of yellow, green, and red
nanocrystals (λPL = 580, 540 and 620 nm) and blue polyfluorene (λPL = 439
nm) on a n-UV LED (λEL = 383 nm)... 74
Figure 5.4.1.1. (a) Photograph of polyfluorene photoluminescence in blue. (b) the green NC film, (c) the yellow NC film, and (d) the red NC film. ... 76 Figure 5.4.1.2. Photoluminescence spectra of the blue emitting conjugated
polymer polyfluorene, and green, yellow, and red emitting CdSe/ZnS nanocrystals. ... 76
xv
Figure 5.4.2.1. Electroluminescence spectra of yellow CdSe/ZnS core-shell nanocrystals (λPL = 580 nm) and blue polyfluorene conjugated polymer (λPL
= 439 nm) deposited layer-by-layer on an InGaN/GaN n-UV LED (λEL =
383 nm) at different levels of current injection (room temperature). Pictures of the generated white light, blue emission of the polymer and yellow emission of the nanocrystals are depicted. The location of the corresponding operating point on the (x, y) chromaticity coordinates is displayed... 77 Figure 5.4.3.1. Electroluminescence spectra of blue polyfluorene (λPL = 439 nm)
and green and yellow CdSe/ZnS core-shell nanocrystals (λPL = 540 and 580
nm) layer-by-layer hybridized on an InGaN/GaN n-UV LED (λEL = 383
nm) at different levels of current injection (at room temperature) along with a picture of the generated white light (blue polymer and green and yellow nanocrystals); and the location of the corresponding operating point on the
(x, y) coordinates. ... 79
Figure 5.4.4.1. Electroluminescence spectra of blue polyfluorene (λPL = 439 nm)
and yellow, green and red CdSe/ZnS core-shell nanocrystals (λPL = 580,
540 and 620 nm) layer-by-layer hybridized on a InGaN/GaN n-UV LED (λEL = 383 nm) at different levels of current injection (room temperature)
next to a picture of the generated white light, the blue emitting polymer and green, yellow and red emitting nanocrystals, and the location of the corresponding operating point on the (x, y) coordinates. ... 81 Figure 5.4.4.2. Controlling and improving color rendering index. ... 81 Figure 5.4.5.1. Electroluminescence spectra of blends of blue polyfluorene (λPL
= 439 nm) and yellow, green and red CdSe/ZnS core-shell nanocrystals (λPL
= 580, 540 and 620 nm hybridized on a InGaN/GaN n-UV LED at different levels of current injection at room temperature along with a picture of the generated white light, blue conjugated polymer and green, yellow and red nanocrystals, and the location of the corresponding operating point on the
xvi
List of Tables
Table 1.1. General comparison of current technologies... 4
Table 1.2. Technical comparison of current and future technologies. ... 5
Table 2.3.1. Light sources and their correlated color temperature... 12
Table 3.1.1. Materials and their emission wavelength. ... 17
Table 3.2.3.3.2.1. Comparison of current white LED technology. ... 23
Table 4.2.1. Molecules building up the nanocrystals and the photoluminescence peak of synthesized nanocrystals. ... 28
Table 4.4.1. Material parameters of CdSe and ZnS. ... 36
Table 4.4.2. Experimental and theoretically calculated data for different CdSe/ZnS core-shell nanocrystals... 42
Table 5.1.1. Size of our nanocrystals. 46 Table 5.1.9.1. Our hybrid NC-WLED sample characteristics... 56
Table 5.2.6.1. Summary of the optical characteristics of our hybrid NC-LED sources. ... 65
Table 5.3.1. Our hybrid NC-WLED sample characteristics. (C: cyan NC; G: green NC; Y: yellow NC; R: red NC; * denotes blended NC hybridization.) ... 67
Table 5.4.5.1. Hybrid polymer-NC WLED sample characteristics. (The sample with * means that polymer and NCs used as a blended mixture to hybridize the n-UV LEDs.) ... 84
1
Chapter 1
Introduction
Recently solid-state lighting using white light emitting diodes (WLEDs) has attracted world-wide attention because of the important economical and technological benefits for people in under-developed, developing and developed countries in terms of energy-saving, safety, reliability, maintenance, and high color quality [1]. Today two billion people around the world live in under-developed countries without electricity [2]. They use fuel based lighting for home illumination that causes an unhealthy and costly means of illumination with low light quality (e.g., low color rendering index) and people who cannot afford this kind of lighting cannot perform critical modern day evening activities such as reading, working and trading. Therefore, the advancement of solid state lighting with renewable energy sources is a key to the human development (e.g., the improvement of literacy and education) for the under-developed part of the world. For the two third of world population that live in developing and developed countries using electricity, it is estimated that 20% of the electricity production is currently consumed for lighting and solid-state lighting offers potentially 50% reduction globally in the electricity consumption for illumination [3]. Therefore, given the limited remaining resources and the current growth rates of countries, solid-state white light emitting devices are
2
critical for new industry and job areas and sustainable economic growth. Furthermore, regarding the global warming issue, solid state lighting provides an important solution to decrease the CO2 reduction about 300 million metric tons
annually as well [2]. To this end, the world-wide strong demand for the development of high quality WLEDs around the globe motivates our research work on the investigation of white light generation with high color rendering index in this thesis. For that, we develop and demonstrate nanocrystal hybridized tunable light emitting diodes with high color rendering index. In this thesis, we present design, epitaxial growth, fabrication, experimental and theoretical analysis of these hybrid white LEDs.
This thesis is organized as follows: In Chapter 1, we present a general introduction to the solid state lighting. In Chapter 2, we continue with the general concepts and parameters about light sources. In Chapter 3, we explain different methods for white light emitting diodes. In Chapter 4, we look at the synthesis, characterization and theoretical analysis of nanocrystals. In Chapter 5, we present nanocrystal based hybrid LEDs to generate and tune white light. In Chapter 6, we close our thesis with our conclusions.
Incandescent lamps: They are called electric lamps, arc lamp, light globes in
Australia and more commonly light bulbs in Anglophone countries [4]. An electrical current passes through a thin filament. Because of the resistance of filament, the filament gets hotter, becomes excited and as a result thermally equilibrated photons are released. The efficiency of this process is very low
3
because only 2% of the its energy can be used as visible light, the rest is wasted by heat and infrared light.
Fluorescent lamps: The electric current passes mercury vapor that produces
ultraviolet light [4]. The ultraviolet light is then absorbed by phosphorus coating that is inside the lamp. Afterward the phosphorus makes photoluminescence in visible spectrum. In fluorescent lamps the heat leakage is much less than incandescent lamps. However, efficiencies decrease because of ultraviolet light generation and convert ion of this light into visible light.
Solid State Lighting: Solid-state lighting (SSL) uses semiconductor materials converting electric energy into light. The electric current passes through the diode in forward bias mode. As the electrons and holes pass through the diode, they recombine and photons are generated. (More detailed information will be given in Chapter 3.)
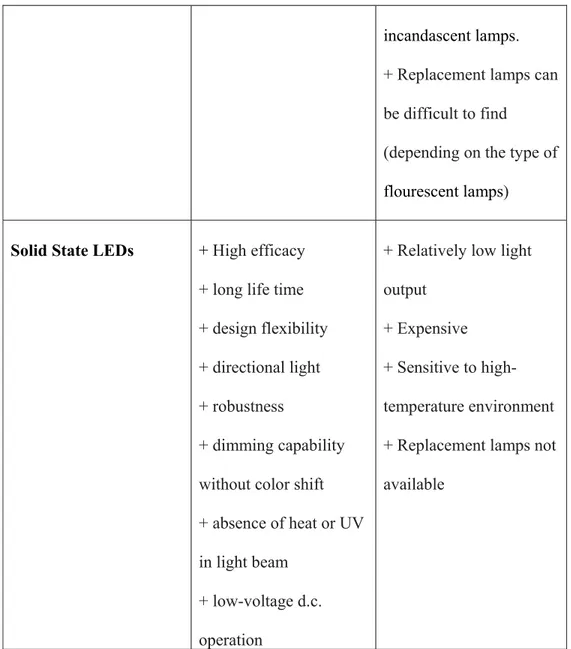
In Table 1.1, we show the general comparison of current technologies [5,6].
Advantages Disadvantages
Incandascent lamps + Dimmable
+ High color quality + Low lamp cost
+ High wattage + Short life
+ Heat increases cooling load
Flourescent lamps + High efficacy + Long life
+ Few dimmable products
4
incandascent lamps. + Replacement lamps can be difficult to find (depending on the type of
flourescent lamps)
Solid State LEDs + High efficacy + long life time + design flexibility + directional light + robustness
+ dimming capability without color shift + absence of heat or UV in light beam
+ low-voltage d.c. operation
+ Relatively low light output
+ Expensive + Sensitive to high- temperature environment + Replacement lamps not available
Table 1.1. General comparison of current technologies.
In Table 1.2, we make a technical comparison of current and future technologies [7].
5 Future solid state lighting Today solid state lighting Incandascent Flourescent Luminous efficacy (lm/W) 200 50-70 16 85 Lifetime (kh) >100 20 1 10 Flux (lm/lamp) 1,500 200 1,200 3,400 Input power (W/lamp) 7.5 1.2-2.6 75 20 Lumen cost ($/klm) < 2 20 0.4 1.5 Lamp cost ($/lamp) <3 4 0.5 5 Color Rendering Index (CRI) >80 70-80 95 75
6
Chapter 2
General concepts and parameters
about light sources
2.1. Technical concepts
Radiometric units: The physical properties of electromagnetic radiation are
characterized by radiometric units in terms of number of photons, photon energy and optical power (also called radiant flux) [8].
Photometric units: Photometric units characterize the light and color sensation
by the human eye. The following concepts are photometric units.
Eye sensitivity function: The function that converts radiometric units to
photometric units. The mostly commonly referred eye sensitivity function is CIE 1931 V(λ) function that is the current photometric standard in the United States.
Luminous intensity: Luminous intensity shows the light intensity of an optical
source that is received by human eye. It is measured in units of candela (cd), which is an unit of the International System of Units (SI units).
Another current definition of luminous intensity is as follows: a monochromatic light source emitting an optical power of (1/683) watt at 555 nm into the solid angle of 1 steradian (sr) has a luminous intensity of 1 candela (cd).
7
Luminous flux: Luminous flux shows the light power of an optical source that
is received by the human eye. Its unit is lumen (lm).
Φlum= 683 lm/W ∫λ V(λ)P(λ)dλ, (2.1.1)
where P(λ) is the power spectral density.
Illuminance: Illuminance is the luminous flux incident per unit area. Its unit is
lux which is lm/m2. For example, the illuminance of full moon is 1 lux and the
illuminance of direct sunlight is 100000 lux.
Luminance: The ratio of the luminous intensity emitted in a certain direction
divided by the projected surface area in that direction. Its unit is cd/m2.
Luminous efficacy: Luminous efficacy is the conversion efficiency from
optical power to luminous flux.
Luminous efficacy = Φlum/P = [683 lm/W ∫λ V(λ)P(λ)dλ] / [∫λ P(λ)dλ] (2.1.2) Luminous efficiency: Luminous efficiency is the luminous flux of the light
source divided by the electrical input power. For instance, luminous efficiency of fluorescent light tubes are 50-80 lm/W.
Luminous efficiency = Φlum/(IV) (2.1.3)
2.2 Color-matching function and chromaticity
diagram
Since the sensation of color may change from one person to another one, the International Commission for Illimunation (Commission Internationale de l’Eclairage, CIE) standardized measurement of color through color-matching functions and the chromaticity diagram. The color matching functions are obtained by using two lights side by side, one being monochromatic and the
8
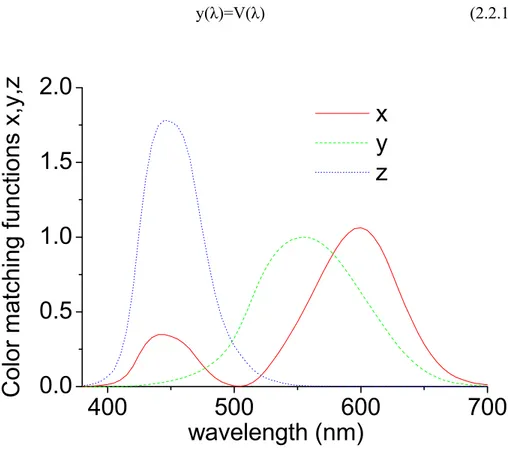
other one being a mixture of three primary lights with color red, green and blue. By adjusting the relative intensities of the red, green and blue lights a person can adjust to match them when the two lights appear identical. Through these matches the three color-matching functions are obtained. The CIE 1931 color matching functions x(λ), y(λ) and z(λ) are shown in Figure 2.2.1. The green color matching function in the Figure 2.2.1 which one is identical to the eye sensitivity function. y(λ)=V(λ) (2.2.1)
400
500
600
700
0.0
0.5
1.0
1.5
2.0
x
y
z
Color matching funct
ions x,y,
z
wavelength (nm)
Figure 2.2.1. Spectral distribution of Color matching functions.
For a given power spectral density, the X, Y and Z tristimulus values are calculated as following:
9
Y = ∫λ y(λ)P(λ)dλ (2.2.3)
Z = ∫λ z(λ)P(λ)dλ (2.2.4)
Although the units of X,Y and Z values seem Watt, they are unitless because in front of the integral there is a 1/Watt prefactor that makes them unitless. The chromaticity coordinates are calculated by using the tristimulus coordinates as following:
x= X/(X+Y+Z) (2.2.5) y= Y/(X+Y+Z) (2.2.6) z= Z/(X+Y+Z)= 1-x-y (2.2.7) The (x,y) chromaticity diagram is shown in Figure 2.2.2.
10
The equal energy point located in the center of the chromaticity diagram is at (x,y,z) = (1/3,1/3,1/3).
2.3 Color temperature
There exist a large number of optical spectra which white light can be obtained. By using planckian black-body radiation spectrum with its color temperature the white light and other visible spectra can be described. The black-body spectrum depending on wavelength is as following [8]:
] 1 ) [exp( 2 ) ( 5 2 − = kT hc hc I λ λ λ (2.3.1)
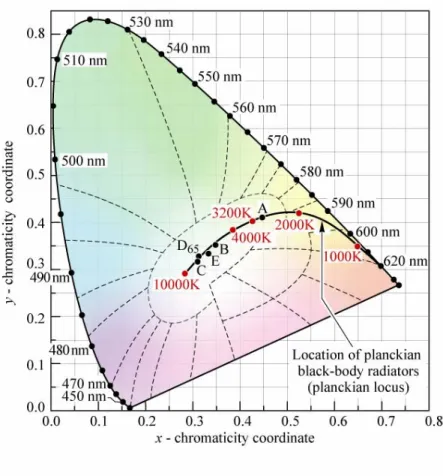
As the temperature of the black-body increases, the chromaticity follows the colors red, orange, yellowish white, white, and bluish white. The unit of the color temperature is Kelvin and color temperature shows the chromaticity diagram location on the planckian locus. However, should not the (x,y) coordinate of the white light source fall on the planckian locus, the correlated color temperatue is used whose unit is Kelvin as well. In Figure 2.2.3, Illuminant A is incandescent source with T=2856 K and (x,y)= (0.44, 0.40), Illuminant B is direct sunlight with T=4870 K and (x,y)= (0.34, 0.35) and Illuminant E is equal energy point with (x,y)= (0.33, 0.33).
11
Figure 2.2.3. Chromaticity diagram showing planckian locus. (After Ref. 8) The correlated color temperature is calculated by looking at the nearest distant plankian locus point on the (u’,v’) chromaticity diagram to a white light source. The (u’,v’) point which is a transformation of (x,y) point is calculated as following: Z Y X X u 3 15 4 ' + + = (2.3.2) Z Y X Y v 3 15 9 ' + + = (2.3.3)
12
Light source Correlated color temperature (K)
“Warm white” flourescent tube 3000 “Cool daylight white” flourescent tube 4300
Xenon Arc 6000
Direct sun 5700-6500
Clear blue sky 8000-27000
Table 2.3.1. Light sources and their correlated color temperature [After Ref. 8].
2.4 Color mixing
Determination of chromaticity coordinates of the mixture emissions is also possible. Assume that there are three emission peaks at wavelengths λ1, λ2 and λ3
with spectral power densities P1(λ), P2(λ) and P3(λ) and with chromaticity
tristimulus coordinates (x1,y1), (x2,y2) and (x3,y3) respectively. Then the
combined tristimulus coordinate is found as following:
3 3 2 2 1 1 3 2 1( ) ( ) ( ) ( ) ( ) ( ) ( ) ( ) ) ( P d x P d x P d x P x P x P x X =
∫
λ λ λ λ+∫
λ λ λ λ+∫
λ λ λ λ≈ λ + λ + λ (2.4.1) 3 3 2 2 1 1 3 2 1( ) ( ) ( ) ( ) ( ) ( ) ( ) ( ) ) ( P d y P d y P d y P y P y P y Y =∫
λ λ λ λ+∫
λ λ λ λ+∫
λ λ λ λ≈ λ + λ + λ (2.4.2) 3 3 2 2 1 1 3 2 1( ) ( ) ( ) ( ) ( ) ( ) ( ) ( ) ) ( P d z P d z P d z P z P z P z Z =∫
λ λ λ λ+∫
λ λ λ λ+∫
λ λ λ λ≈ λ + λ + λ (2.4.3) 1 1 1 1 1 1 1 x( )P y( )P z( )P L = λ + λ + λ (2.4.4) 2 2 2 2 2 2 2 x( )P y( )P z( )P L = λ + λ + λ (2.4.5) 3 3 3 3 3 3 3 x( )P y( )P z( )P L = λ + λ + λ (2.4.6) 3 2 1 3 3 2 2 1 1 L L L L x L x L x x + + + + = (2.4.7) 3 2 1 3 3 2 2 1 1 L L L L y L y L y y + + + + = (2.4.8)13
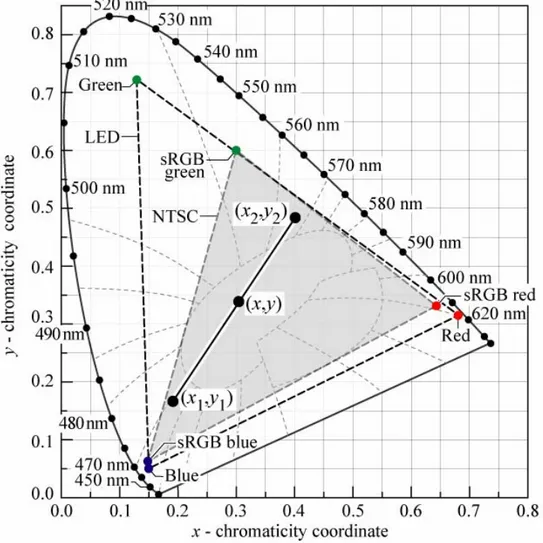
When we mix two colors L3=P3=0, the mixed color will be located on a straight
line connecting the chromaticity coordinates of two sources. Any color on the line can be generated by mixing the two sources. In the case of three source such as trichromic LED, we can combine the chromaticity coordinate of the sources by three straight line which makes a triangle. This triangle is called the color gamut and all the colors inside of the gamut can be generated, however, any color outside the gamut cannot be generated.
Figure 2.4.1. Principle of color mixing illustrated with two light sources with chromaticity coordinates (x1,y1) and (x2,y2). Also the triangular area of the
14
chromatic diagram (color gamut) accessible by additive mixing of a red, green and blue LED is shown (After Ref. 8).
2.5 Color rendering
The ability whether the light sources show the true color of the physical objects is very important. This characteristic of a light source is measured in terms of color-rendering index or CRI. We can see the importance of color rendering in our life, too. The color of objects under high quality white light sources appears richer and more vivid. High color rendering index sources are generally used in museums, homes and offices and low CRI sources mostly used in streets and parking lots.
The color rendering of a test source is measured with respect to a reference light source. In order to calculate the CRI, the reference light source is selected according to the chromaticity coordinate of the test source. If the chromaticity coordinate point is on the planckian locus, the reference source is a planckian blackbody radiator with the same color temperature as the test source. If the coordinate point is off from the planckian locus, the reference source is a planckian black-body radiator with the same correlated color temperature as the test source.
CRI is a unitless quantity that changes form -100 to 100. The reference sources are accepted with a CRI of 100. If a test light source has 100 CRI, then one can understand that the light source is high quality source that can fully render all the colors of the physical objects. Illuminants excluding reference sources generally have CRI lower than 100. Since the CRI is calculated according to the reference source, the selection of the reference source is critically important.
15
The emission spectrum of incandescent lamp closely follows that of a planckian black-body radiator. Therefore, its CRI is the highest among the artificial sources mentioned in Chapter 1.
To determine the CRI of a test light source additional to the test-color samples, test color samples are needed. In international standardization, 14 test color samples has been agreed in order to measure the CRI, but the general CRI is an average calculated according to the 8 test-color samples with the following formula [8]:
∑
= = 8 1 8 1 i i general CRI CRI (2.5.1)The special color-rendering indices are calculated according to:
* 6 . 4 100 i i E CRI = − ∆ (2.5.2) * i E
∆ is the quantitative color change that occurs when a test-color sample is illuminated with the reference source and then with the test source. The special CRI is 100 if there is no difference of the test-color sample in color under test and reference light source. However, in order to use WLEDs in SSL applications the aim is to have a CRI higher than 80.
16
Chapter 3
White Light Emitting Diodes
3.1 Working principle of LEDs
By forward biasing the pn junctions electrons and holes are injected into the same region of the semiconductor. As a result they recombine and emit light by spontaneous emission. LEDs can make emission in direct band gap semiconductors and through impurity states [9]. Direct band to band transitions can be made in any direct band gap material and combinations of materials that have hole and electron wavefunction overlap under forward bias. Emission through impurity states can be made in different ways: donor state to valence band, conduction state to acceptor state and donor state to acceptor state.
Because of the wide range of available direct gap semiconductors and impurity states in indirect semiconductors, there is broad range of spectral range that can be covered form infrared to ultraviolet. Some possible semiconductor materials and wavelengths are listed in Table 3.1.1. Wide range of available wavelengths for LEDs with different combination of luminescent materials make possible to produce white light generation.
17 Material Wavelength (nm) InAsSbP/InAs 4200 In0.53Ga0.37As 1550 GaAs:Si 940 GaP 690 SiC 400-460 Table 3.1.1. Materials and their emission wavelengths [After Ref. 9].
3.2. White LEDs
There is an increasing research effort in the development of general daylight illumination devices because of the huge market size and application such as in homes, cars, offices, and so on. The general daylight illumination systems should have the following properties [8]:
- high efficiency - high power capability
- good color rendering capabilities - high reliability
- low-cost manufacturability - environmental friendly
These properties would give the opportunity WLEDs to compete with other light sources. Although LEDs are commonly monochromatic sources, there are mainly three ways for making white LEDs: multichip white LEDs, monolithic white LEDs and color conversion based WLEDs.
18
In this approach multiple emitter diodes are mounted in one package. Multichip white LEDs have three individual LEDs, which are generally InGaN based blue- and green-LEDs, and an AlGaInP based red-LED [10].
3.2.2. Monolithic white LEDs
This second method for white light generation is monolithic white LED method which relies on using the multicolor emitting multiple-quantum well (MQW) for the active layers. Generally these LEDs use several InGaN active layer and cover a visible region with high color purity. The Figure 3.2.2.1 shows the epitaxial design of such a monolithic white LED.
Sapphire Nucleation layer n-GaN layer InGaN QWs λ=440 nm n-GaN InGaN QWs λ=580 nm p-type GaN layer
19
3.2.3 WLEDs based on wavelength converters
As the third method, we look at the color conversion method. There are different materials which can be used as wavelength converters (dyes, polymers, phosphors and nanocrystals) and these materials are integrated on the LEDs. The operating principle of these hybrid WLEDs relies on the hybrid use of the LED as the pump light source and the integrated film consisting of the wavelength converter materials as the photoluminescent layer. When electrically driven, the LED optically pumps the wavelength converter materials. The photoluminescence of these materials and the electroluminescence of the LED consequently contribute together to the white light generation.
3.2.3.1 Dye based WLEDs
Many different dyes for instance Coumarin 6 can have very high quantum efficiency close to %100 [8]. But they have long-term stability problem that prevent them to be used as a commercial product in white LEDs. After some number of photon absorption events, dye molecules become optically inactive; in other words, they bleach out.
3.2.3.2 Polymers based WLEDs
Among various polymer types, specifically conjugated polymers can be one of the strong candidates in lighting applications. They have very strong absorption both in n-UV and blue on the order of 105 cm−1 with very high quantum efficiency which is better than phosphors; additionally they can deposited easily
20
with common techniques such as dipping and spin coating and noticably they are almost entirely free from concentration quenching effects [11]. Some polymers also have long-term stability problem which can be a strong obstacle for commercial application.
3.2.3.3 Phosphors based WLEDs
Phosphors consist of an inorganic host material commonly garnets doped with an optically active element. Phosphors with yttrium aluminum garnet (YAG) are the most widely used host material. The optical characteristics of YAG phosphor can be changed by substituting Gadolinium (Gd) for Yttrium (Y),Gallium (Ga) for Aluminum (Al) and doping with cerium (Ce) whose chemical formula is (Y
1-aGda)(Al1-bGab)5O12 : Ce [8].
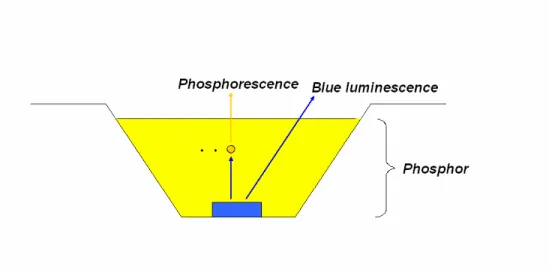
Figure 3.2.3.3.1. Wavelength-converting phosphorescence and blue luminescence in phosphor based WLEDs.
21
3.2.3.3.1 Blue-pumped phosphor based white
LEDs
After Nakamura et al. reported the InGaN/GaN LED that can generate 3 mW optical power (1995), Bondo et al. used phosphor wavelength converter on InGaN/GaN blue LED [12,13]. Afterward Nichia Corporation commercialized for the first time the blue InGaN/GaN LED and phosphor based white LEDs which integrated on the blue InGaN/GaN LED. These historical points in the history can be accepted as the turning point of the solid state lighting dream which longs for LEDs to be used for every illumination need.
Blue-pumped phosphor based white LEDs are schematically as shown in Figure 3.2.3.3.1. The cup shaped depression is filled with the phosphor resin where at the bottom the LED die stands. Some portion of the blue light coming from the electroluminescence (EL) is absorbed by the phosphor and the rest transmits. After absorption the phosphor makes photoluminescence (PL), and the EL and PL generates white light together. The optical properties of WLED are determined by the thickness and concentration of the phosphor resin.
3.2.3.3.2 UV-pumped phosphor based white LEDs
WLEDs can be also achieved by using ultraviolet (UV) source as well. The UV light pumps the phosphor and the entire visible spectrum is covered by the PL of phosphors. The UV pump source can be selected from near UV (320 nm-390 nm) to deep UV (320 nm-210 nm). But as the pump source goes to deeper UV, the energy loss because of the conversion from UV to visible increases. In Table 3.2.3.3.2.1 presents a comparison of advantages and disadvantages among
blue-22
pumped phosphor based white LEDs, UV-pumped phosphor based white LEDs and multichip WLEDs [10,14].
Advantages Disadvantages Blue-pumped phosphor based white LEDs - Most mature technology - High-volume manufacturing processes - Relatively high luminous flux - Relatively high efficacy - Comparatively lower cost - High CCT (cool/blue appearance)
- Low CRI (typically in the 70s) - Color variability in beam - Difficulties in controlling granule size systematically and mixing and depositing films uniformly UV-pumped phosphor based white LEDs - Higher color rendering - Warmer color temperatures possible - Color appearance less affected by chip
- Less mature technology - Relatively low efficacy - Relatively low light output - the low absorption of
phosphors at near-ultraviolet (n-UV) wavelengths results in small
23
variations conversion efficiencies - Difficulties in controlling granule size systematically and mixing and depositing films uniformly
Multichip-white-LEDs
- Color flexibility, both in multi-color displays and different shades of white
- Potentially very high color rendering
- Individual colored LEDs respond differently to drive current, operating temperature, dimming, and operating time - Controls needed for color consistency add expense -Complex driving circuitry
Monolithic-white-LEDs
- Simple circuitry - Potentially high color rendering
- the EL peaks very sensitive to LED temperature (change of optical properties with temperature)
- forward bias current changes the color temperature
24
Chapter 4
Nanocrystals
Quantum dots are nanosize crystals composed of periodic groups of II-VI, III-V, or IV-VI materials. In such nanocrystals, the atoms form together sphere like structure whose diameters range from 2-10 nanometers. The nanocrystals (NCs) emission can be tuned by dot size and composition. In the bulk case, the energy levels in valence and conduction bands are continous. However, as the size of the crystal decreases, the continous energy levels start to discretize. In other words, when the nanorystals begin to be synthesized smaller than the Bohr radius, the quantum size effect (quantum confinement) begin to be observed. By using the size effect, the NCs emission peak can be tuned. If this band gap energy corresponds to the photons in visible, the color of the emission of NCs perceived by the human eye can be tuned. For instance, CdSe/ZnS core-shell nanocrystals having 4.2 nm diameter have luminescence at green and the same type of nanocrystals having 5.7 nm diameter have red luminescence. Another degree of freedom though which the emission peak of nanocrystals can be tuned is the composition of nanocrystals. By using various materials the band gap energy of the NC can be adjusted and emission wavelenghts from violet to mid-infrared across the whole spectrum can be achieved. For example, by using
25
CdSe/ZnS core shell nanocrystals most of the visible spectrum from 490 nm to 620 nm can be covered and by using PbSe and PbS the emission peak in the near infrared spectrum can be adjusted from 850 to 2100 nm [15].
4.1 Synthesis of Nanocrystals
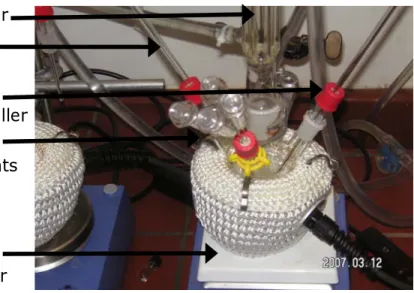
The NCs can be synthesized with the hot injection method. To synthesize CdSe core NCs, we need 1 gr HdA, 1 gr TOPO, 6 ml octadecene, 2 ml Cd solution [0.1 Molar]. We put all of them into the flask as in Figure 4.1.1 and heat it to 280o C. Heater & Stirer Argon gas Adding elements e.g. Se Temp. Controller Condenser
Figure 4.1.1. Photograph of nanocrystal synthesis flask with the necessary equipments with their explanation.
Afterward we add Se solution. However, transfering Se and putting it into the flask is a dangerous task because it should not get in touch with oxygen.
26
Therefore, it is taken into in glove box in Figure 4.1.2 where there is no oxygen. As soon as, we inject 2 ml 0.1 Molar Se solution into the flask, the reaction starts.
Figure 4.1.2. Photograph of glove box used for taking Se solution.
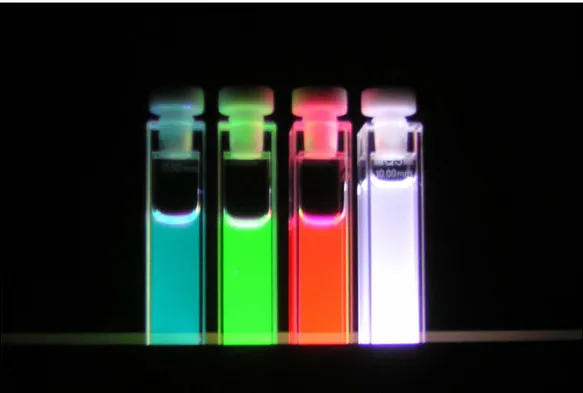
The reaction time and reaction temperature determine the size of the core NCs and therefore the emission wavelength. At 280o C 5 seconds or less reaction time results cyan emitting NCs and 5 minute or more reaction time causes red emitting NCs. At higher reaction temperatures less than 5 minutes is sufficient for obtaining red NCs. After the reaction time finished, we cool the flask by putting it into a water cup at room temperature. We add hexane solution and put into another clean flask. We wait a few hours for NCs and hexane solution phase separation and finally we take the NCs into the tubes. The photographs of NCs under UV light are shown in Figure 4.1.3.
27
Figure 4.1.3. Photograph of cyan, green, and red CdSe core NCs and surface state emtting CdS NCs (from right to left).
4.2 Synthesized nanocrystals and their
photoluminescence peaks
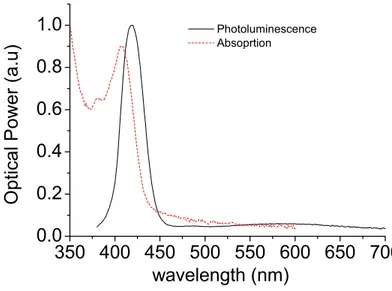
Table 4.2.1 displays the photoluminescence peaks and materials of NCs that we synthesized as a collaborative research effort between Bilkent University and Technical University of Dresden within EUFP6 Phoremost Network of Excellence. Figure 4.2.1-10 shows the normalized absorption and emission spectra of synthesized NCs which are given in Table 4.2.1.
Nanocrystal PL peak (in solution )
CdS 419 CdS 445 CdSe 456 CdSe 485
28 CdSe 502 CdSe 521 CdSe 538 CdSe 620 CdS (surface state emitting NCs)
emission across the entire visible
CdSe/ZnS/CdSe
(onion-like NCs) 520-560-620
Table 4.2.1. The types nanocrystals and the photoluminescence peak of synthesized nanocrystals.
350 400 450 500 550 600 650 700
0.0
0.2
0.4
0.6
0.8
1.0
Optical Power (a.
u
)
wavelength (nm)
Photoluminescence Absoprtion
Figure 4.2.1. PL and absorption spectra of violet (λPL=419 nm) CdS nanoparticle
29
350
400
450
500
550
0.0
0.2
0.4
0.6
0.8
1.0
Opti
cal Pow
er
(a.u)
wavelength (nm)
Photoluminescence AbsorptionFigure 4.2.2. PL and absorption spectra of blue CdS (λPL=445 nm) nanoparticle
in solution.
350
400
450
500
0.0
0.2
0.4
0.6
0.8
1.0
Optical Pow
e
r (a.u)
wavelength (nm)
PL AbsorptionFigure 4.2.3. PL and absorption spectra of blue (λPL=456 nm) CdSe nanoparticle
30
350
400
450
500
550
0.0
0.2
0.4
0.6
0.8
1.0
Opti
cal
Pow
e
r (a.u)
wavelength (nm)
Photoluminescence AbsorptionFigure 4.2.4. PL and absorption spectra of CdSe (λPL=485 nm) nanoparticle in
solution.
350 400 450 500 550 600 650 700
0.0
0.2
0.4
0.6
0.8
1.0
Optical
Pow
e
r (a.u)
wavelength (nm)
Photoluminescence AbsorptionFigure 4.2.5. PL and absorption spectra of cyan CdSe (λPL=502 nm) nanoparticle
31
350 400 450 500 550 600 650 700
0.0
0.2
0.4
0.6
0.8
1.0
Opti
cal Pow
er
(a.u)
wavelength (nm)
PL AbsorptionFigure 4.2.6. PL and absorption spectra of green (λPL=521 nm) CdSe
nanoparticle in solution.
400
450
500
550
600
650
0.0
0.2
0.4
0.6
0.8
1.0
Optical Power (a.
u
)
wavelength (nm)
Photoluminescence Absorption
Figure 4.2.7. PL and absorption spectra of yellow CdSe (λPL=538 nm)
32
400
450
500
550
600
650
700
0.0
0.2
0.4
0.6
0.8
1.0
Optical
Pow
e
r (a.u)
wavelength (nm)
PL AbsorptionFigure 4.2.8. PL and absorption spectra of red (λPL=620 nm) CdSe nanoparticle
in solution.
350 400 450 500 550 600 650 700
0.0
0.2
0.4
0.6
0.8
1.0
Opti
cal Pow
er
(a.u)
wavelength (nm)
Absorption PLFigure 4.2.9. PL and absorption spectra of white surface state emitting CdS nanoparticle in solution.
33
350 400 450 500 550 600 650 700
0.0
0.2
0.4
0.6
0.8
1.0
Opti
cal Pow
er
(a.u)
wavelength (nm)
PL AbsorptionFigure 4.2.10. PL and absorption spectra of onion like CdSe/ZnS/CdSe (λPL=520, 560 and 620 nm) nanoparticle in solution.
4.3 Theoretical investigation of energy levels
The stationary Schrödinger equation for a particle under the action of a force can be expressed as: ) ( ) ( ) ( 2 2 2 r E r r V m r r r h ψ = ψ ⎥ ⎦ ⎤ ⎢ ⎣ ⎡ + ∇ − (4.3.1)
where h is Planck’s constant divided by 2π , m is the particle mass, V r is the (r) potential, E is the energy eigenvalue and ψ(rr)is the eigenfunction. For a spherically symmetric potential V r =(r) V(r)and the wavefunction can be separated to its radial and angular parts,
) , ( ) ( ) , , ( θ φ θ φ ψnlm r =Rnl r Ylm (4.3.2)
34 )
(r
Rnl is the radial wavefunction, Ylm(θ,φ) is the spherical harmonic, n is the
principal quantum number, and l and m are the angular momentum numbers. The spherical potentials in different N regions can be written as
⎪ ⎪ ⎪ ⎩ ⎪⎪ ⎪ ⎨ ⎧ ∞ < ≤ < ≤ < ≤ = r r for . . r r for r 0 for ) ( 1 -2 1 2 1 1 N N V r V r V r V (4.3.3)
The radial eigenfunction can be Rnl(r)written as
⎪ ⎪ ⎪ ⎩ ⎪ ⎪ ⎪ ⎨ ⎧ ∞ < ≤ < ≤ < ≤ = r r for . . r r for r 0 for ) ( 1 -, 2 1 2 , 1 1 , N N nl nl nl nl R r R r R r R (4.3.4)
If we look at the solution ofRnl,qwhen Enl>Vq, the solution is a linear combination of spherical Bessel and Neumann functions j and l n , l
respectively: ) ( ) ( ) ( , , , , , r A j k r B n k r Rnlq = nlq l nlq + nlq l nlq (4.3.4) where 2 / 1 2 , ) ( 2 ⎥ ⎦ ⎤ ⎢ ⎣ ⎡ − = h q nl q q nl V E m k (4.3.6)
35
If we look at the solution ofRnl,qwhenEnl< , the solution is a linear Vq
combination of two Hankel functions (+) l h and (−) l h [16]: ) ( ) ( ) ( ( ) , , , ) ( , , r A h iK r B h iK r Rnlq = nlq l+ nlq + nlq l − nlq (4.3.7) where 2 / 1 2 , ) ( 2 ⎥ ⎦ ⎤ ⎢ ⎣ ⎡ − = h nl q q q nl E V m K (4.3.8)
The solution should satisfy the continuity at boundary conditions for each part ) ( ) ( , 1 ,q q nlq q nl r R r R = + (4.3.9) q q r r q nl q r r q nl q dr r dR m dr r dR m = + + = = 1 ( ) ) ( 1 , 1 1 , (4.3.10)
The solution has to be regular at r = 0 and R should go to zero whennl r→∞. In
this solution, since we have N parts, we have 2N unknowns. As a result of continuity at boundaries, we have 2N-2 equations because we have N-1 boundaries. We need two equations more to completely solve the coefficients. One of them is that the determinant of the coefficients should be zero to have a solutionDl =Dl(Enl)=0. Another one is the normalization condition forRnl(r).
Since we need to calculate the interband transitions from conduction band to valence band, we can only look at 1s states both for electrons and holes in which n=1, l=0, m=0 and Y0,0(θ,φ) yields a constant factor of
2 / 1 ) 4 /( 1 π . We perform the calculations for electrons and holes separately because their band discontinuities and effective masses are generally different.
36
4.4 Calculation of energy eigenvalues and energy
eigenfunctions of CdSe/ZnS core-shell
nanocrystals
The material parameters of CdSe and ZnS are given in Table 4.4.1. By using these parameters, the radial energy diagram of CdSe/ZnS core-shell nanocrystal is as given in Figure 4.4.1
Material me* mh* Eg (eV) Evacuum (eV)
CdSe 0.13 0.45 1.7 4.4 ZnS 0.28 0.49 3.76 3.4 Table 4.4.1. Material parameters of CdSe and ZnS [After Ref. 17, 18].
R
E
CdSe
ZnS
1.7 eV 1 eV 1.06 eVFigure 4.4.1. Energy diagram of CdSe/ZnS core-shell nanocrystals.
Since in bound states Enl>Vq, the general wavefunction in CdSe well should
37
wavefunction should not blow up at r=0, so the coefficient of Neumann function should be zero. Therefore, the wavefunction has the following form:
r k r k A r 1 1 1 ) sin( ) ( = ψ (4.4.1)
In ZnS barrier, because of Enl<Vq, the general wavefunction can be written as a
linear combination of spherical Hankel functions. Since the wavefunction in barrier should vanish as r→∞, it is of the form of:
r k e B r r k 2 2 2 ) ( − = ψ (4.4.2)
The kq’s can be written in terms of energy as
2 , 1 1 2 h E m k = eff (4.4.3) because V1 is zero. 2 2 , 2 2 ) ( 2 h E V m k = eff − (4.4.4)
We can write the following equalities at boundaries between core and shell,
d k e B d k d k A d k 2 1 1 ) 2 sin( = − (4.4.5) ⎥ ⎦ ⎤ ⎢ ⎣ ⎡ − − = ⎥ ⎦ ⎤ ⎢ ⎣ ⎡ − − −2 , 2 2 1 1 1 , 1 2 2 ) sin( ) cos( d e d e m B d k d k d d k m A kd kd eff eff (4.4.6)
38
Then we should write these equations in the 2x2 matrix form. We have solution when the determinant of the matrix (which is dependent on k1 and k2 in other
words energy) is zero. At the first energy value that crosses zero is our E1s
energy eigenvalue. For one computational example, we take the crystal diameter to be 4.8 nm (d=2.4) whose PL is provided in Reference 21 so that we can also compare our results. The determinant vs. energy for electrons is given in Figure 4.4.2.
The zero-crossing energy with respect to its conduction band is
E1se= 0.2686 eV (4.4.7)
Figure 4.4.2. Determinant of 2x2 matrix vs. energy for electrons.
The determinant vs. energy for holes is plotted in Figure 4.4.3. The zero-crossing energy for holes with respect to valence band is
39
Figure 4.4.3. Determinant of 2x2 matrix vs. energy for holes.
The total energy difference is then
∆E=Eg(CdSe) + E1se+ E1sh = 1.70 + 0.2686 + 0.1143= 2.0803 eV (4.4.9)
The corresponding wavelength is
nm 596 ≅
λ (4.4.10) The measured photoluminescence in [12] is approximately 598 nm, which shows that our theoretical calculations fit very well to the experimental data. If we find the electron probability distribution:
B/A = -472.9965 (4.4.11) k1 = 9.5778 x 10⁸ 1/m (4.4.12)
40 By using normalization,
A= 8.541 x 10¹³ 1/m1/2 (4.4.14) B= -4.04 x 10¹⁶ 1/m1/2 (4.4.15)
Figure 4.4.4. Radial probability distribution of electrons.
If we find the hole probability distribution,
B/A= -4.4803 x 10³ (4.4.16) k1 = 1.1624 x 10⁹ (4.4.17) k2 = 3.4891 x 10⁹ (4.4.18) By using normalization, A=1.118 x 10¹⁴ 1/m1/2 (4.4.19) B= 5.006 x 10¹⁴ 1/m1/2 (4.4.20)
41
Figure 4.4.5. Radial probability distribution of holes.
From here we see that although electron and holes are more concentrated on the core, they also slightly penetrate to the barrier as well. Since its effective mass is smaller, the electron can penetrate more into the barrier. As Battaglia et al. explained in [19] after the third monolayer of ZnS barrier, the carriers become isolated in the nanocrystal (but not for one and two monolayer barriers). Adding three monolayers of ZnS shell corresponds to 1.6 nm thickness [20]. If we look at the probability distributions of holes, we observe that the hole distribution vanishes almost when it reaches 2.8 nm. Additionally, if we look at the probability distributions of electrons, their probability vanishes approximately at 3.4 nm. Therefore, we conclude that one or two monolayers of ZnS barriers do not fully isolate the carriers in quantum dot, but three monolayers of ZnS barrier
42
confines the carriers as discussed in [19]. Also we make calculations for nanocrystals of different sizes; the comparison is shown in Table 4.4.2.
NC core diameter size (nm)
2.3 4.2 4.8 5.5
Experimental PL data
(nm) [21] 480 568 598 624
Calculated PL data (nm) 450 572 595 617
Table 4.4.2. Experimentally measured and theoretically calculated PL peaks for different-size CdSe/ZnS core-shell nanocrystals.
Except the results for nanocrystal with 2.3 nm radius, the other results are compromising. The discrepancy for the nanocrystal with 2.3 nm radius can be attributed to the excitonic effects. Since the carriers are more confined in a tighter volume, the Coulomb interaction between the electron and hole will be more significant, introducing excitonic states and further decreasing the energy separation between the electron and hole energy levels.
43
Chapter 5
Nanocrystals based hybrid LEDs to
generate and tune white light
5.1 White light generation using CdSe/ZnS core–
shell nanocrystals hybridized with blue
InGaN/GaN light emitting diodes
To date multi-chip WLEDs, monolithic WLEDs, and color-conversion WLEDs, commonly with phosphor, have been extensively exploited [8,10,22]. Also, as an alternative approach, nanocrystals (NCs) have recently been used for color conversion in white light generation; a blue/green two-wavelength InGaN/GaN LED coated with a single type of red NCand a blue InGaN/GaN LED with a single type of yellow NC and a dual type of red and green NCs have been reported [23-25].
In the most common approach of color-conversion WLEDs coated with phosphor, although phosphor is good for photoluminescence across the visible, in addition to its disadvantages explained in Table 3.2.3.3.2.1, it has a fixed
44
emission spectrum. On the other hand, the use of combinations of nanocrystals provides the ability to easily adjust the white light parameters. Therefore, in this part, we introduce white light generation using CdSe/ZnS core-shell nanocrystals of single, dual, trio, and quadruple combinations hybridized with InGaN/GaN LEDs as shown in Figure 5.1.1 while generating white light.
(a) (b) (c) (d)
Figure 5.1.1. Photographs of our white hybrid NC-WLEDs while emitting white light: (a) yellow NCs (λPL=580 nm) hybridized with blue LED (λEL=440 nm),
(b) cyan and red NCs (λPL=500 nm and 620 nm) with blue LED (λEL=440 nm),
(c) green, yellow, and red NCs (λPL=540 nm, 580 nm and 620 nm) with blue
LED (λEL=452 nm), and (d) green, cyan, yellow, and red NCs (λPL=500 nm, 540
nm, 580 nm, and 620 nm) with blue LED (λEL=452 nm).
We present the design, growth, fabrication, and characterization of our white hybrid nanocrystal-LEDs that incorporate combinations of 1.) yellow nanocrystals (λPL=580 nm) on a blue LED (λEL=440 nm) with tristimulus
coordinates of (x, y)=(0.37, 0.25), correlated color temperature of Tc=2692 K,
and color rendering index of Ra=14.69; 2.) cyan and red nanocrystals (λPL=500
nm and 620 nm) on a blue LED (λEL=440 nm) with (x, y)=(0.37, 0.28), Tc=3246
K, and Ra=19.65; 3.) green, yellow, and red nanocrystals (λPL=540 nm, 580 nm,
and 620 nm) on a blue LED (λEL=452 nm) with (x, y)=(0.30, 0.28), Tc=7521 K,
and Ra=40.95; and 4.) green, cyan, yellow, and red nanocrystals (λPL=540 nm,
500 nm, 580 nm, and 620 nm) on a blue LED (λEL=452 nm) with (x, y)=(0.24,