FUNCTIONAL EFFECTS OF
ATAD2 GENE EXPRESSION
IN BREAST CANCER
A THESIS SUBMITTED TO
THE GRADUATE SCHOOL OF ENGINEERING AND SCIENCE OF BİLKENT UNIVERSITY
IN PARTIAL FULFILLMENT OF THE REQUIREMENTS FOR THE DEGREE OF
MASTER OF SCIENCE IN
MOLECULAR BIOLOGY AND GENETICS
By
Buse Nurten Özel August 2016
ii
FUNCTIONAL EFFECTS OF ATAD2 GENE IN BREAST CANCER
By Buse Nurten Özel August, 2016
We certify that we have read this thesis and that in our opinion it is fully adequate, in scope and in quality, as a thesis for the degree of Master of Science.
Işık Yuluğ (Advisor)
Ali Osmay Güre
Bala Gür Dedeoğlu
Approved for the Graduate School of Engineering and Science:
Levent Onural
iii
ABSTRACT
FUNCTIONAL EFFECTS OF ATAD2 GENE EXPRESSION
IN BREAST CANCER
Buse Nurten Özel
M.S. in Molecular Biology and Genetics Advisor: Işık Yuluğ
August 2016
The ATAD2 gene is a newly investigated gene of which the expression levels are associated with the disease prognosis in many types of cancer and especially breast cancer and that is known to be overexpressed usually through gene amplification and E2F/RB pathway activation. ATAD2 (ATPase family, AAA domain-containing 2) can be overexpressed due to amplification or other regulatory mechanisms in many cancers such as lung, breast, prostate and liver. The fact that ATAD2 has an AAA+ ATPase and bromodomain indicates that it may be a good target for anti-cancer therapy. However, it is necessary to clarify the role of the ATAD2 gene in tumorigenesis before strategies that target ATAD2 are developed. We evaluated a regulator that consistently shows high expression in breast cancer in this study. ATAD2 (ATPase family AAA domain-containing protein 2) is a gene that regulates important cellular activities such as cell proliferation and invasion. This study aimed to clarify the mechanism of action of ATAD2 in breast cancer. The ATAD2 expression of the MCF7 and T47D cell lines with high ATAD2 gene expression was silenced with siRNA and the expression levels of all genes were screened. Gene chip expression analyses revealed that the suppression of ATAD2 in breast cancer cells indicated a role in the regulation of microtubule organization, cell growth, cell adhesion and important signal pathways such as EGFR, FGFR, MAPK, and PI3K. Functional studies with breast cancer cells have
iv
supported the gene expression analysis results. Our study revealed that silencing of ATAD2 lead to suppression of ER(-) breast cancer cell migration but not ER(+) cancer cell migration. The same experiments causes a marked decrease in the colony formation capacity and proliferation potential of HCC1937 cells while there was no change in SKBR3 and ER(+) cells. ATAD2 silencing also lead to a senescence response in all breast cancer cells.
We investigated the molecular mechanisms of action of ATAD2 to determine the factors
underlying the biological effect. The MCF7 and HCC1937 cells were used to clarify its action on the main cellular signal pathways. We found that ATAD2 silencing induced an apoptosis
response in both cell types. Intrinsic pathways are activated with caspase-9 cleavage in MCF7 cells while high Bcl2 and BclXL expression prevents caspase-9 cleavage in HCC1937 cells.
Decreased ATAD2 did not cause a difference in the p53 protein level in either cells but while p21 expression was increased in just MCF7 cells, RB phosphorylation was inhibited in both cell lines. The results indicate that dysregulation of proteins involved in intracellular control pathways triggers the senescence mechanism.
ERα gene expression has been shown to be suppressed as a result of siRNA suppression of ATAD2 gene expression in MCF7 cells. This result indicates that ATAD2 has a role in ERα regulation. ATAD2 gene expression has been found to decrease following Gefitinib suppression of EGFR signaling while EGF treatment of serum-starved MCF7 cells caused increased ATAD2 gene expression. These results indicate that EGFR could be a possible upstream activator of ATAD2. This gene expression pattern also points towards a positive feedback mechanism between ATAD2+ERα and EGFR.
Although it is known that EGFR is frequently overexpressed in breast cancer and cross-talk with the estrogen receptor, we do not have detailed information on the mechanism of their
interactions. ‘Pathway Enrichment’ analysis of microarray studies have revealed EGFR signaling as one of pathways enriched in the genes downregulated with decreased ATAD2 expression. The silencing of ATAD2 and ERα together prevents EGFR expression in MCF7 cells while silencing of ATAD2 by itself in HCC1937 cells does not cause a change in EGFR expression but prevents its phosphorylation in the Tyr1173 region of the receptor. The ATAD2-suppressed EGFR activity in HCC1937 cells did not lead any change in the Akt level or MEK/ERK activity. The down-stream signaling pathway analysis of the EGFR has revealed that Akt protein
v
expression is suppressed when ATAD2 is silenced in MCF7 cells. The increase in the MEK/ERK signaling activity with decreased ERα expression in the same cells was suppressed with
decreased ATAD2 expression.
In conclusion, the high expression of the ATAD2 gene in breast cancer stimulates growth of cancer cells while its interaction with the EGFR signaling pathway could be one of the causes of the pro-oncogenic effects of the gene. Its suppression together with EGFR could provide an option for new therapeutic applications in breast cancer studies.
vi
ÖZET
ATAD2 GEN İFADESİNİN MEME KANSERİNDE
İŞLEVSEL ETKİLERİ
Buse Nurten Özel
Moleküler Biyoloji ve Genetik, Yüksek lisans Tez Danışmanı: Işık Yuluğ
Ağustos 2016
ATAD2 geni, meme kanseri başta olmak üzere bir çok kanser türünde, çoğunlukla gen
amplifikasyonu ve E2F/Rb yolağı aktivasyonu ile aşırı ifade gösterdiği bilinen ve ifade seviyeleri hastalığın prognozu ile ilişkili olan, henüz yeni araştırılan bir gendir. ATAD2 (ATPaz ailesi, AAA domain içeren 2) akciğer, meme, prostat ve karaciğer gibi bir çok kanserde amplifikasyon veya diğer düzenleyici mekanizmalar nedeniyle fazlaca ifade edilmektedir. ATAD2’nin AAA+ ATPaz ve bromodomain’inin olması iyi bir anti-kanser ilaç hedefi olabileceğini
düşündürmektedir. Ancak ATAD2’yi hedef alan stratejiler geliştirilmeden önce ATAD2 geninin tümörigenezdeki rolü aydınlatılmalıdır. Bu çalışmada, meme kanserinde sürekli olarak yüksek ifade gösteren regülatörlerden biri araştırılmıştır. ATAD2 (ATPase family AAA domain-containing protein 2), hücre çoğalması ve invazyonu gibi önemli hücresel faaliyetlerin
düzenleyicisi olan bir gendir. Bu çalışma, ATAD2’nin meme kanserindeki çalışma prensibini aydınlatmayı hedeflemiştir. ATAD2 genini yüksek ifade eden hücre hatları MCF7 ve T47D’de ATAD2 ifadesi siRNA’lar ile susturularak Affymetrix mikroçipleri ile tüm genlerin ifade düzeyleri taranmıştır. Mikroçip gen ifade analizleri sonucu ATAD2’nin meme kanseri
vii
ve EGFR, FGFR, MAPK, PI3K gibi önemli sinyal yolakların düzenlenmesinde görev aldığını gösterilmiştir. Meme kanseri hücreleriyle yapılan işlevsel çalışmalar gen ifade analizi sonuçlarını desteklemektedir. Çalışmalarımız ATAD2’nin susturulması ile ER(-) meme kanseri hücrelerinin göçünü baskılanırken ER(+) kanser hücrelerinin göçünü etkilemediği gösterildi.. Aynı deneyler HCC1937 hücrelerinin koloni oluşturma kapasitelerini ve çoğalma potansiyellerini önemli ölçüde düşürürken, SKBR3 ve ER(+) hücrelerinde bir değişim gözlenmedi. Ayrıca, ATAD2
susturulması, bütün meme kanseri hücrelerinde senesens yanıtına yol açmıştır.
Biyolojik etki mekanizmasının altında yatan sebepleri ortaya çıkarmak için ATAD2’nin moleküler çalışma prensibi araştırılmıştır. Temel hücresel sinyal yolakları üzerindeki etkisini aydınlatmak için MCF7 ve HCC1937 hücreleri kullanılmıştır. Buna göre, ATAD2’nin
susturulması her iki hücre tipinde de apoptozis cevabı indüklemiştir. MCF7 hücrelerinde, caspaz-9 yıkımı ile intrinsik yolaklar aktifleştirilirken, HCC1caspaz-937 hücrelerinde yüksek Bcl2 and BclXL
ifadesi caspaz-9 yıkımını engellemiştir. ATAD2’in düşüşü her iki hücrede de, p53 protein seviyesinde bir farklılığa yol açmadı ama sadece MCF7 hücrelerinde p21’in ifadesinde bir artış gözlenirken, RB fosforilasyonu her iki hücrede de engellendi. Sonuçlar gösteriyor ki hücre içi kontrol yolaklarında görev alan proteinlerin regülasyonunun bozulması senesens mekanizmasını tetikledi.
MCF7 hücrelerinde ATAD2 gen ifadesinin siRNA ile baskılanması sonucu ERα gen ifadesinin de baskılandığı gösterilmiştir. Bu sonuç, ATAD2’nin, ERα regülasyonunda görev aldığını işaret etmektedir. EGFR aktivitesinin Gefitinib ile baskılanması sonucu ATAD2 gen ifadesinin azaldığı ve ayrıca serum açlığındaki MCF7 hücrelerinin EGF ile muamelesi sonucu ATAD2 gen
ifadesinin arttığı gözlenmiştir. Bu sonuçlar EGF sinyal yolağının ATAD2’nin akış üstü aktivatörü olabileceğini düşündürmektedir. Bu gen ifade paterni ATAD2+ERα ve EGFR arasında pozitif bir geri-bildirim ağı olduğunu işaret etmektedir.
EGFR’ın meme kanserinde sıklıkla yüksek ifade edildiği ve östrojen reseptörü ile etkileşim halinde olduğu bilinmekle beraber etkileşim mekanizmasına dair detaylı bir bilgi
bulunmamaktadır. Mikroçip deney sonuçlarının ‘Pathway Enrichment’ analizi sonucu ATAD2 ifadesindeki azalma ile EGFR sinyal yolağında görev alan genlerin ifadesinde düşüş olduğu gözlenmiştir.
viii
ATAD2 ve ERα’ nın birlikte susturulmasının MCF7 hücrelerinde EGFR ifadesini engellerken, ATAD2’ nin HCC1937 hücrelerinde tek başına susturulması EGFR ifadesinde bir değişime yol açmadığı ancak reseptörün Tyr1173 bölgesindeki fosforilasyonunun engellendiği gösterilmiştir. HCC1937 hücrelerinde ATAD2 tarafından baskılanan EGFR aktivitesi, ne Akt seviyesinde ne de MEK/ERK aktivitesinde bir değişime yol açmıştır. EGFR reseptörünün akış aşağı sinyal
yolaklarının analizi sonucu, MCF7 hücrelerinde ATAD2’nin susturulması ile Akt protein ifadesinin bastırıldığı gözlemlenmiştir. Aynı hücrelerde, ERα ifadesinin düşüşüyle görülen MEK/ERK sinyal yolağı aktivitesindeki artış ATAD2 gen ifadesinin düşüşü ile baskılanmıştır. Kısaca, ATAD2 geninin meme kanserindeki yüksek ifadesi, kanser hücrelerinin büyümesini sağlarken, EGFR sinyal yolağı ile olan etkileşimi genin pro-onkojenik etkilerinin altında yatan sebeplerden biri olabilir. ATAD2'nin EGFR ile birlikte baskılanması meme kanseri çalışmalarına yeni bir tedaviye yönelik seçenek olabilir.
ix
x
ACKNOWLEDGEMENTS
Master was the biggest challenge of my life so far. I had up and downs throughout my graduate education. However, I believe all difficulties I faced during this time made me a more patient, foreseeing and strong person. It taught me that you cannot get everything you want and should do your best with what you have, but it doesn’t mean you stop trying and accept your fate; on the contrary, I have realized what one can achieve just with a little self-confidence and with hard working. It helped me to explore myself.
I am very grateful to Assoc. Prof. Dr. Işık Yuluğ for giving me this opportunity. My graduate journey has started when she accepted me to her lab as a master student in 2013. From the first day, she has been always very protective towards me. I am very thankful her for believing and encouraging me even when I had rough times in my personal life or at work. I appreciate her never ending support and thank again for allowing me study independently and creating a comfortable working environment during this time.
I am very thankful to Assoc. Prof. Dr. Ali Osmay Güre and Assist. Prof. Dr. Bala Gür Dedeoğlu for accepting to be in my jury committee and sharing their invaluable ideas and recommendations on my thesis.
I would like to express my gratitude to Gurbet Karahan and Nilüfer Sayar who were two of the past members of Yuluğ group. I feel so lucky to know them. They were so protective of me and I appreciate their caring and guiding. They were like sister to me. The provided a peaceful and comfortable atmosphere in the lab, enabling me to gain confidence at the beginning of my master. They patiently taught me everything about the lab and shared their work experiences generously. Gurbet was like a mentor for me. I cannot express how grateful I am for her precious support and trust. I thank both of them for their friendships and invaluable advices.
I would like to express my special thanks to Seçil Demirkol, Özge Saatçi and Şahika Cıngır Köker. They were always with me whenever I need them. They are more than a friend for me. Meaning of their support and love cannot be expressed with words. Their presence in my life
xi
made me survive all the difficulties, disappointments and frustrations during this period. I am very lucky to have such a great friends.
I thank all MBG members. I am very happy to be a part of this family and feel pleased to know everyone here, with special thanks to Özlen Konu, Özgür Şahin, İhsan Dereli, Ayşe Sedef Köseer, Nazlı Değer, Deniz Cansen Yıldırım, Tamer Kahraman, Emre Yurdusev, Dilan Çelebi Birand, Erol Eyüpoğlu, Barış Küçükkaraduman, Alper Poyraz, Seniye Targen, Bircan Çoban, Başak Özgür, Özlem Tufanlı, Özlem Mutlu, İmran Akdemir, Merve Aydın, Alican Savaş; and Füsun Elvan, Bilge Kılıç, Pelin Makas, Yıldız Karabacak.
Last but not least, I feel deeply gratitude to my family, especially my mother. She was like a life-vest to me during my thesis period. Her unconditional love, endless support and her guidance and patience was the key factor that made me get through even the hardest times. She has been life-coaching me ever since I could remember. Without her helps, I couldn’t achieve what I did so far in my life. Thank you mom, so glad I have you.
I thank Bilkent University for accepting me to graduate program.
I was supported by TÜBİTAK BİDEB 2210/E scholarship during my master education and this project was supported by TÜBİTAK 1001 grant.
xii
TABLE OF CONTENTS
ABSTRACT ... iii
ÖZET ... vi
ACKNOWLEDGEMENTS ... x
TABLE OF CONTENTS ...xii
LIST OF FIGURES ... xv
LIST OF TABLES ... xvii
ABBREVIATIONS ... xviii
CHAPTER 1. INTRODUCTION ... 1
1.1 CANCER ... 1
1.2 BREAST CANCER ... 2
1.2.1 SUBTYPES OF BREAST CANCER ... 3
1.2.1.1 Histological Classification of Breast Cancer ... 3
1.2.1.2 Molecular Classification of Breast Cancer ... 4
1.2.2 SIGNALING PATHWAYS IN BREAST CANCER CELLS ... 5
1.2.2.1 Apoptosis Pathways ... 5
1.2.2.2 EGFR Signaling in Breast Cancer ... 7
1.3 ATAD2 AND CANCER ... 9
1.3.1 ACTIVATION OF ATAD2 GENE EXPRESSİON IN CANCER ... 9
1.3.2 THE FUNCTION AND REGULATION OF ATAD2 ACTIVITY IN CELLS ... 12
1.3.3 ONCOGENIC FUNCTION OF ATAD2 IN CANCER ... 14
1.3.4 THE ROLE OF ATAD2 IN ESTROGEN SIGNALING ... 17
1.4 CELLULAR SENESCENCE ... 19
1.4.1 CHARACTERISTICS OF SENESCENT CELLS... 20
1.4.2 REASONS OF CELLULAR SENESCENCE ... 22
1.4.3 SENESCENCE PATHWAYS ... 23
1.5 AIM OF THE RESEARCH ... 25
CHAPTER 2. MATERIALS AND METHODS ... 26
2.1. MATERIALS ... 26
2.1.1. GENERAL LABORATORY MATERIALS ... 26
xiii
2.1.1.2. Routinely used solutions ... 28
2.1.1.3. Kits ... 30
2.1.1.4. Primers ... 31
2.1.1.5. Antibodies ... 32
2.1.1.6. Equipments ... 34
2.1.2. CELL CULTURE MATERIALS ... 34
2.1.2.1. Cell culture reagents ... 35
2.1.2.2. Cell lines and Media ... 36
2.1.2.3. Nucleic acids ... 37
2.2. METHODS ... 38
2.2.1. LABORATORY TECHNIQUES ... 38
2.2.1.1. RNA isolation from cell pellets and its quality/quantity determination ... 38
2.2.1.2. Complementary DNA (cDNA) preparation from isolated total RNA samples ... 38
2.2.1.3. Polymerase chain reaction (PCR) ... 39
2.2.1.4. Quantitative reverse transcription PCR (RT-qPCR)... 39
2.2.1.5. Total protein isolation from cell pellets ... 39
2.2.1.6. Determination of total protein concentrations ... 40
2.2.1.7. Western blot ... 40
2.2.1.8. Transformation of pSUPER.retro vector into competent DH5α cells ... 41
2.2.1.9. Isolation of amplified plasmids from transforments ... 42
2.2.2. CELL CULTURE TECHNIQUES ... 42
2.2.2.1. Culture conditions and maintenance of cultured cell lines ... 42
2.2.2.2. Transient transfection ... 43
2.2.2.3. Stable transfection ... 43
2.2.2.4. 2D colony formation assay ... 44
2.2.2.5. In vitro scratch assay ... 45
2.2.2.6. Senescence-associated β-galactosidase (SA-β-Gal) staining ... 45
2.2.2.7. Serum starvation studies ... 46
2.2.2.8. Gefitinib treatment and MTT assay ... 46
2.2.2.9. Epidermal growth factor (EGF) treatment ... 47
2.2.2.10. FACS analysis ... 47
2.2.2.11. BrDU-7AAD cell cycle assay ... 48
xiv
2.2.2.13. Microarray data analysis ... 49
CHAPTER 3. RESULTS ... 50
3.1 ANALYSIS OF INDEPENDENT MICROARRAY DATASETS ... 51
3.1.1 GENE EXPRESSION PROFILES OF TREATED BREAST CANCER CELLS ... 55
3.1.1.1 Altered gene expression by ATAD2 downregulation in MCF7 and T47D cells ... 55
3.1.1.2. Functional annotation of common genes altered by ATAD2 downregulation ... 58
3.1.2 DETERMINATION OF DIFFERENTIALLY EXPRESSED GENES (DEGs) ... 61
3.1.3. PATHWAY ENRICHMENT ANALYSIS OF DEGs ... 62
3.2. VALIDATION OF FUNCTIONAL SIGNIFICANCE OF ATAD2 GENE IN BREAST CANCER ... 64
3.2.1. EXPRESSION ANALYSIS OF ATAD2 GENE IN BREAST CELL LINES ... 64
3.2.2. EFFECT OF SERUM STARVATION ON ATAD2 EXPRESSION IN BREAST CARCINOMA CELLS .... 67
3.2.3. ANALYSIS OF CELLULAR PROCESSES IN ATAD2 SILENCED BREAST CANCER CELL LINES ... 70
3.2.2.1 Analysis of cell migration in ATAD2 suppressed breast carcinoma cells ... 74
3.2.2.2 Analysis of colony formation in ATAD2 suppressed breast carcinoma cells ... 79
3.2.2.3 Analysis of senescence response in ATAD2 suppressed breast carcinoma cells ... 84
3.2.2.4 Analysis of cell growth in ATAD2 suppressed breast carcinoma cells ... 89
3.3. VALIDATION OF UNDERLYING MOLECULAR FUNCTION OF ATAD2 GENE IN BREAST CANCER .... 94
3.3.1. ASSESSMENT OF ATAD2 FUNCTIONS IN BREAST CARCINOMA ... 94
3.3.1.1. Validation of the selected genes by RT-qPCR in treated cells ... 99
3.3.1.2. Effect of ATAD2 depletion on the regulation of apoptosis ... 104
3.3.1.3. Effect of ATAD2 depletion on EGFR signaling ... 107
3.3.2. ASSOCIATION OF ATAD2 GENE WITH EGFR SIGNALING IN MCF7 CELLS ... 112
3.3.2.1. Effect of Epidermal Growth Factor (EGF) stimulation on ATAD2 expression... 114
3.3.2.2. Inhibitory effect of Gefitinib treatment on ATAD2 expression ... 116
CHAPTER 4. DISCUSSION ... 118
CHAPTER 5. FUTURE PERSPECTIVES ... 133
REFERENCES ... 135
APPENDICES ... 153
Appendix A- Gene lists ... 153
xv
LIST OF FIGURES
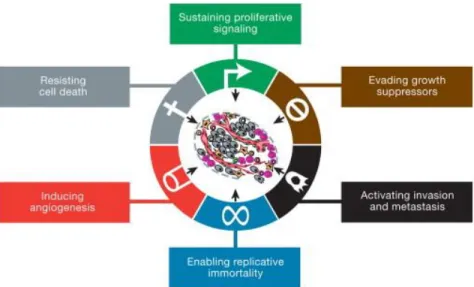
FIGURE 1.1:THE HALLMARKS OF CANCER:SIX CAPABILITIES OF CANCER CELLS ACQUIRED DURING TUMORIGENESIS .. 2
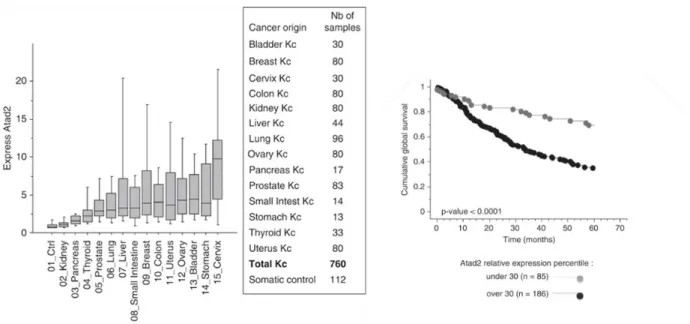
FIGURE 1.2:LEFT GRAPH:ATAD2 EXPRESSION LEVELS ACROSS VARIOUS CANCER TYPES RIGHT GRAPH:KAPLAN-MEIER GRAPH OF CUMULATIVE GLOBAL SURVIVAL OF LUNG CANCER PATIENTS ACCORDING TO THEIR ATAD2 EXPRESSION LEVELS. ... 12
FIGURE 1.3:THE GRAPHICAL REPRESENTATION OF DOMAINS ON ATAD2 PROTEIN WITH HUMAN PROTEIN REFERENCE DATABASE (HPRD). ... 14
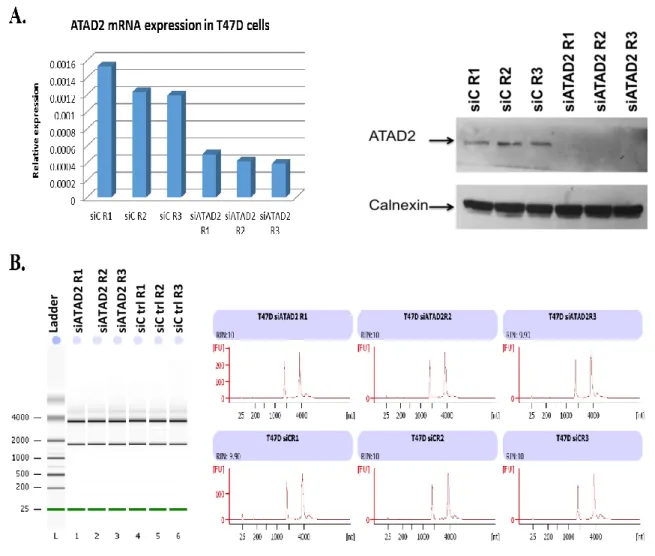
FIGURE 3.1:VALIDATION OF EFFECTIVENESS OF SIATAD2 TREATMENT AND DETERMINATION OF INITIAL TOTAL RNA QUALITY BY AGILENT 2100BIOANALYZER BEFORE THE MICROARRAY EXPERIMENTS IN T47D CELLS. ... 52
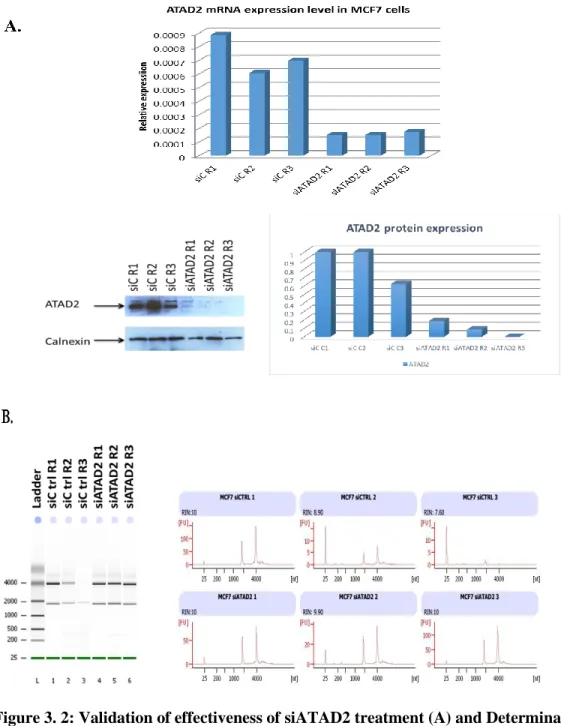
FIGURE 3.2:VALIDATION OF EFFECTIVENESS OF SIATAD2 TREATMENT (A) AND DETERMINATION OF INITIAL TOTAL RNA QUALITY BY AGILENT 2100BIOANALYZER (B) BEFORE THE MICROARRAY EXPERIMENTS IN MCF7 CELLS. ... 53
FIGURE 3.3:QUALITY CONTROL ANALYSIS OF THE PROCESSED RNAS USED FOR MICROARRAY EXPERIMENTS. ... 54
FIGURE 3.4:2-D INTERACTIVE SCATTERPLOTS OF ACTIVATED (A-C) AND REPRESSED (B-D) GENES IN SIATAD2 TREATED MCF7 AND T47D CELLS. ... 56
FIGURE 3.5:EXPRESSION PROFILES OF ATAD2 AND ERΑ IN BREAST CARCINOMA AND NON-CARCINOMA CELL LINES.65 FIGURE 3.6:VALIDATION OF PROTEIN EXPRESSION LEVELS OF ATAD2 AND ERΑ IN BREAST CARCINOMA AND NON -CARCINOMA CELL LINES. ... 66
FIGURE 3.7:DETERMINATION OF CELL VIABILITY AFTER 48 HOURS AND 7 DAYS SERUM STARVATION. ... 68
FIGURE 3.8:VALIDATION OF ATAD2 EXPRESSION IN STABLY-TRANSFECTED T47D CELLS. ... 71
FIGURE 3.9:VALIDATION OF ATAD2 EXPRESSION IN STABLY-TRANSFECTED MCF7 CELLS. ... 72
FIGURE 3.10:VALIDATION OF ATAD2 EXPRESSION IN SIATA2 TREATED ER(-) CELLS. ... 73
FIGURE 3.11:THE EFFECT OF ATAD2 DOWN-REGULATION ON MIGRATION OF BREAST CARCINOMA CELLS. ... 75
FIGURE 3.12:THE EFFECT OF ATAD2 DOWN-REGULATION ON COLONY FORMATION OF BREAST CARCINOMA CELLS.83 FIGURE 3.13:THE EFFECT OF ATAD2 DOWN-REGULATION ON SENESCENCE RESPONSE OF BREAST CARCINOMA CELLS. ... 88
FIGURE 3.14:QUANTITATIVE CELL CYCLE ANALYSIS OF 7-AAD AND BRDU STAINED ATAD2 DOWNREGULATED BREAST CARCINOMA CELLS. ... 90
FIGURE 3.15:QUANTITATIVE CELL CYCLE ANALYSIS USING FLOW CYTOMETRY IN ATAD2 DOWNREGULATED BREAST CARCINOMA CELLS. ... 93
xvi
FIGURE 3.16:DETERMINATION OF AN EFFECTIVE PSR-ERΑ KNOCKDOWN CONSTRUCT FOR TRANSIENT-TRANSFECTION
EXPERIMENTS IN MCF7 CELLS. ... 96
FIGURE 3.17:CO-SUPPRESSION OF ATAD2 AND ERΑ EXPRESSION IN MCF7 CELLS. ... 97
FIGURE 3.18:DOWNREGULATION OF ERΑ IN MCF7 CELLS. ... 98
FIGURE 3.19:VALIDATION OF ATAD2 EXPRESSION IN STABLY-TRANSFECTED HCC1937 CELLS. ... 100
FIGURE 3.20:RT-QPCR ANALYSIS OF SELECTED GENES IN SIATAD2(25NM) OR/AND SHERΑ-499(2UG) TREATED MCF7 CELLS. ... 102
FIGURE 3.21:RT-QPCR ANALYSIS OF SELECTED GENES IN HCC1937 SHATAD2_1_C1 CLONE. ... 103
FIGURE 3.22:EFFECT OF ATAD2 OR/AND ERΑ KNOCKDOWN ON THE EXPRESSION OF APOPTOTIC PROTEINS IN MCF7 CELLS. ... 105
FIGURE 3.23:EFFECT OF ATAD2 KNOCKDOWN ON THE EXPRESSION OF PRO-APOPTOTIC AND ANTI-APOPTOTIC PROTEINS IN ATAD2 DOWN-REGULATED HCC1937 CELLS. ... 106
FIGURE 3.24:EFFECT OF ATAD2 OR/AND ERΑ KNOCKDOWN ON THE EXPRESSION AND ON THE ACTIVITY OF EGFR AND EGFR STIMULATED SIGNALING PROTEINS IN MCF7 CELLS. ... 108
FIGURE 3.25:EFFECT OF ATAD2 KNOCKDOWN ON THE EXPRESSION OF EMT MARKERS IN ATAD2 DOWN-REGULATED HCC1937 CELLS. ... 110
FIGURE 3.26:EFFECT OF ATAD2 KNOCKDOWN ON THE EXPRESSION AND THE ACTIVITY OF EGFR AND EGFR STIMULATED SIGNALING PROTEINS IN ATAD2 DOWN-REGULATED HCC1937 CELLS. ... 111
FIGURE 3.27:RT-QPCR ANALYSIS OF ATAD2,ESR1 AND EGFR IN TRANSFECTED MCF7 CELLS. ... 113
FIGURE 3.28:RT-QPCR ANALYSIS OF ATAD2,ESR1 AND EGFR IN EPIDERMAL GROWTH FACTOR (EGF)-STIMULATED MCF7 CELLS. ... 115 FIGURE 3.29:EFFECT OF DIFFERENT DOSES OF GEFITINIB ON ATAD2,ESR1 AND EGFR EXPRESSION IN MCF7 CELLS117
xvii
LIST OF TABLES
TABLE 1.1:MOLECULAR CLASSIFICATION SUBTYPES OF BREAST CANCER ... 8
TABLE 2.1:THE LIST OF CHEMICALS, REAGENTS AND ENZYMES USED FOR GENERAL LABORATORY PROCESSES ... 26
TABLE 2.2:THE LIST OF ROUTINELY USED BUFFERS/SOLUTIONS ... 29
TABLE 2.3:THE LIST OF KITS USED IN LABORATORY PROCESSES. ... 31
TABLE 2.4:THE LIST OF PRIMERS USED IN THE STUDIES ... 31
TABLE 2.5:THE LIST OF ANTIBODIES USED IN THE STUDIES ... 32
TABLE 2.6:THE LIST OF EQUIPMENT USED IN THE STUDIES ... 34
TABLE 2.7:THE LIST OF CHEMICALS, REAGENTS AND KITS USED DURING CELL CULTURE STUDIES ... 35
TABLE 2.8:THE LIST OF CELLS LINES AND THEIR RESPECTIVE GROWTH MEDIA USED FOR OUR STUDIES ... 36
TABLE 2.9:THE LIST OF VECTORS AND SIRNA OLIGOS USED IN TRANSFECTION STUDIES ... 37
TABLE 3.1PROBE NUMBERS WITH 2 OR MORE FOLD CHANGE (P<0.05) ... 55
TABLE 3.2:THE FIRST 25 PROBES THAT WERE SIGNIFICANTLY CHANGED IN BOTH MCF7 AND T47D CELLS (P<0.05) ... 56
TABLE 3.3:FUNCTIONAL CLUSTERING OF COMMON UPREGULATED GENES IN MCF7 AND T47 CELLS UPON ATAD2 DOWNREGULATION ... 59
TABLE 3.4:FUNCTIONAL CLUSTERING OF COMMON DOWNREGULATED GENES IN MCF7 AND T47 CELLS UPON ATAD2 DOWNREGULATION ... 60
TABLE 3.5:THE LIST OF ENRICHED GENES PASSED THROUGH FILTERING (FDR<0.05;EASE<0.1) ... 61
TABLE 3.6:TOP 50 SIGNIFICANTLY (P<0.05) ENRICHED PATHWAYS OF ERΑ RESPONSIVE GENES DOWNREGULATED UPON ATAD2 SILENCING ... 63
TABLE 3.7:QUANTIFICATION OF ATAD2 PROTEIN IN THE CELLS FOLLOWING 48 HOURS OF SERUM STARVATION; MEASURED BY AVERAGE READINGS OF FLUORESCENT LABELLED ANTIBODIES. ... 68
TABLE 3.8:CELL CYCLE ANALYSIS OF CELLS FOLLOWING 48 HOURS OF SERUM STARVATION ... 69
TABLE 3.9:THE REPRESENTATIVE OF AVERAGE PERCENT OF CELL POPULATIONS IN CELL CYCLE PHASES DETERMINED WITH BRDU ASSAY.THE EXPERIMENTS WERE CARRIED OUT IN TRIPLICATE. ... 90
xviii
ABBREVIATIONS
ATAD2/ANCCA/PRO2000: AAA+ nuclear coregulator cancer associated
BRD: Bromodomains LCIS: Lobular carcinoma in situ
CASP9: Caspase 9 IHC: Immunohistochemistry
CCND1: Cyclin D1 MDM2: Mouse double minute 2 homolog CCNE1: Cyclin E1 MAPK: Mitogen-activated protein kinases CDH1: Cadherin 1 PR: Progesterone receptor
CDK: Cyclin-dependent kinases RT: Room temperature
CDKN1: Cyclin-Dependent Kinase Inhibitor 1A, P21 pRB: Retinoblastoma protein
DEG: Differentially expressed genes RIN: RNA Integrity number
DSB : Double strand breaks TNBC: Triple-negative breast cancer DCIS: Ductal carcinoma in situ TP53: Tumor Protein P53 DMSO: Dimetil sülfoksit RB1: Retinoblastoma
EGFR: Epidermal growth factor receptor EMT: Epithelial-mesenchymal transition
ER: Estrogen receptor
ESR1: Estrogen receptor α gene
E2: Estradiol
FDR: False Discovery Rate GEO : Gene Expression Omnibus H3K36: Histone 3 lysine 36 HCC: Hepatocellular carcinoma
HPRD: Human protein reference database IC-NST: Invasive carcinoma of non-specific type IARC: International Agency for Research on Cancer LBC: Lobular breast carcinoma
SA-β-GAL: Senescence-associated beta-galactosidase MOMP: Mitochondrial outer membrane permeabilization
1
CHAPTER 1. INTRODUCTION
1.1 CANCER
Cancer is a generic disease that is not limited to any part of body. It can originate in any type of cells. Cancer cells are transformed from normal cell. The accumulated epigenetic and molecular alterations within the cells drive abnormal cell development. They show uncontrolled growth and indefinite proliferation capacities1. It is a disease that has existed in human history from the
beginning. However its recognition dates back to Greek physician Hippocrates time. He first used the carcinos and carcinoma terms to describe different tumor forms. The next contribution was by Roman physician Celsus with his translation of the original term to the Latin word, “cancer”2.
This terminology has been kept up-to-date. Today the name “cancer” bore the burden of 8.2 million deaths worldwide just in 2012. It is the leading cause of death. The statistical trends estimate 22 million new cancer cases within the next two decades3. We have been in a war against this affliction for over the quarter of century. We have witnessed many major discoveries during these years. They have revealed the key hallmarks of cancer cells. These cells' complexity has been the real challenge for disease management It is not a straightforward process, as
evidence indicates it is a multistep process4. The studies have revealed six biological abilities acquired by cancer cells during their development period5. Cancer cells are defective structures; however their abnormalities create a system in their complexity. Six hallmarks of cancer have been listed in figure 1.1. They are common for all cancer types, so in fact these acquired capabilities are the references to define cancer.
2
Figure 1. 1: The hallmarks of cancer: Six capabilities of cancer cells acquired during tumorigenesis
1.2 BREAST CANCER
Cancer has been categorized into subtypes to make it easier to manage. The age, sex, genetic background, environmental factors affect the tendency of a person to develop a specific cancer subtype. World cancer statistics revealed the most common cancers for each gender in the 2012 report. Accordingly, breast and prostate cancers are the most common types in females and males, respectively. While lung cancer appears to be most prevalent cancer worldwide in men, breast cancer is the leading cancer worldwide in women corresponding to more than 25% of new cases diagnosed in 20126.
As the CDC (Centers for Disease Control and Prevention) report suggests, breast cancer is the major cause of cancer mortality for women worldwide7. Breast cancer is the malignant tumor that develops from breast tissue. It originates from the epithelial or stromal component of the normal mammary gland. The gland consist of ducts and lobes. They are structurally embedded in the stroma. The main function of breast tissue is milk production and its storage8,9 A normal breast is made up of 15-20 lobes. Lobes are formed of grouped lobules which are milk producing glands. They are connected by milk ducts. Stroma, composed of fatty and connective tissue, envelopes and protects the lobes, blood and lymphatic vessels and supports breast tissue as a whole10.
3
connected to lymph nodes located around the breast drain off lymph fluid from the tissue11.
During puberty, breast tissue responds to hormonal changes and begins to develop. Estrogen and progesterone hormones stimulate mammary gland growth. The secretion of prolactin and
somatotropin from the pituitary gland is involved in the regulation of breast development. The stimulation increases the branching of the duct system and the mass of glandular tissue during puberty12. Deregulated hormone stimulation is the driving force of breast cancer development
13-15. It is a heterogeneous disease with a variety of subtypes16-19. To improve the diagnosis and
prognosis of breast cancer, there are a few classification systems depending on the histological, molecular and functional characteristics of breast cancer cells9,20,21.
1.2.1 SUBTYPES OF BREAST CANCER
1.2.1.1 Histological Classification of Breast Cancer
Histological classification refers to the grading of tumor growth pattern22. Breast cancer is
predominantly classified into two histological subtypes which are in situ carcinoma and invasive carcinoma. They are further sub-classified into either ductal or lobular carcinomas20,23.
Carcinoma in Situ refers to the limited malignant development of breast tissue in ducts and lobules by basement membrane. It is further divided into Ductal carcinoma in situ (DCIS) and
lobular carcinoma in situ (LCIS). DCIS is the most common non-invasive breast cancer subtype.
It is further classified into five subtypes which are comedo carcinoma, solid, cripriform,
papillary and micro papillary23,24. The major risk factors of recurrence in DCIS are defined as
grade, size and margins. The death risk is lower than 2% among patients diagnosed with DCIS25.
LCIS is generally observed in women aged between 40 and 50 years. It often cannot be detected
by mammography. The patients diagnosed with LCIS have a 30-40 % of developing invasive carcinoma26,27. Invasive breast carcinoma is also differentiated into further subtypes. IC-NST is the most common subtype of carcinoma contributing to 70-80% of patients diagnosed with invasive carcinoma28. Irregular and enlarged nuclei which are the characteristics of poorly differentiated tumors, can be observed in IC-NST. These tumors are defective in terms of tubule formation 29. The last group of histologic classification is metaplastic carcinoma. This class is rarely observed among breast cancer patients. It comprises of less than 1 % of all cases. They are
4
divided into matrix producing carcinomas, squamous cell carcinomas and carcinomas with
prominent spindle cell components. The prognosis of this subtype is poor30,31.
1.2.1.2 Molecular Classification of Breast Cancer
The heterogeneous nature of cancer has created the need of alternative classifications of breast cancer. The discovery of the century, microarray technology, has made the molecular
categorization of breast cancer possible. The microarray technique has enabled the identification of the molecular basis of cancer heterogeneity32-35. High throughput gene expression analysis has sub-classified breast cancer into five categories9,17,22. They offer well-defined diagnostic and therapeutic tools since they are based on the intrinsic changes in cancer cells. Table 1.1
summarizes the molecular subtype signatures of breast cancer36. The current model determines the classifications of cancer cells according to their cell specific markers such as hormone receptors, growth factor receptors, cell proliferation markers, over-activated signaling pathways, cell cycle related factors, metastasis related markers. The spectrum may be extended with addition of microenvironment factors or the expression of non-coding RNAs17,37-40. The
established categories today are luminal A and B, HER2 positive, Basal-like and normal breast-like classes40,41.
Luminal types are recognized by the expression of ER, PR, Bcl-2, CK8/18+ are molecular signatures. Luminal type cells show good differentiation and good prognosis unlike the other three subtypes due to their ER- feature. CK8/18 is a luminal type specific epithelial marker17,39. Further microarray analysis have revealed differences in gene expression pattern of two luminal types. Luminal B subtypes express HER2 receptor unlike luminal A, so type B may cause worse prognosis in breast cancer38. The molecular background of cancer cells affect the overall survival predictions. The breast cancer statistics indicate patients with basal-like subtype have the shortest disease-free survival. Together luminal types are make up 65-70% of all breast cancer
cases35,42,43. Luminal subtype cells are all ER+, so considering the frequency of luminal type diagnosis among of breast cancer patients, estrogen receptor status becomes the most distinctive marker in breast cancer43. Therefore, the regulation and functions of ER is one of most attractive topics of breast cancer researches. It is also the most studied target in drug development. In fact two inhibitory drugs, tamoxifen and fulvestran, have been developed to prevent its action in
5
estrogen responsive breast cancer cells. However, almost 30% of patients are reported to resist hormone therapies in long term44-46. Therefore, additional molecular signatures are required to
develop more optimal treatment strategies in breast cancer.
1.2.2 SIGNALING PATHWAYS IN BREAST CANCER CELLS
In addition to the efforts to classify breast cancer cells, signaling pathways over stimulated or suppressed in cancer cells have been investigated. Depending on the activated signaling
networks, cancer cells acquire distinct capabilities47-49. The hallmarks of cancer (figure 1.1) imply that cancer cells activate the signaling molecules involved in proliferation, cell growth, cell motility, anti-cell death, genomic instability, angiogenesis. Cancer is a gradual process resulting from the disruption of pathway regulation1,5. Cross-communication of pathways allow cells to create a favorable environment for proliferation. Not only they can stimulate their
self-proliferation, but they make neighbor cells to secrete favorable factors for their growth50,51.
1.2.2.1 Apoptosis Pathways
Apoptosis is a tightly regulated cell death program. It is a critical process to eliminate unwanted cells from the population. For the integrity of the organism, apoptotic signaling should be
regulated strictly to maintain the balance between survival and death52-54. Apoptotic pathways are frequently dysregulated in cancer and this protects cancer cells from death signals. It can be initiated by intrinsic or extrinsic signals5,55,56.
Intrinsic pathway can be activated by cellular stress, UV radiation, heat, viral infection, serum deprivation, DNA damage57,58. This internal changes have been recognized by intracellular molecules which are the signal messengers for the induction of mitochondrial outer membrane permeabilization (MOMP). The molecules responsible for the regulation of MOMPS are BCL-2 family proteins. Their activities decide the intrinsic apoptotic fate. BCL2 family has both pro- and anti-apoptotic proteins. Pro-apoptotic proteins include bax, bak, bid, bik, bad, DIVA and bok proteins while anti-apoptotic proteins include bcl2, bcl-xl, mcl1, bcl-w and bcl-b. This family additionally contains BH3-only proteins, a subgroup of pro-apoptotic proteins which are bim,
6
tbid (truncated form) and PUMA. Structural analysis has revealed the possible protein-protein interactions between BCL2 family proteins. The sub cellular localization of proteins varies in the cells. BAX proteins are predominantly localized in the cytosolic part of mitochondria while BAK is an inner membrane protein of mitochondria. The subcellular localization of these proteins is important for the maintenance of cellular integrity in the absence of a death signal because the changes in their location may initiate an apoptotic response. Intrinsic apoptotic pathway is also known as mitochondrial apoptosis because the factors initiating the process are released from apoptosis. The intrinsic signals relayed by intracellular censor molecules induce BH3-only proteins. They in turn activate BAX proteins.Following death stimuli, BAX
translocate to inner compartment of mitochondria. BAK proteins also translocate into the inner mitochondrial membrane upon a death signal as with BAX. There they become integral
membrane proteins and show conformational change and form homodimers within the
membrane. Homo-oligomerization induces MOMP. However there are two activation models of BAX/BAK proteins. The indirect model suggests that BCL2 proteins bind to BAX/BAK proteins physically and maintain their inactive state. Activated “sensitizer” BH3-only proteins bind to BCL2 proteins and this allows the release of BAX/BAK proteins for mitochondrial translocation and MOMP induction. According to the direct activation model, activated “activator” BH3-only proteins can directly bind to BAX/BAK proteins and activate them. As highlighted, there are two types of BH3-only proteins which can be classified as sensitizers and activators. Sensitizers are unable to interact with BAX/BAD proteins, so only activate them by binding to BCL2, while activators directly interact with BAX/BAD proteins. Studies have demonstrated direct
interactions of tBid (activator BH3-only protein) with BAX on/in membrane and confirmed “ tBid induced BAX mediated MOMP activation “. Studies have also revealed the presence of BCL2 or BCLXL, anti-apoptotic proteins, inhibited the activation of BAX even in the presence of a death signal. MOMP induction results in the release of cytochrome c and apoptotic factors from mitochondria to cytoplasm. Its release induces its oligomerization with Apaf-1 and caspase 9 which in turn results in the activation of caspase 9. The activation of caspase 9 results in the cleavage of its downstream caspases-3 and -7 and their subsequent activation54,59-67.
The extrinsic pathway is initiated by the stimulation of death receptors such as TNFR1, FAS, TRAIL1 and TRAIL2. Upon stimulation, death receptor oligomerization recruits adaptor proteins, such as FADD or TNFR1-associated death domain protein, to the receptor domain.
7
These adaptor proteins activate caspase-8. Its activation induces the cleavage of its downstream caspases which are caspase-3,-6,-7. Caspases -8 and-9 are called initiator caspases while caspases-3,-6,-7 are executioner caspases. The activation of downstream executioner caspases may be insufficient to exert an apoptotic response by death receptor signaling. That is why the extrinsic apoptotic pathway requires the activation of the intrinsic pathway as well in some cases. The extrinsic pathway induces MOMP with Bid activation by caspase-8. Then tBid translocates to the mitochondria and induces the release of apoptotic factors into cytoplasm. These factors in turn activate both caspase-3 and-8, so enable an appositive feedback loop which enhances apoptotic response54,68-74.
1.2.2.2 EGFR Signaling in Breast Cancer
EGFR is one of the cell-surface receptors of cells. Its overexpression is associated with poor differentiation of cells in breast cancer75-77. It is frequently observed in triple negative breast cancer subtypes, so it suggests it may stimulate the formation of aggressive breast cancer78-80. The receptor exerts its action with activation of the PI3K/Akt, Ras-Raf-MAPK, JNK pathways
81-84. The activation of signaling pathways shows differential biological effects depending on the
nature of the stimuli or which pathways are activated. The stimulation of the receptor is reported to induce cell proliferation, cell motility, metastasis, anti-apoptotic response and angiogenesis75,85
. The activation of EGFR in cell culture has promoted loss of cell polarization and epithelial features of cells86. The inter-EGFR family cross-talks have been often observed with HER2. The
co-expression of EGFR and HER2 is indicated to be inversely correlated with estrogen receptor expression. The heterodimer interaction of EGFR with HER2 increases invasive abilities of breast cancer cells87,88. The reports show that EGFR induces E-cadherin loss with the presence of
mesenchymal markers such as vimentin. That is one way to promote EMT
(epithelial-mesenchymal transition) in cancer cells. The inhibition of EGFR activity with erlotinib inhibitor has increased E-cadherin expression and inhibited cell motility in cancer cells. This supports the suggestions that EGFR may be involved in the EMT process89,90. EGFR is one of molecular markers for basal-like breast cancer subtype41. Studies have demonstrated that the inhibition of
Table 1. 1: Molecular classification subtypes of breast cancer36
9
EGFR signaling prevents the expression of RAS and MYC signatures in TNBC cells91. Its
involvement in important cellular functions made EGFR an attractive target for drug development. There have been a few quite effective inhibitors against its activity. Gefitinib is one of them. It was the first selective inhibitor for the receptor. It binds to ATP-binding site of enzyme and inhibit its kinase activity. This prevents its action in the RAS signaling cascade92-94.
1.3 ATAD2 AND CANCER
1.3.1 ACTIVATION OF ATAD2 GENE EXPRESSİON IN CANCER
Cancer is the black death of the 21st century. A total of 19.3 million new cancer cases has been estimated for 28 cancer types till 2025 in the GLOBOCAN 2012 report of
International Agency for Research on Cancer (IARC). According to the latest statistics on cancer incidence released by the World Health Organization, there have been 14 million new cases already worldwide in just 2012, 11.9 % of which were breast cancer6. The drastic increase in breast cancer incidence compared to previous reports are worrying and urge the scientific community to act to prevent and control breast cancer progression globally. Ineffective treatments have demonstrated the need for improvements in disease
management. Cancer researchers have been searching of new approaches to cancer studies to develop better treatment strategies. Massive efforts have been made for the extensive analysis of comparative gene expressions profiling of cancer cells. Gene expression profiling determines the genetic constitution of individual cells and reveals the expression pattern of each gene at transcriptional level in cell type- specific manner95-97. Sequencing or DNA microarray methods are high throughput techniques used to detect differential
expression of the genes that changes from cell to cell under varying conditions. They provide the characterization of thousands of gene expressions simultaneously. Genome-wide scale microarray analyses are quite useful to associate the biological relevance of altered gene expressions between cancer cells or between cancer cells and normal cells42,43,98,99. The progress in molecular biology has turned this technology into a tool
10
enabling disease classification, the characterization of mechanisms involved in disease progression, the identification of diagnostic biomarkers, and correlating marker expressions with disease responses. This approach has opened the door to a better understanding of the molecular pathogenesis of cancer and to develop more effective targeted therapies that enable more accurate disease management. Since the first publications in 1995, gene expression studies have revised the perspective on genetics over the last 20 years.
Following the introduction of cDNA hybridization technique by Schena et al. at that time, the first ever results on the application of microarray in expression-profiling has emerged in the next year with a study by the Stanford group100,101. Afterwards, research on comparative gene expression patterns has gained momentum and the field took another direction to seek cancer-associated specific gene markers; that is what is currently recognized as the best prognostic and predictive tool and as the basis of future optimized cancer therapies.
Nowadays the cDNA hybridization technique, known as microarray, has become a routine protocol in laboratories. Breast cancer studies have benefited from this scientific
development in the field. There are studies that have adapted a genome wide approach to identify gene signatures from breast cancer cells. Quite a few groups have identified genes responsive to drug treatments or involved in their resistance and have revealed expression signatures of patients treated with them102-105. Several studies showed the association of
expression patterns with deregulated signaling pathways and their oncogenic outcomes. These genes should be evaluated in the context of their-involved mechanisms and can be regarded as markers of specific cellular events in breast cancer such as hypoxia, p53, PTEN loss, wound healing response and epithelial-mesenchymal transitions106-110. A great number of prognostic gene-expression signatures of breast cancer have been identified in the
literature in recent years together with their relevant functions and clinical validations111-114. Ectopic activation of these genes may cause the loss of normal cell functionality and make them gain oncogenic activity. The activated genes in turn may initiate epigenetic mis-regulation of other silent genes and this goes on and on with activation of others. This dysregulation loop drives into a malignant state in the end. Even though we, to a great extent, have mastered the oncogenic functions of these genes, we are rarely aware of their normal physiological status and their potential to drive malignancy. We do not know in which step of malignant transformation they may take a role. One example of such genes is
11
ATAD2 which is also known as ANCCA and PRO2000. It was identified with microarray studies115. The first reports on this gene have dated back to early 2000s when it was
recognized as significant gene signature in breast cancer116. ATAD2 was identified as one of 70-gene signatures predicting the clinic outcome of distant metastasis in 2001 and also one of 76-gene signatures predicting the high risks of distant metastasis in primary tumors of 286 patients diagnosed with breast cancer in 200535,116. Its elevated expression level has been reported to be observed in more than 70 % of breast cancer patients117. Its high
expressions have been supported in multiple studies117-127. Among an independent cohort of 225 primary human breast tumors, Immunohistochemistry (IHC) results have demonstrated the overexpression of ATAD2 in 63% of estrogen positive cells, in 86% of estrogen
negative cells and in 88% of TNBC cells121. This result implies the correlation of high ATAD2 expression with all three types of breast cancer. However, its overexpression is not limited to breast cancer. Its high expression has been reported in prostate cancer, lung cancer, B-cell lymphoma and hepatocellular carcinoma (HCC)128-131. Figure 1.2 illustrates the expression levels of ATAD2 in various cancer types (GSE2109)118. It is expressed higher in almost all cancer types compared to their corresponding normal cells. The kaplan-Meier graph demonstrates that its high expression is correlated with poor prognosis of lung cancer118. The studies support the strong association of prostate cancer progression and
ATAD2 expression. Then, the question of how ATAD2 is upregulated in such a variety of cancer types has arisen. Independent studies have implied that it may be correlated with the gene number. One of them has reported that the integrated analysis of copy-number and their expression analysis has revealed 8q24 amplification in 72% of the cases in breast cancer117,119,124,132. It is the site that ATAD2 is located in the genome and it is a region that frequently amplified in cancer133,134. Another study has revealed its genomic amplification in HCC as well135.
12
Figure 1. 2: Left graph: ATAD2 expression levels across various cancer types Right graph: Kaplan-Meier graph of cumulative global survival of lung cancer patients according to their ATAD2 expression levels.
1.3.2 THE FUNCTION AND REGULATION OF ATAD2 ACTIVITY IN CELLS
AAA+ nuclear coregulator cancer associated (ANCCA) is a recently identified nuclear protein which is a member of the AAA+ ATPase family. It possess a bromodomain that is responsible for its binding to acetylated histones115. Phylogenetic studies illustrate its highly conserved ATAD2 homologues in the eukaryotic kingdom. ATAD2-like proteins have been found to be conserved from yeast to plants to human. These proteins share the highest similarities within the sequence of two distinctive domains; AAA+ ATPase domain and the bromodomain. AAA+ ATPase domain present in all living organisms and sequence alignment studies have revealed AAA+ ATPase as the highest conserved region in ATAD2 protein across evolution. This domain may function in different cellular processes136. The mutations that occur at this domain of ATAD2 appear to affect its ATP binding capacity and its binding to acetylated histones118. The overall conservation of amino-acid sequences in both bromodomain and ATPase regions suggest the necessity of its global structure. Yta7, ATAD2 homologue of Saccharomyces cerevisiae, is the most studied homologue in
13
literature. Experiments with Yta7 indicated a third conserved region located in the upstream region of the AAA+ ATPase domain in the N-terminal site of gene. The negatively-charged nature of this region suggests its involvement in histone binding. High similarity between Yta7 and ATAD architecture implies some shared functions. Therefore, the functional studies with this homolog have provided insight into the possible functions of ATAD2 in humans as well. They have revealed a possible function in chromatin regulation, such as the regulation of nucleosome density. They suggest a role as a histone chaperone altering histone density of chromatin. These findings imply the transcriptional activity of ATAD2 as a scaffold protein or as chromatin remodelers. Yeast and mammalian studies on ATAD2 functions showed complementary results136. In humans, ATAD2 was found to interact with estrogen and androgen receptors and act as a co-activator for these nuclear receptors. The later reports showed its requirement for full transcriptional activity of receptors. It seems ATAD2 stimulates the activation of estrogen and androgen responsive genes in the presence of hormones115,127. Work on transcriptional regulation of the ATAD2 gene has shown two spliced variants of the gene. The longer form functions in chromatin binding while the shorter form cannot act in the same way and it is found mainly in the cytosolic part. This difference has been attributed to the lack of 300 amino-acids at the N-terminal end of the gene at shorter variants compared to its corresponding functional variant. The studies revealed the importance of this missing region in the interaction of protein with the androgen receptor and E2F factor. Therefore, just the longer variant may exert its
transcriptional activity118,123,127. It was found that ATAD2 can directly induce the activation of H3K36 methyltransferase, NSD2/WHSC1 gene expression so that it may regulate post-translational histone modifications115,118. This finding indicates that the transcriptional activity of ATAD2 in humans may be the result of its chromatin remodeling function. It is also an inference supporting yeast studies. Figure 1.3 represents a diagram of domains located within the ATAD2 protein. As we already know, it has 2 AAA+ ATPase domains and 1 bromodomain. While the ATPase domain may mediate cellular events such as the facilitation of protein folding and unfolding, assembly or disassembly of protein
complexes, protein transport and its degradation, it regulates significant cellular functions such as replication, recombination, repair and transcription137,138. Bromodomain binds to acetylated lysine residues and may be involved in protein-protein interactions and at the
14
same time may play a role in the assembly or activation of multi-component complexes involved in transcriptional activation139,140. In addition to these two significant domains,
the PhosphoMotifFinder feature of human protein reference database (HPRD) illustrates the presence of an experimentally verified tyrosine (T) phosphorylation site at 1084 in the ATAD2 protein. This can be an important observation since this phosphorylation motif is located in the bromodomain region and it can be a post-translation modification site for the regulation of ATAD2 activity. The regulation of its expression is still in the dark, However there is one study related its expression conversely miR-372 expression and there was a binding site for miRNA in 3’UTR of mRNA. Experiments confirmed that ATAD2 is suppressed with miR-372 expression in HCC cells and this is the first proof of ATAD2 as a miRNA target125. Likewise, this can be the first clue regarding its regulation in the cell. However, there are findings related with its expression levels showing fluctuation
throughout the cell cycle. There is a study from 2010 in which global scale proteome and phosphoproteome of the human cell cycle has been investigated141. Accordingly, the ATAD2 protein level increased in G1/S and S phase with a peak at the late S phase, and then declined in the G2 and M phase. Conversely, it showed the highest phosphorylation site occupancy in the M phase and stayed high in G1 and through the G1/S checkpoint, and then came a dramatic decrease in S and it was at the lowest level in the G2 phase. This suggests that ATAD2 may be activated by phosphorylation in mitotic cells.
Figure 1. 3: The graphical representation of domains on ATAD2 protein with Human Protein
Reference Database (HPRD)142.
1.3.3 ONCOGENIC FUNCTION OF ATAD2 IN CANCER
The conservation of its structure across living organisms indicates the functional
15
revealed more information on its cellular activity. It can interact with E2F transcription factor and play a role in RB/E2F downstream signaling as co-activator123. It enhances the
cell cycle control of their transcriptional activities. There is one study showing that ATAD2 recruits MLL methyltransferase to the promoter regions of E2F responsive
genes115,122. Another one showed it may activate the expressions of H3K36 and NSD2 (NF-Kb co-activator) methyltransferases115,118. ATAD2 may increase the expression of RB/E2F downstream target genes and make the pathway to work at full efficiency in both ways. The Retinoblastoma protein (pRB) is a tumor suppressor gene. It plays a vital role in the
regulation of cell proliferation. It is the responsible protein of the G1 checkpoint. Its interaction with the E2F transcription factor suppresses cell cycle progression if the conditions are not convincing to progress through the S phase. Its loss of function may induce a deregulated cell cycle which leads to tumor progression143. That is why the RB/E2F pathway has been disrupted in a variety of cancer types, mostly through its
genomic mutations144. Considering this pathway is placed in the center of cell cycle control, without its control mechanisms E2F regulated genes show aberrant expressions. One of the E2F target genes is MYC oncogenes. It is frequently overexpressed in tumors145,146. It is adjacent to ATAD2 in the genomic map, so it is often co-amplified with ATAD2 gene in cancer. However, it is known that amplification of MYC does not always reflect its true expression levels, and that ATAD2 expression mostly correlates with its genomic
amplification135,147. Besides, it has been shown ATAD2 is involved in the MYC complex
and cooperates in the activation of MYC target genes. In fact, researchers showed that ATAD2 could be the limiting factor for the transcription of MYC-responsive genes117. Therefore, it is suggested that ATAD2 may be the driving force for MYC to exert its oncogenic activity. The transcriptional regulatory functions of ATAD2 seem to be down to its bromodomain. Bromodomains (BRDs) are protein domains binding to acetylated lysine residues of histones. Lysine acetylation is a type of histone modification. It is one of best known epigenetic processes. These modifications are the carriers of the epigenetic state of cells through divisions. Each modification reflects distinct gene activation status. Their effects are dependent on the specific residue and to what extent the residue is modified. A correlation has been found between specific posttranslational modifications of histones with transcriptional events; such that although all acetylations of lysine residues on H3 and H4
16
are associated with transcriptional activation, methylation of lysine residues may be either associated with transcriptional repression (H3K9, H3K27) or activation depending on amino acid modified and methylation degree. Genome-scale coordinated histone
modifications are closely coupled to gene expression changes between cells148. The nuclear macromolecular complexes recruit specific proteins such as bearing BRDs to genomic regulatory regions. These proteins in turn recognize specific histone acetylated sites and induce chromatin regulation by targeting chromatin modifying molecules149. Therefore, there is a strong biological relevance of BRDs action in cells. Overexpression of these proteins have been reported in cancer cells and they show correlation with patient survival150. ATAD2 is one of these proteins with BRD and its high correlation with poor prognosis and high disease recurrence has been stated among breast cancer patients117,118. ATAD2 as a BRD containing protein has been found to be involved in the transcriptional activation of the cell cycle, differentiation and apoptosis related genes123. ATAD2
selectively binds to acetylated residues of histones. H3K14ac is the most preferentially recognized mark by the ATAD2 bromodomain and this mark is quite abundant at the promoter regions of E2F responsive genes. . The requirement of a functional ATPase domain of ATAD2 for protein multimerization has been demonstrated and upon the loss of this activity the protein has lost its effective binding to acetylated histones as well, so this implies that the two domains intercommunicate to exert the transcriptional activity of the protein117,118. When microarray data sets have been examined, the highest correlated genes
with ATAD2 expression have been classified into cell proliferation and mitosis processes in breast cancer. Further examination has revealed that four of 45 kinesin family genes have been co-expressed with ATAD2 as well. These kinesins function in the assembly of mitotic spindles and chromatin segregation. The experimental validation of the microarray result, conducted by the Zou J. X. group in 2014, has supported the preliminary data. They confirmed ATAD2-mediated upregulation of mitotic kinesins in breast cancer. Its association with histone modifications and its evidenced elevated expression at both the transcriptional and protein level during the G1/S or S phase of the cell cycle show that it may be involved in activation, sustenance or termination of cellular events151. The association of its overexpressed state with cellular events has been revealed with down-regulation experiments. Accordingly, they found the absence of protein hindered prostate
17
and lung cancer cell proliferation. Independent studies have reported regression in breast cancer cell proliferation after ATAD2 suppression118,120,151. One study showed decreased
colony formation ability of HeLa cells after downregulation. However, there was no change in cell proliferation rate after downregulation in exponentially growing cells117. Normal fibroblasts showed decreased ATAD2 expression after serum starvation and blocked cell cycle progression, but then re-upregulated upon serum supplementation and resumed the cell cycle. However, the addition of serum inhibited cell cycle progression after ATAD2 downregulation under serum starvation conditions because DNA synthesis had been blocked117. Altogether, studies support its involvement in tumorigenesis and they indicate its cooperation with cellular signaling pathways to execute its oncogenic functions. So far they could not highlight the underlying interactions yet.
1.3.4 THE ROLE OF ATAD2 IN ESTROGEN SIGNALING
ATAD2 frequently shows high expression in breast cancer cells116,121. It is a gene responsive to both estrogen and androgen hormones115,127. Its expression is strongly upregulated with estrogen/androgen stimulation in breast cells. It is also recruited to the promoter regions of estrogen responsive genes. Molecular studies have revealed its cooperative work with estrogen receptor α (ERα). Its enhancer role in the transcriptional activation of these genes indicated its co-activator role for ERα in breast cancer cells. It supports the activity of ERα. Its presence is required in transcriptional regulation of some ER induced genes such as cell cycle progression, DNA synthesis and replication related CCND1, MYC, survivin, SGK1, ACTR. ATAD2 selectively controls the expression of ERα target genes123. The same group later stated its similar transcriptional activities for
androgen responsive genes as well and it is required for full activity of the receptor127. One study specifically reported the correlation of stimulation of early prostate development mediated by testosterone with increased ATAD2 expression152. Altogether, they placed ATAD2 in the center of steroid hormone signaling. Investigations across primary
endometrial cancers revealed that high expression of ATAD2 is strongly associated with increased MYC signaling but their co-expression is negatively associated with ESR1 expression in the tumors132. Similarly, ATAD2 expression is frequently found to be high in
18
triple negative breast cancer tumors and one microarray study on the identification of genes regulated by ERα in MCF7 cells has displayed its downregulation by estrogen 12 h after treatment in the culture. ATAD2 was found to be in direct physical interaction with ERα, but it is not involved in the recruitment of the receptor to its target genes. On the other hand, the results indicate ATAD2 acts on the recruitment of CBP to gene promoters115. CBP is a bromodomain bearing protein demonstrated to be involved in E2 induced hyperacetylation of histones150. ATAD2 downregulation prevented CBP occupancy at the promoter regions of cyclinD1, c-myc and E2F1 genes. The mutation experiments
emphasized that ATPase activity is necessary for ATAD2 to mediate E2 induced gene expressions as an ERα coactivator because the mutant form of the protein in this domain diminished ERα target gene expression115. Further functional studies of E2-induced
ATAD2 activity revealed its association with kinesin expression in cancer cells. Kinesins are motor proteins and they are expressed in A cell-specific manner. They are responsible for the organelle transport on microtubules. They function in cell division. Expression of 26 kinesin genes is regulated by E2 in MCF7 cells153. Among these genes, it was found that ATAD2 mediates the upregulation of mitotic kinesins and downregulation of non-mitotic kinesins via ERα following E2 induction151. Further expression analysis showed striking
similarities between functions of ATAD2 and another nuclear protein, ACTR. This is a member of p160 coactivator family and acts as coactivator of nuclear receptors just like ATAD2154. The protein, also recognized as a proto-oncogene, is overexpressed in
30%-40% of breast cancer cells and 10% of its overexpression is reported to be associated with gene amplification in breast tumors. The studies showed its requirement for both E2 dependent and independent breast cancer cell proliferation. The investigations indicated its role as E2F coactivator in cell cycle control mechanisms of breast cells. Its cooperation with ERBB2 is believed to be one of the reasons of antiestrogen resistance and its ectopic expression transforms human mammary epithelial cells155-157. Chromatin IP (ChIP) assays have demonstrated the direct interaction of ATAD2 with the ACTR and E2F proteins. ATAD2 is also known as E2F coactivator and both ACTR and ATAD2 induce E2F-responsive gene expression. ATAD2 binds to E2F1 on the promoter of the ACTR gene, so it may directly regulate its expression in breast cancer cells. It is assumed there is a positive feedback loop between ACTR and ATAD2 and ATAD2 is a direct target of the ACTR as
19
well. ACTR was previously shown to activate its own expression and now the underlying mechanism of this appears to be its transcriptional cooperation with the ATAD2 protein. The overexpression of both ACTR and ATAD2 synergistically increased the expression of E2F target genes 200%115,121. Overall the results suggest it is required for both cell
proliferation of both hormone-responsive and hormone-nonresponsive breast cancer cells and for the expression of cell cycle and DNA synthesis related E2F target genes such as cyclin E1, cyclin A2,cycln 1,cdk2,cdc2,cdc6.
1.4 CELLULAR SENESCENCE
Cellular senescence has been described with the Hayflick discovery. He showed that normal fibroblast cells went under growth arrest after a limited number of divisions. This was an irreversible state since even though cells have been induced with growth factors, cell proliferation did not start again, so cells are said to have a definite replicative
lifespan158. Over four decades after Hayflick’ finding, we now aware that cancer cells do
not have same control mechanism on cell growth as normal cells. The senescence process does not work for them. Therefore, they are defined as immortal cells. The accepted reason behind the protection of cancer cells from senescence is that 90% of them have
overexpressed telomerase activity, so they keep stable telomere ends even with infinite divisions159,160. The reports supporting this suggestion came from mutation experiments of the telomerase enzyme. The mutated form of telomerase could not sustain cancer cell proliferation161. Likewise, the senescence response was dependent on p53 and RB pathways as well162-165. However despite continuing research, it is still a complex topic. There are differing opinions on the beneficial effects of senescence in vivo. There are some studies that reported mutant p53 could induce cell growth in vivo and double mutant could inhibit early tumor development in mice. It is accepted as the indications of the natural senescence mechanism in vivo. On the other hand, there are studies proving senescent cells may induce cancer cell growth also in vivo. For instance, the mimic of an in vivo system in which TGF-β deficient fibroblasts stimulated adjacent epithelial cell growth164,165. The molecular basis
of these cellular interactions has been investigated in depth under this topic and revealed many aspects of senescent cells.
20
1.4.1 CHARACTERISTICS OF SENESCENT CELLS
To find a clear definition of senescence is still challenging. Scientists have therefore
identified a few criteria to detect senescent cells. Multicellular organisms are the mixture of both mitotic and post-mitotic cells. While mitotic cells correspond to cells still having proliferating abilities, post-mitotic cells, as the name states, are no longer capable of proliferation. While G0 seems to be their common point, the difference between the two states is that mitotic cells are still responsive to external factors and can exit G0 and re-enter into the cell cycle. These cells are defined as quiescent cells at the G0 point. When growth factors in the medium have been withdrawn, cells stop growing and enter into G0 which is a reversible state. Post-mitotic cells exit the cell cycle indefinitely and cannot reinitiate cellular proliferation166. However there should be more than a simple serum
withdrawal to push cells into irreversible growth arrest. One way to arrest cells is the induction of CDK inhibitors. CDK inhibitors act as the censors of cell cycle and let or prevent cell cycle progression depending on the cellular conditions. They may cause cell cycle arrest even in the presence of growth stimulation167-169 Therefore a strange situation occurs during the progress of senescence mechanism. CDK inhibitors such as p21, p16 ensure that the cell cycle does not reinitiate and it remains permanent in this case because growth factors cannot stimulate proliferation of senescent cells; however, they can promote the growth-pathways170-172. That is why senescent cells display over activated growth associated signaling pathways such as MAPK and mTOR while their downstream cell cycle progression is blocked. This state is called cellular hypertrophy173,174. As a result, the first sign of senescent cells is their cell cycle arrest coupled with increased intracellular
activities of growth pathways. The senescence response differs depending on the genetic makeup of cells175. Some cell types exhibit preferential specific growth arrest. For instance, senescent mouse fibroblasts are frequently arrested in the G1 phase; however defective kinase activity induces G2/M arrest in the same cells. The second known sign is hyper-secretion from senescent cells which is a natural result of their increased cellular functions. It is found that senescent cells secrete mitogenic factors to their microenvironments176. It explains the previous observations of that senescent cells may promote neighbor cell growth. Another senescence indication is apoptosis resistance. Apoptosis is a natural