See discussions, stats, and author profiles for this publication at: https://www.researchgate.net/publication/26254893
Characterization of thermally poled
germanosilicate thin films
Article in Optics Express · November 2004 DOI: 10.1364/OPEX.12.004698 · Source: PubMed CITATIONS16
READS24
5 authors, including: Feridun Ay Anadolu University 113 PUBLICATIONS 805 CITATIONS SEE PROFILECharacterization of thermally poled
germanosilicate thin films
A. Ozcan, M. J. F. Digonnet, G. S. Kino
Edward L. Ginzton Laboratory, Stanford University, Stanford, CA 94305
F. Ay, and A. Aydinli
Department of Physics, Bilkent University, 06800, Ankara, Turkey
Abstract: We report measurements of the nonlinearity profile of thermally
poled low-loss germanosilicate films deposited on fused-silica substrates by PECVD, of interest as potential electro-optic devices. The profiles of films grown and poled under various conditions all exhibit a sharp peak ~0.5 µm beneath the anode surface, followed by a weaker pedestal of approximately constant amplitude down to a depth of 13–16 µm, without the sign reversal typical of poled undoped fused silica. These features suggest that during poling, the films significantly slow down the injection of positive ions into the structure. After local optimization, we demonstrate a record peak nonlinear coefficient of ~1.6 pm/V, approximately twice as strong as the highest reliable value reported in thermally poled fused silica glass, a significant improvement that was qualitatively expected from the presence of Ge.
2004 Optical Society of America
OCIS codes: (310.6860) Thin films, optical properties; (190.4400) Nonlinear optics, materials References and links
1. Y. Quiquempois, P. Niay, M. Douay, and B. Poumellec, " Advances in poling and permanently induced phenomena in silica-based glasses," Current Opinion in Solid State & Materials Science 7, 89-95 (2003) 2. A. Ozcan, M. J. F. Digonnet, and G. S. Kino, "Improved technique to determine second-order optical
nonlinearity profiles using two different samples," Appl. Phys. Lett. 84, 681-683 (2004).
3. A. C. Liu, M. J. F. Digonnet, and G. S. Kino, "Electro-optic phase modulation in silica channel waveguide," Opt. Lett. 19, 466-468 (1994)
4. T. Fujiwara, D. Wong, and S. Fleming, "Large electrooptic modulation in a thermally-poled germanosilicate fiber," IEEE Photon. Tech. Lett. 10, 1177-1179 (1995)
5. X. C. Long and S. R. J. Brueck, "Large-signal phase retardation with a poled electrooptic fiber," IEEE Photon. Tech. Lett. 9, 767-769 (1997)
6. Y. Ren, C. J. Marckmann, J. Arentoft, and M. Kristensen, "Thermally poled channel waveguides with polarization-independent electrooptic effect," IEEE Photon. Tech. Lett. 14 639-641 (2002)
7. F. Ay, A. Aydinli, and S. Agan "Low-loss as-grown germanosilicate layers for optical waveguides," Appl. Phys. Lett. 83, 4743-4745 (2003)
8. D. Faccio, A. Busacca, D. W. J. Harwood, G. Bonfrate, V. Pruneri, and P. G. Kazansky, "Effect of core-cladding interface on thermal poling of germanosilicate optical waveguides," Opt. Comm. 196, 187-190 (2001)
9. J. Khaled, T. Fujiwara, M. Ohama, and A. J. Ikushima, "Generation of second harmonics in Ge-doped SiO2 thin films by ultraviolet irradiation under poling electric field," J. Appl. Phys. 87, 2137-2141 (2000) 10. A. Ozcan, M. J. F. Digonnet, and G. S. Kino, "Iterative processing of second-order optical nonlinearity
depth profiles," Opt. Express 12, 3367-3376 (2004),
http://www.opticsexpress.org/abstract.cfm?URI=OPEX-12-15-3367
11. F. Ay, and A. Aydinli, "Comparative investigation of hydrogen bonding in silicon based PECVD grown dielectrics for optical waveguides," Opt. Mat. 26, 33-46 (2004)
12. A. S. Huang, Y. Arie, C. C. Neil, and J. M. Hammer, "Study of refractive index of GeO2:SiO2 mixtures using deposited-thin-film optical waveguides," Appl. Opt. 24, 4404-4407 (1985)
13. R. A. Myers, N. Mukerjkee, and S. R. J. Brueck, "Large second-order nonlinearity in poled fused silica," Opt. Lett. 16, 1732-1734 (1991).
14. A. Ozcan, M. J. F. Digonnet, and G. S. Kino, "Cylinder-assisted Maker-fringe technique," Electron. Lett.
39, 1834-1836 (2003).
15. P. D. Maker, R. W. Terhune, M. Nisenhoff, and C. M. Savage, "Effects of dispersion and focusing on production of optical harmonics," Phys. Rev. Lett. 8, 21-22 (1962).
16. J. Jerphagnon, and S. K. Kurtz, "Maker fringes: a detailed comparison of theory and experiment for isotropic and uniaxial crystals," J. Appl. Phys. 41, 1667-1681 (1970).
17. J. R. Fienup, "Reconstruction of an object from the modulus of its Fourier transform," Opt. Lett. 3, 27-29 (1978).
18. T. G. Alley, S. R. J. Brueck, and R. A. Myers, "Space charge dynamics in thermally poled fused silica," J. Non-Cryst. Solids 242, 165-176 (1998)
19. A. C. Liu, M. J. F. Digonnet, and G. S. Kino, "Measurement of the dc Kerr and electrostrictive phase modulation in silica," J. Opt. Soc. Am. B 18, 187-194, (2001)
20. D. Faccio, V. Pruneri, and P. G. Kazanksy, "Dynamics of the second order nonlinearity in thermally poled silica glass," Appl. Phys. Lett. 79, 2687-2689 (2001)
21. N. Boling, A. Glass, and A. Owyoung, "Empirical relationships for predicting nonlinear refractive index changes in optical solids," IEEE J. Quantum Electron. 14, 601-608 (1978).
22. A. Ozcan, M. J. F. Digonnet, and G. S. Kino, "Simplified inverse Fourier transform technique to measure optical nonlinearity profiles using reference sample," Electron. Lett. 40, 551-552 (2004).
23. Y. Quiquempois, G. Martinelli, P. Dutherage, P. Bernage, P. and M. Douay, "Localisation of the induced second-order non-linearity within Infrasil and Suprasil thermally poled glasses," Opt. Comm. 176, 479-487 (2000)
24. A. Kameyama, A. Yokotani, K. Kurosawa, "Generation and erasure of second-order optical nonlinearities in thermally poled silica glasses by control of point defects," J. Opt. Soc. Am. B 19, 2376-2383 (2002) 25. P. Thamboon and D. M. Krol, "Second-order optical nonlinearities in thermally poled phosphate glasses," J.
Appl. Phys. 93, 32-37 (2003)
26. R. T. Crosswell, A. Reisman, D. L. Simpson, D. Temple, and C. K. Williams, "Planarization processes and applications: III. As-deposited and annealed film properties," J. Electrochem. Soc. 147, 1513-1524 (2000)
1. Introduction
Poled glass has been an active area of research over the last few years because of the prospect of using this nonlinear material for integrated electro-optic phase and amplitude modulators or parametric oscillators.[1] Poled silica-based glasses are particularly interesting in these applications because they exhibit low loss, broad transmission bands, and high optical damage threshold, and they are compatible with the current fiber technology. One of the main limitations of this material, however, is that its nonlinear coefficient is low, with a peak second-order optical nonlinear coefficient d33 of only ~0.8 pm/V (compared to ~30 pm/V for
LiNbO3).[2] As a result, all poled-glass devices reported to date require high voltages and/or
long lengths.[3-6] Increasing the nonlinearity of poled glasses, for example by improving the material composition or the poling conditions, is therefore an important step towards achieving practical poled-glass devices.
In this paper, we report a poling study of germanosilicate films that makes significant progress in this direction. This choice of material was made for two reasons. First, since their propagation loss has been dramatically reduced,[7] germanosilicate films grown onto fused silica substrates are excellent waveguides with a refractive index close to that of silica, which makes them compatible with fiber-optic technology. Second, the addition of Ge to silica increases the refractive index of the glass, and thus its third-order optical susceptibility χ(3), and since the nonlinear coefficient d33 of poled glass is proportional to χ(3) it is expected that d33 will also be increased. Poled germanosilicate glass[6,8,9] is therefore a promising
candidate for low-loss as-deposited integrated planar electro-optic devices. In this work, we have used thermal poling instead of UV poling because the later produces short-lived nonlinear regions.[9] We confirm these expectations with experimental investigations showing that the peak nonlinear coefficient of germanosilicate films with optimal Ge concentration, thickness, and poling time take a record value of ~1.6 pm/V. Precise and unique characterization of the spatial profile of the nonlinear region using a recently developed technique[10] reveals interesting details regarding the physics of poling in these
glasses, including the fact that the Ge-doped layer blocks diffusionof the positive ions from the anode surface during poling and that the space charge distribution inside the poled region exhibits a dipolar structure within the first micron below the anode surface, followed by a neutral region from ~1 µm to ~12 µm, which is followed by a weaker negatively charged region up to a total depth of ~16 µm. These findings are quite important especially for the optimization of the overlap between the optical mode of an electro-optic device utilizing poled germanosilicate films and the induced nonlinear region.
2. Germanosilicate growth process
The germanosilicate films were deposited on square substrates of synthetic silica (Infrasil) 25 mm on the side and 150 µm thick using plasma-enhanced chemical vapor deposition (PECVD) in a parallel-plate reactor (Plasmalab 8510C). The films were grown at 350 oC and at a pressure of 1 Torr, with an RF power of 10 W at 13.56 MHz applied to the plates. The diameter of the plates was 24 cm. The precursor gases were silane (2% SiH4/N2), germane
(2% GeH4/He), and nitrous oxide (N2O). The flow rates of silane and nitrous oxide were kept
constant at 180 and 225 sccm, respectively, while that of germane was set at a constant value between 0 and 90 sccm that was varied from run to run. The growth rate of the films was ~40 nm/min. A major problem in the application of CVD-grown silicon-based layers in integrated optics is the incorporation of hydrogen in the form of N–H bonds into the film matrix.[11] Annealing is usually required to reduce the propagation loss of the optical waveguides that utilize these layers as the core. Instead, the samples were manufactured using a new recipe that has produced the lowest propagation loss of as-grown germanosilicate films reported to date.[7]
In order to study the effects of film composition, film thickness, and poling time on the nonlinearity profile and strength of poled germanosilicate films, we grew seven germanosilicate films at four different germane flow rates (0, 33, 50, and 90 sccm). The characteristics of these films and the poling times are listed in Table 1. Mole fraction of GeO2
of the grown films is estimated from the measured dispersion curves of the films, as listed in Table 1.[12] Based on previous measurements on similar samples,[7] the propagation loss of the as-grown waveguides was estimated to be less than 0.15 dB/cm at 1550 nm.
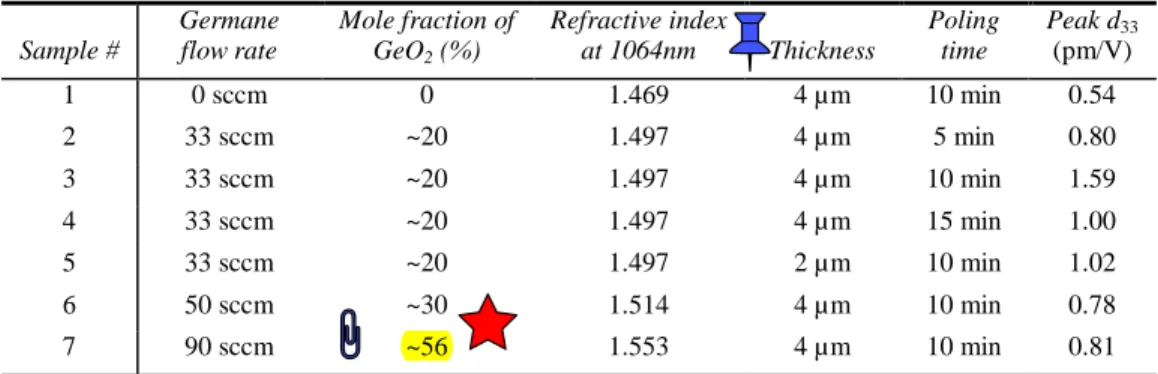
Table 1. Characteristics and poling time of germanosilicate films poled in air at ~5 kV and ~280 °C.
Sample # Germane flow rate Mole fraction of GeO2 (%) Refractive index at 1064nm Thickness Poling time Peak d33 (pm/V) 1 0 sccm 0 1.469 4 µm 10 min 0.54 2 33 sccm ~20 1.497 4 µm 5 min 0.80 3 33 sccm ~20 1.497 4 µm 10 min 1.59 4 33 sccm ~20 1.497 4 µm 15 min 1.00 5 33 sccm ~20 1.497 2 µm 10 min 1.02 6 50 sccm ~30 1.514 4 µm 10 min 0.78 7 90 sccm ~56 1.553 4 µm 10 min 0.81
3. Thermal poling and characterization of the poled films
As-grown germanosilicate-Infrasil structures were thermally poled[13] using polished n-type silicon electrodes in air at ~5 kV and 280 °C, with the positive electrode facing the film. The nonlinearity spatial profile of each poled sample was measured using the Maker fringe-Fienup technique.[10] A fundamental laser beam at 1064 nm is launched onto the sample and the power in the second-harmonic (SH) signal (at 532 nm) generated within the nonlinear region is measured as a function of the incidence angle of the fundamental laser beam, using the cylinder-assisted set-up described in Ref. [14]. The resulting curve is known as the Maker
fringe (MF) curve.[15] Because of the refractive index mismatch between the Infrasil substrate and the germanosilicate film, angle-dependent spurious reflections occurred at the film-cylinder and the film-substrate interfaces. Correction factors were thus applied to the measured MF curves to correct them for multiple reflections [16] and Fresnel reflection at both the fundamental and SH signal wavelengths. Furthermore, the sample grown at a 90-sccm germane flow rate, which physically looked brown, had higher loss, especially in the visible spectrum. The film's measured loss coefficients (~4 dB/cm at 1064 nm and ~710 dB/cm at 532 nm) were thus used to correct the measured MF curve for this poled sample. Each of these corrected MF curves was finally processed using the iterative Fienup algorithm [17] to uniquely recover the second-order optical nonlinearity profile of each poled sample, as described in Ref. 10. In this work, we have preferred the iterative Fienup algorithm to other inverse Fourier transform (FT) techniques, such as the two-sample technique, [2] because of the simplicity and speed of the Fienup algorithm. For instance, the two-sample inverse FT technique requires pressing two different poled samples to each other in two different configurations, and measuring the MF curves of these sandwich structures [2]. The iterative Fienup technique, however, requires only the measurement of the poled sample alone, without the need for a second nonlinear sample. Furthermore, for germanosilicate-Infrasil thin film structures, the MF curve of such sandwich structures would be more difficult to measure and calibrate, due to multiple reflections arising from the 4 interfaces with refractive index mismatch. By using the iterative Fienup algorithm, this complex situation is avoided.
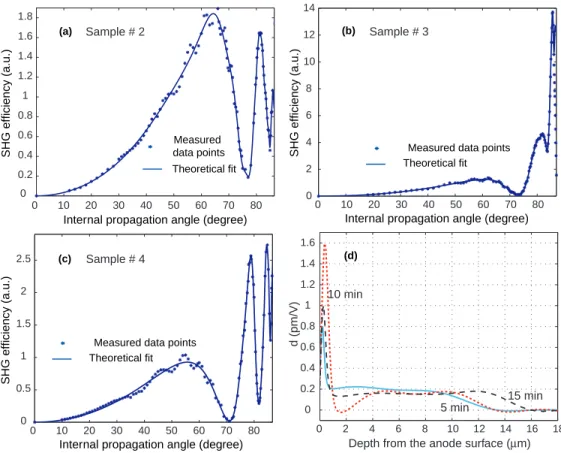
To identify the optimum poling time for these samples, we first poled samples #2, #3, and #4, all of which were grown at 33 sccm germane flow rate to a thickness of 4 µm, for 5, 10 and 15 minutes, respectively. The calibrated MF curves of these poled samples are shown in Figs. 1(a)-(c). The nonlinearity depth profile of each sample recovered from these curves using the Fienup algorithm is shown in Fig. 1(d). All three profiles exhibit similar features, namely a sharp peak centered about 0.5 µm below the anode, followed by a weak pedestal that is approximately constant to a depth of ~9–12 µm and that gradually decreases to zero at a depth of 13–16 µm. This sequence of profiles reveals that the optimum poling time for these germanosilicate-Infrasil structures at an applied E-field of ~32.5 MV/m is 10 min. The peak
d33 coefficient obtained under these poling conditions is as high as ~1.6 pm/V. To our
knowledge, this is the highest directly measured second-order nonlinear coefficient reported in thermally poled germanosilicate glass. This is about twice as high as the highest reliable peak d33 value reported for thermally poled fused silica, i.e., 0.8 pm/V.[2] The other measured
peak d33 coefficients for poling times of 5 and 15 min are ~0.8 pm/V and ~1.0 pm/V,
respectively. Note that the entire nonlinearity peak is contained in the germanosilicate film, while most of the pedestal is in the silica substrate. Furthermore, as physically expected, due to the diffusion of positive ions, the depth of the pedestal gradually increases from ~9 µm to ~12 µm as the poling time is increased from 5 min to 15 min (see Fig. 1(d)).
In general, the profiles recovered using the Fienup algorithm could actually be shifted in space from the actual profile, i.e., dA(z− z0)= dR(z), where dA(z) and dR(z) refer to the
actual and recovered profiles, respectively.[10] However, we have two significant pieces of evidence that there is no spatial shift involved in any of our proposed solutions. First, using the same poled germanosilicate thin films, we have fabricated ridge waveguides to guide light in the thin film region, and we have measured the effective electro-optic coefficient of these fabricated waveguides, the results of which will be the subject of a future publication. Our measured effective electro-optic coefficient in these poled waveguides perfectly matches with the predicted electro-optic coefficient, which was calculated using our proposed nonlinearity profiles. If there were a spatial shift in the profile, the overlap of the guided optical mode with this hypothetically shifted nonlinearity profile would then yield an effective electro-optic coefficient much weaker than what is experimentally measured for the same poled films. Second, if our proposed d(z) solutions were to be slightly shifted to the bulk of the material, then this would imply a non-poled region a few micrometers deep under the anode electrode, with d = 0 pm/V. There is no physical evidence for such an unpoled region just under the anode electrode. For thermally poled materials, the observed trend is that the nonlinearity
starts right at the anode surface, and extends towards the bulk of the material.[1,2] Therefore, the recovered nonlinearity profiles reported in Fig. 1 and in the rest of this paper do not involve relative spatial shifts with respect to the anode surface.
0 10 20 30 40 50 60 70 80 0 0.2 0.4 0.6 0.8 1 1.2 1.4 1.6 1.8 0 10 20 30 40 50 60 70 80 0 2 4 6 8 10 12 14 0 10 20 30 40 50 60 70 80 0 0.5 1 1.5 2 2.5 0 2 4 6 8 10 12 14 16 18 0 0.2 0.4 0.6 0.8 1 1.2 1.4 1.6
Measured data points Theoretical fit
Measured data points Theoretical fit
Measured data points
Theoretical fit
SHG efficiency (a.u.) SHG efficiency (a.u.)
SHG efficiency (a.u.)
(a) (b)
(c) (d)
Internal propagation angle (degree) Internal propagation angle (degree)
Internal propagation angle (degree)
Sample # 2 Sample # 3
Sample # 4
Depth from the anode surface (µm)
d (pm/V)
5 min
15 min 10 min
Fig. 1. Calibrated MF curves measured for (a) sample # 2, (b) sample # 3, and (c) sample # 4. The solid curves are the theoretical MF curves computed from the recovered d33(z) profiles. (d) The recovered
optical nonlinearity depth profiles of sample # 2 (blue), # 3 (red) and # 4 (black).
It has been shown that most of the nonlinear coefficient of thermally poled silica arises from rectification of the third-order susceptibility χ(3) of the material by a dc electric field E that builds up in the material near the anode,[18-20] i.e.:
d33= 3/ 2 ⋅χ(3)⋅ E (1) We postulate that same main mechanism is responsible for the nonlinearity of the present materials, and we attribute the observed increase in the peak d33 coefficient to the higher χ(3)
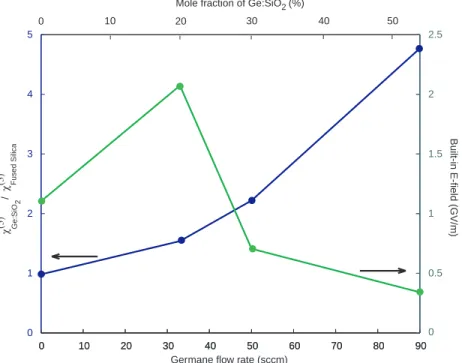
of germanosilicate. To validate this point, we used an empirical relationship[21] to predict the nonlinear refractive index of the germanosilicate films from their dispersion curves. The ratio of the third-order susceptibility of the PECVD grown layer, χGe: SiO2(3) , to the susceptibility of fused silica, χFusedSilica(3) , computed using the measured dispersion curves of the films grown at 0, 33, 50, and 90 sccm germane flow rates is plotted in Fig. 2 as a function of the germane flow rate. This curve shows that (1) as expected physically the χ(3) of the 0-sccm germane flow rate film is very close to the χ(3) of fused silica; (2) as the germane flow rate is increased, the χ(3) of the germanosilicate film increases almost quadratically. Specifically, for sample #3
~1.54/2 ≈ 80% of the two-fold increase observed in the peak d33 coefficient of sample #3. This
suggests that the remaining contribution to the two-fold increase in peak d33 should be due to a
30% increase in the built-in field in sample #3 compared to the built-in field of poled fused silica.[2] 0 10 20 30 40 50 60 70 80 90 0 1 2 3 4 5 0 10 20 30 40 50 60 70 80 90 0 0.5 1 1.5 2 2.5 χ(3) / χ(3) Ge:SiO 2 Fused Silica
Germane flow rate (sccm)
Built-in E-field (GV/m)
30 50
20 0
Mole fraction of Ge:SiO2 (%)
10 40
Fig. 2. Blue curve (left axis): the ratio of the χ(3) of the PECVD grown layer to the χ(3)of fused
silica; green curve (right axis): maximum built-in E-field measured in poled germanosilicate films.
The total depth of the induced nonlinear region (~13–16 µm) in Fig. 1(d) is significantly narrower than for bulk Infrasil samples thermally poled under similar conditions, for which the depth is typically ~40 µm.[2,10,22] Furthermore, unlike in poled Infrasil samples, the
d33(z) profile of the poled germanosilicate-Infrasil structures does not change sign. We believe
that the reason for these differences is that the germanosilicate film limits the diffusion of positive ions such as H3O+ from the anode surface into the sample, which results in the
formation of a narrower depletion region within the film itself. A similar blocking behavior in germanosilicate films, which also resulted in narrower nonlinear widths, has been previously reported.[8]
For comparison purposes, the theoretical MF curves computed from the inferred d33(z)
profiles of Fig. 1(d) are also shown in Figs. 1(a)-(c) (solid curves). The excellent agreement between the computed and the measured MF curves for all three samples confirms again the high accuracy of the Maker fringe-Fienup technique and the validity of our results. At this point, we should mention that all of the measured MF curves exhibit some faster oscillations superimposed on a much stronger but slower fundamental oscillation. This weak high frequency modulation is especially evident in the measured MF curve of sample #4 between internal propagation angles of 35°-65° (see Fig. 1(c)). We believe that this weak fast oscillation is simply due to a much weaker nonlinearity induced at the cathode end of the poled samples, which has also been observed for other thermally-poled samples.[23-25] The fact that the period of this fast spatial frequency oscillation roughly matches to the thickness of the poled samples (~150 µm) supports this argument. Meanwhile, the theoretically computed MF curves (solid lines in Figs. 1(a)-(c)) corresponding to the recovered profiles do
not show the same fast oscillation but simply show excellent fits with the much stronger but slower oscillations in the measured MF curves. This is an expected result, related to the fact that in the process of recovering the full spatial FT spectrum from the measured MF curves, an iterative frequency extrapolation algorithm known as the Papoulis-Gerchberg algorithm is used [2]. In this extrapolation algorithm, to speed up the convergence, the extent of the nonlinear region is limited to less than ~50-60 µm deep from the anode surface. Therefore, any nonlinear coefficient beyond this first 50-60 µm from the anode surface is neglected, including the weak nonlinearity at the cathode end. For practical device applications, e.g., electro-optic phase/amplitude modulators, this is quite reasonable since the most significant and useful part of the nonlinearity is confined to the first ~40 µm from the anode surface [1,2,10]. The fact that it is safe to neglect the nonlinearity after the first ~60 µm is also verified by the fact that the reported theoretical fits to the measured MF curves all agree perfectly with the stronger slow oscillations.
0 2 4 6 8 10 12 14 16 18 -4 -2 0 2 4 6 8 Neutral -+
Charge density (a.u.)
Depth from the anode surface (µm)
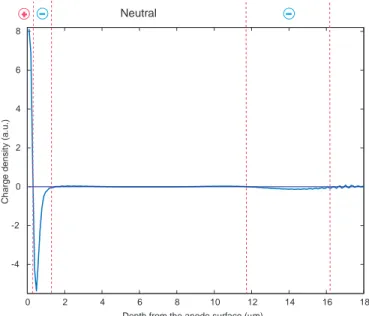
Fig. 3. Charge density of poled sample # 4, inferred by differentiating the recovered d33(z) profile.
Assuming that dc rectification of the third-order optical susceptibility of the glass is the main mechanism responsible for the observed nonlinearity, as is the case in silica,[18-20] then the total voltage drop across the nonlinear region should be equal to the poling voltage.[22] To verify this point, we computed the integral along the depth z of each recovered nonlinearity profile of Fig. 1(d). The calculated voltages come out to be 4.77 kV, 4.77 kV and 5.21 kV for sample #2, #3 and #4, respectively. As expected, these values are close to the poling voltage (~5 kV), which lends further credence to the inferred profiles. We note that the true sign of all profiles in Fig. 1(d) cannot be inferred by using the Fienup algorithm alone.[10] However, for almost all of the applications, this sign ambiguity, i.e., ±d33(z), is
not consequential and other means of resolving this sign ambiguity has been discussed elsewhere.[22] Meanwhile, the fact that the integrated voltage drop across the recovered profiles has the same sign as the poling voltage (+5 kV) suggests that the inferred profiles as shown in Fig. 1(d) do have the correct sign (positive).
To provide further physical insight into the poling process for the germanosilicate-Infrasil structures, we calculated the charge density distribution frozen within the glass from the recovered nonlinearity profiles. Since the profile is proportional to the built-in E-field distribution, and since the distribution of space charge density in the glass is proportional to the derivative of the built-in E-field, the charge density can be obtained simply by taking the
derivative of the measured profile. As an example, the charge density distribution of sample # 4 (Fig. 1(d)) recovered by this process is shown in Fig. 3. This distribution exhibits a dipolar structure within the first micron below the anode surface, followed by a neutral region from ~1 µm to ~12 µm, which itself is followed by a weaker negatively charged region extending to a depth of ~16 µm. The charge distributions recovered for the other samples show very similar features, the main difference being minor variations in the locations of these regions. The integral of the recovered charge distribution shown in Fig. 3 yields a total charge of –8.53 10-3 C/m2. We believe that the neutrality of the sample is preserved by an equal amount of positive alkali ions (e.g., Na+ or K+) charge that is spread throughout the remaining bulk of the Infrasil substrate. Because it is spread over roughly 150 µm of glass, this charge density is much lower and thus contributes to a bulk second-order nonlinearity that is too weak to be measured. Furthermore, we anticipate that the depth of the neutral region shown in Fig. 3 reflects the total diffusion depth of the positive ions injected from the anode surface, which cancel out the negative sites left behind by the alkali ions such as Na+ and K+ that have migrated towards the cathode.
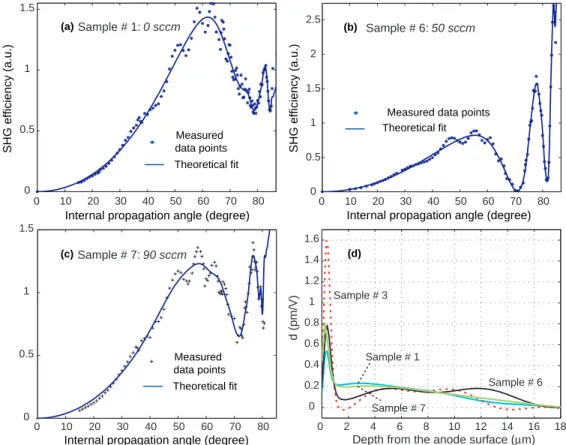
After optimizing the poling time, we investigated the effect of the germane flow rate on the induced nonlinearity profile. For this purpose, we poled samples #1, #3, #6, and #7, which all have 4-µm thick germanosilicate films but were grown with different flow rates, namely 0, 33, 50 and 90 sccm, respectively. The poling conditions for all four samples were identical, i.e., in air at ~5 kV and 280 °C, for 10 min. The calibrated measured MF curves for samples #1, #6 and #7 are shown in Figs. 4(a)-(c). The MF curve for sample #3 has already been shown in Fig. 1(b). The nonlinearity profiles recovered by applying the Fienup algorithm to these MF curves are shown in Fig. 4(d). The profiles exhibit the same characteristics as the previous samples (see Fig. 1(d)), i.e., a dominant peak buried ~0.5 µm beneath the anode surface, followed by an almost constant nonlinear region of same sign that gradually decreases to zero at a width of 13–16 µm. The peak d33 coefficients of samples #1, #6 and #7
are found to be 0.54, 0.78 and 0.81 pm/V, respectively. This investigation shows that the highest peak d33 coefficient (1.6 pm/V) is achieved for a germane flow of 33 sccm (sample
#3). Even though a higher germane flow rate produces a higher Ge concentration and thus a higher χ(3), as confirmed in Fig. 2, the fact that the peak d33 coefficient is maximum in the
33-sccm sample suggests that the built-in field drops at higher Ge flow rates. To illustrate this point, the maximum built-in E-field in poled germanosilicate films, calculated from Eq. (1) using the measured peak d33 value and the calculated χ(3) value for each sample, is also plotted
as a function of germane flow rate in Fig. 2. The results reveal that the highest built-in field is achieved for the 33-sccm sample (#3) and that for higher germane flow rates the built-in field steadily drops. We mostly relate these observations to an increase in the film electrical conductivity as the Ge concentration in the film is increased, which has been previously confirmed.[26] On the other hand, the built-in field of the 33-sccm sample is higher than that of the 0-sccm sample (pure SiO2), although the latter has a lower electrical conductivity. This
points out that there exists an optimum electrical conductivity range for a given set of poling conditions. This hypothesis is supported by the fact that under similar poling conditions, Suprasil, which contains much less impurity than Infrasil and thus has a lower conductivity, develops a built-in field nearly one order of magnitude lower than Infrasil.[1,23]
It should be noted that the measured MF curves for samples #1 and #7 are quite similar, both in terms of shape and strength (see Figs. 4(a) and 4(c)). This similarity explains the observed similarity in the recovered nonlinearity profiles of these two samples, as can be seen in Fig. 4(d). However, the peak d33 coefficient is weaker for sample #1 (0.54 pm/V) than for
sample #7 (0.81 pm/V). This difference originates from the second peak in the MF curves around an internal propagation angle of ~80°, which is stronger for sample #7 than for sample #1 (see Figs. 4(a) and 4(c)). At such high angles, the fundamental beam interacts mostly with the nonlinearity at the surface of the material because diffraction causes the power density of the fundamental beam to decrease in the substrate, which reduces the SH conversion efficiency in the deeper part of the nonlinearity profile. From the enhanced SHG efficiency observed near ~80°, we therefore expect a stronger nonlinearity close to the surface, as
observed in the recovered profile of sample #7. Another way to look at the same phenomena is to consider that higher angles correspond to higher spatial Fourier transform frequencies, so the slower the high frequency components decay to zero, the more tightly confined the nonlinearity is. For example, in the limit where high frequency components never decay to zero, the profile is a delta function, i. e., all the nonlinearity is confined to the surface of the sample. This reasoning also explains the record peak nonlinearity observed in sample #3. In the measured MF curve of sample #3 (Fig. 1(b)) the SHG efficiency at high angles (e.g., 80° or higher) is about 5–7 times stronger than in the MF curves of all the other samples, which is caused by the stronger nonlinearity present near the anode surface in sample #3. Overall, the fact that the strength of the nonlinearity peak close to the anode surface is mostly visible at higher incidence angles establishes once again the importance of measuring MF curves up to high angles, as we suggested earlier.[14]
Measured data points
Theoretical fit
SHG efficiency (a.u.) SHG efficiency (a.u.)
(a)
Internal propagation angle (degree) Internal propagation angle (degree)
Sample # 1: 0 sccm
Measured data points Theoretical fit
(b) Sample # 6: 50 sccm
Depth from the anode surface (µm)
d (pm/V) 0 10 20 30 40 50 60 70 80 0 0.5 1 1.5 0 10 20 30 40 50 60 70 80 0 0.5 1 1.5 2 2.5 0 10 20 30 40 50 60 70 80 0 0.5 1 1.5 0 2 4 6 8 10 12 14 16 18 0 0.2 0.4 0.6 0.8 1 1.2 1.4 1.6 (c)Sample # 7: 90 sccm
Internal propagation angle (degree)
Sample # 3 Sample # 6 Sample # 1 Sample # 7 Measured data points Theoretical fit (d)
Fig. 4. Calibrated MF curves measured for (a) sample #1, (b) sample #6, and (c) sample #7. The solid curves in each figure are the theoretical MF curves computed from the recovered d33(z) profiles. (d) The
recovered nonlinearity profiles of sample #1 (blue), #3 (red), #6 (black) and #7 (green).
Once again, for comparison purposes we also show as solid curves in Figs. 4(a)-(c) the theoretical MF curves computed from the recovered profiles of Fig. 4(d). The agreement between these theoretical and the measured MF curves is again excellent, which further supports our results. The calculated total voltage drop across the nonlinear profiles of Fig. 4(d) is 4.92 kV, 5.58 kV, and 5.34 kV for samples #1, #6, and #7, respectively, all in good agreement with the poling voltage (~5 kV).
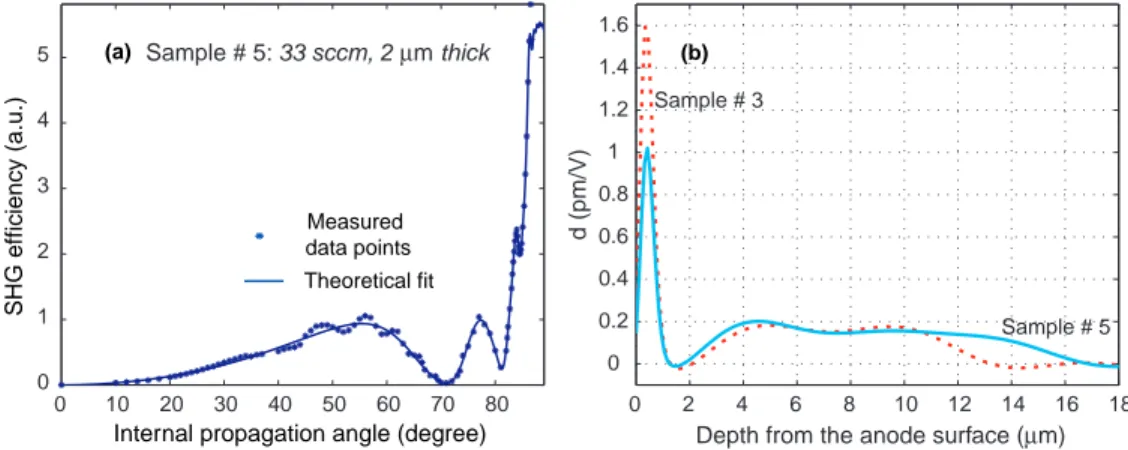
Finally, we investigated the effect of the film thickness on the induced nonlinearity profile. For this purpose, we poled sample #5, grown with a 33-sccm germane flow rate to a final thickness of 2 µm, in air at ~5 kV and 280 °C, for 10 min. Figure 5(a) shows the
measured calibrated MF curve for sample #5, and Fig. 5(b) the nonlinearity profile recovered from this curve. For comparison purposes, the nonlinearity profile of sample #3, which was grown at the same flow rate and poled under identical conditions but is thicker (4 µm), is also shown in Fig. 5(b). Note again that the nonlinearity peak is entirely contained in the film and the pedestal in the substrate. The two samples (# 3 and # 5) have very similar profiles, which was expected since they have the same material composition and were poled under the same conditions. However, the total depth of the nonlinearity is larger for sample #5 (~17 µm) than for sample #3 (~13 µm). We attribute this difference mostly to the fact that the 2-µm thick germanosilicate film in sample #5 acts as a weaker barrier for ion diffusion process than the 4-µm film in sample #3. Furthermore, we believe that this charge spreading is at the origin of the weaker peak d33 coefficient in sample #5 (1.02 pm/V, vs. 1.6 pm/V in sample #3). Again,
the theoretical MF curve computed from the recovered profile of Fig. 5(b) (solid curve in Fig. 5(a)) is in excellent agreement with the measured MF curve, and the calculated total voltage drop across the nonlinear profile of sample #5 (4.96 kV) agrees very well with the poling voltage (~5 kV). Measured data points Theoretical fit SHG efficiency (a.u.) (a)
Internal propagation angle (degree)
Sample # 5: 33 sccm, 2 µm thick
Depth from the anode surface (µm) Sample # 3 0 10 20 30 40 50 60 70 80 0 1 2 3 4 5 0 2 4 6 8 10 12 14 16 18 0 0.2 0.4 0.6 0.8 1 1.2 1.4 1.6 Sample # 5 (b) d (pm/V)
Fig. 5. Calibrated MF curve measured for (a) sample #5. The solid curves are the theoretical MF curves computed from the recovered d33(z) profiles. (b) The recovered optical nonlinearity depth profile of
samples #3 (red) and #5 (blue).
4. Conclusions
We have reported measurements of the nonlinearity spatial profile of thermally poled germanosilicate films deposited on fused-silica substrates by PECVD. These films are interesting because they exhibit a low propagation loss and because they were expected to have a stronger nonlinearity than poled undoped silica due to the presence of Ge, which increases the third-order susceptibility of the glass. Inferred profiles all exhibit a sharp peak ~0.5 µm beneath the anode surface, followed by a weaker pedestal of roughly constant amplitude and same sign down to a depth of 13–16 µm. These profiles are shallower and do not exhibit the sign reversal typical of poled undoped silica. These results suggest that during poling, the germanosilicate film significantly slows down the injection of positive ions from the anode surface into the structure. After optimizing the germane flow rate during deposition, the film thickness, and the poling time for maximum peak nonlinearity, we demonstrated a record peak nonlinear coefficient of ~1.6 pm/V, approximately twice as strong as the highest reliable value reported in a thermally poled fused silica glass. These findings are significant for the design of electro-optic devices using thermally poled germanosilicate thin films, especially for optimization of the overlap between the optical mode of the device and the nonlinear region.
Acknowledgments
A. Ozcan, M. J. F. Digonnet and G. S. Kino acknowledge the support of Litton Systems, Inc., a wholly owned subsidiary of Northrop Grumman. F. Ay and A. Aydinli acknowledge the support of Bilkent University Research Fund (Code: Phys-03-02) and The Scientific and Technical Research Council of Turkey, TUBITAK (Project: TBAG-U/85 (103T115)).
(C) 2004 OSA 4 October 2004 / Vol. 12, No. 20 / OPTICS EXPRESS 4708