S. Boll et al. (Eds.): MMM 2010, LNCS 5916, pp. 626–636, 2010. © Springer-Verlag Berlin Heidelberg 2010
Autostereoscopic Displays
R. Bertan Gundogdu, Yeliz Yigit, and Tolga CapinBilkent University, Computer Engineering Department 06800 Ankara, Turkey
{gundogdu,yyigit,tcapin}@cs.bilkent.edu.tr
Abstract. In this paper, we focus on the problem of how to visualize and browse 3D videos and 3D images in a media browser application, running on a 3D-enabled mobile device with an autostereoscopic display. We propose a 3D thumbnail representation format and an algorithm for automatic 3D thumbnail generation from a 3D video + depth content. Then, we present different 3D user interface layout schemes for 3D thumbnails, and discuss these layouts with the focus on their usability and ergonomics.
Keywords: Mobile Multimedia, 3D Thumbnails, 3D User Interfaces.
1 Introduction
Today mobile devices are becoming one of the main means to use multimedia in our daily life. It is now possible to send/receive multimedia messages, watch TV broad-casts, and perform basic videoconferencing on current-generation mobile devices. To further benefit from the advances in mobile multimedia processing hardware and software solutions, new levels of experiences will be required in mobile multimedia.
The European FP7 3DPHONE project [1] aims to develop applications enabling such a new level of user experience, by developing an end-to-end all-3D imaging mobile phone. The goal of this work is to build a mobile device, where all fundamen-tal functions are realized in 3D, including media display, user interface (UI), and personal information management (PIM) applications. Various solutions are needed for achieving this all-3D phone experience: including building of mobile autostereo-scopic displays, 3D images/video, 3D UIs, 3D capture/content creation solutions, compression, and efficient rendering.
Developing such an all-3D mobile phone requires building a solution that takes into account the entire user experience of a mobile phone, instead of merely putting separate solutions together. For example, 3D enabled phones already exist in the mar-ket, and various vendors have started to promote autostereoscopic displays on mobile devices. However, despite users’ clear interest in 3D technologies, simply providing 3D display capabilities is not sufficient, as it was demonstrated that the usability of these devices and applications have to be improved. To make the best use of the tech-nologies to support user experience, a new user interaction paradigm (an all-3D phone experience) will be needed, taking advantage of the latest advances on 3D graphics
rendering on mobile handheld platforms. User experience will be driven towards immersive 3D media, through the use of autostereoscopic displays and 3D interaction using sensors. This leads to a need for new concepts in 3D UI development.
We aim to address the question: what are the best design decisions for building an all-3D user experience on a mobile phone? To answer this question, we are currently constructing the hardware and software platforms of a prototype 3D phone device, which together provide an integrated environment allowing the implementation of the 3D based UIs and applications. We use the Texas Instruments’ OMAP 34x MDK [2] as the base platform of the 3D phone, and a two-view lenticular-based solution and a quasi-holographic display for output. The prototype also features two cameras for stereo capture, based on SGS Thomson’s VS6724 camera.
In this paper, we focus on the particular problem of how to visualize and browse 3D video and images in a media browser application, running on a mobile device with an autostereoscopic display. Particularly, we propose a 3D thumbnail-based approach for representing 3D media. We first present an algorithm for generating 3D thumb-nails that preserve the significant parts of the input 3D image. Then, we discuss dif-ferent 3D user interface layout schemes for a media browser application that makes use of these 3D thumbnails. We then discuss our solutions with the focus on their usefulness, and their ergonomics and comfort.
The paper is organized as follows: Section 2 reviews previous work on thumbnail generation, 3D video representation, and 3D user interface design, which are the es-sential components of our work. Section 3 describes our proposed approach on 3D thumbnail generation and 3D layouts. In Section 4, we present our initial results and discuss future directions of our research.
2 Previous Work
Our approach combines the three distinct problems: thumbnail generation, 3D video representation, and 3D user interaction steps. Therefore, we discuss each topic under a different subsection.
2.1 Thumbnail Representation
A major part of our approach is creation of thumbnails from 3D video content without losing perceivable elements in the selected original video frame. It is essential to preserve the perceivable visual elements in an image for increasing recognizability of the thumbnail. Our thumbnail representation involves the computation of important elements, and performing non-uniform scaling to the image. This problem is similar to the recently investigated image retargeting problem for mobile displays.
Various automatic image retargeting approaches have been proposed [3]. Firstly, retargeting can be done by standard image editing algorithms such as uniform scaling and manual cropping. However, these techniques are not an efficient way of retarget-ing: with uniform scaling, the important regions of the image cannot be preserved; and with cropping, input images that contain multiple important objects leads to con-textual information lost and image quality degrades. On the other hand, automatic cropping techniques have been proposed, taking into account the visually important
parts of the input image, which can only work for single object [4]. Another alterna-tive approach is based on the epitome, in which the image representation is in minia-ture and condensed version, containing the most important elements of the original image [5]. This technique is suitable even when the original image contains repetitive unit patterns. For creating meaningful thumbnails from 3D images/video, we have adopted a saliency-based system that preserves the image's recognizable features and qualities [3].
2.2 3D Video
A number of 3D imaging and video formats have recently been investigated. These formats can be roughly classified into two classes: N-view video formats and geome-try-enhanced formats. The first class of formats describes the multi-view video data with N views. For stereoscopic (two-view) applications, conventional stereo video (CSV) is the most simple format.
In the second class of 3D formats, geometry-enhanced information is added to the image. In the multi-view video + depth format (MVD) [6], a small number of sparse views is selected and enhanced with per pixel depth data. This depth data is used to synthesize a number of arbitrarily dense intermediate views for multi-view displays. One variant of MVD is Layered Depth Video (LDV), which further reduces the color and depth data by representing the common information in all input views by one central view and the difference information in residual views [7]. Alternatively, one central view with depth data and associated background information for color and depth is stored in an LDV representation to be used to generate neighboring views for the 3D display. Geometry-enhanced formats such as MVD or LDV allow more com-pact methods, since fewer views need to be stored. The disadvantage however is the intermediate view synthesis required. Also, high-quality depth maps need to be gener-ated beforehand and errors in depth data may cause considerable degradation in the quality of intermediate views. For stereo data, the Video-Depth format (V+D) is the special case. Here, one video and associated depth data is coded and the second view is generated after decoding.
Regarding the capabilities of current mobile devices, stereo formats CSV and V+D are the most likely candidates to be used for real-time applications. As the V+D for-mat is more flexible for generating new views, the thumbnail representation is based on this format in this study.
2.3 3D User Interfaces
There are numerous studies on 3D user interfaces, but very few of them target 3D UIs on mobile devices or offer solutions for 3D thumbnail layout problem in a media browser application. One rather early study on how to present information on a small scale display area is a work by Spence [8], which provides a bifocal display solution in which the information is presented in two different resolutions. A high resolution is used for a specific data element to provide details about that element and a low resolu-tion for the rest of the data elements that is enough for high-level view of each element. A 3D version of the bifocal display of Spence may be suitable for a media browser
application that uses 3D thumbnails so that the high resolution element will be a 3D thumbnail and the low resolution ones are 2D thumbnails or simplified versions.
A more recent design suitable for mobile devices is Cover Flow® by Apple [9]. It is originally designed to display album covers in the media player application, however, today it is used in many different applications to present photos, videos, web pages, etc. The structure can be considered as two stacks placed on both sides of the item in focus.
Lastly, a web browser extension named CoolIris® [10] incorporates 3D properties in its presentation for photo and video thumbnails. It uses a wall metaphor and places thumbnails on the wall as a grid. The grid has strictly three rows and the number of columns increases with the number of items. The viewport is tilted around the y-axis when scrolling horizontally through the thumbnails and perspective projection gives the depth perception while scrolling. Although the design is basically 2D, the tilting of viewport and perspective projection makes navigation faster by showing more items than a regular 2D grid. Loading items on the fly, instead of using pagination, also helps to increase the efficiency of navigation. A fundamental difference between this ap-proach and Cover Flow® is that this apap-proach does not focus on a particular item.
3 Proposed Solution
3.1 Overview of the System
Our system consists of a 3D thumbnail generation subsystem and a 3D user interface subsystem. Figure 1 shows the overview of our proposed solution.
Fig. 1. Overview of the system
3.2 Thumbnail Generation
The input of the thumbnail generation subsystem is a frame from the input 3D video, in the form of a depth image. Thus, two images are input to the system – an RGB color map, and a corresponding depth map approximating the depth of each pixel.
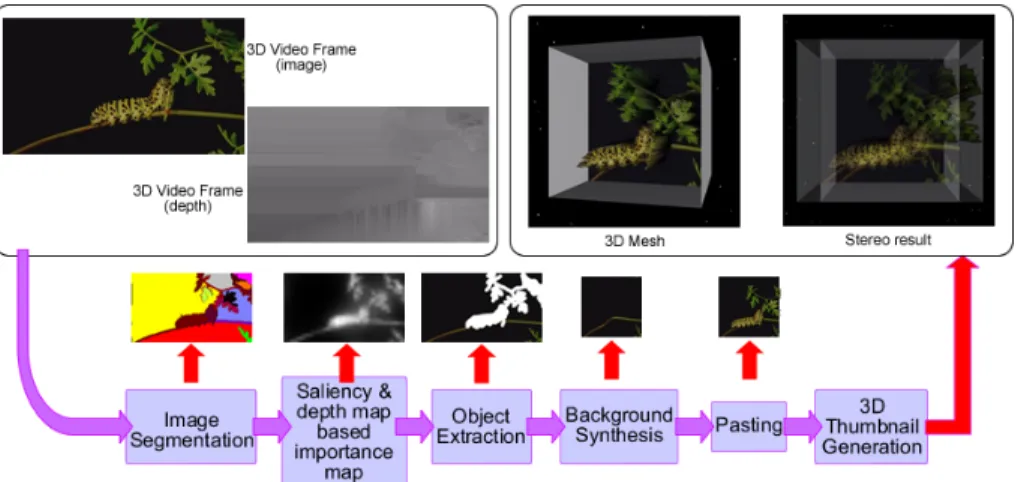
Our thumbnail generation approach is shown in Figure 2. The input color map is first segmented into regions in order to calculate each region’s importance, as ex-plained in Section 3.2.1 and 3.2.2. Our method then removes the important parts of the image, later to be exaggerated, and fills the gaps of the background using the technique described in Section 3.2.3. Afterwards, the filled background is resized to standard thumbnail size of 192 x 192. Then, important regions are pasted onto the resized background, as explained in Section 3.2.4. The final 3D thumbnail is gener-ated by constructing a 3D mesh, as described in Section 3.2.5.
Fig. 2. Overview of the 3D thumbnail generation system
3.2.1 Image Segmentation
We use the mean-shift image segmentation algorithm for separating the input image into regions. In addition to the mean-shift method [11], there are alternative segmen-tation methods such as graph-based [12] and hybrid segmensegmen-tation approaches [13]. Pantofaru et al. compares the three methods by considering correctness and stability of the algorithms [13]. The results of this work suggest that both the mean-shift and hybrid segmentation methods create more realistic segmentations than the graph-based approach with a variety of parameters. The results show that these two methods are also similar in stability. As the hybrid segmentation method is a combination of graph-based and mean-shift segmentation methods, and thus is more computationally expensive, we have chosen the mean-shift algorithm for its power and flexibility of modeling.
The mean-shift based segmentation method is widely used in the field of computer vision. This method takes three parameters together with the input image: spatial ra-dius hs, color radius hr and the minimum number of pixels M that forms a region. The
CIE-Luv color space is used in mean-shift algorithm, therefore the first step is to con-vert the RGB color map into Lαβ color space [14]. The color space has luminance, red-green and blue-yellow planes. These color planes are smoothed by Gaussian kernels.
Afterwards, for each pixel of the image with a particular spatial location and color, the set of neighboring pixels within a spatial radius hs, and color radius hr is determined
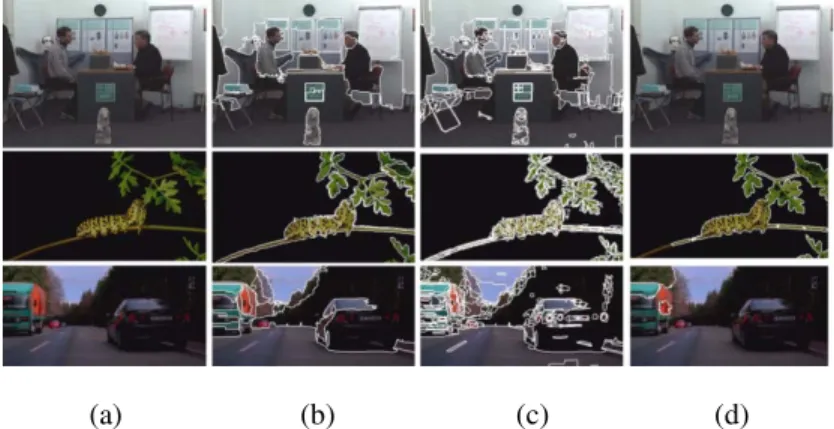
and labeled. Figure 3 shows the image segmentation results for different values of hs, hr
and M. In this work, we have chosen the parameters as shown in configuration (b).
3.2.2 Color and Depth Based Saliency Map
The next step computes an importance map from the input color map and depth map. The aim of the retargeting algorithm is to resize images without losing the important regions on the input image. For this purpose, we calculate the importance of each pixel, as a function of its saliency in the color map and the depth map. We compute the saliency based on color and depth differently, as described below.
(a) (b) (c) (d)
Fig. 3. Mean Shift Segmentation with different parameters. (a) Original Image; (b) hs = 7, hr = 6 and M = 800, number of regions: 31, 15, 19; (c) hs = 6, hr = 5 and M = 50, number of re-gions: 214, 268, 246; (d) hs = 32, hr = 30 and M = 150, number of rere-gions: 1, 7, 6.
Computation of Saliency Based on Color Map
Most of the physiological experiments verify that human vision system is only aware of some parts of the incoming information in full detail. The concept of saliency has been proposed to locate the points of interest. In this work, we apply the graph-based visual saliency image attention model [15]. There are two steps for constructing the bottom-up visual saliency model: constructing activation maps on certain feature channels and normalization. This method is based on the bottom-up computation framework because in complex scenes that hold intensity, contrast and motion, visual attention is in general unconsciously driven by low-level stimulus.
Feature extraction, activation and normalization of the activation map are three main steps of the graph-based visual saliency method:
• In the feature extraction step, the features such as color, orientation, texture, intensity are extracted from the input image through linear filtering and computa-tion of center-surround differences for each feature type.
• In the activation step, an activation map is formed from the feature maps pro-duced in step 1. A pixel with a high activation value is considered significantly different from its neighborhood pixels.
• In the last step, normalization of the activation map is performed, by normalizing the effect of feature maps, and summing them into the final saliency value of the pixel based on the color map.
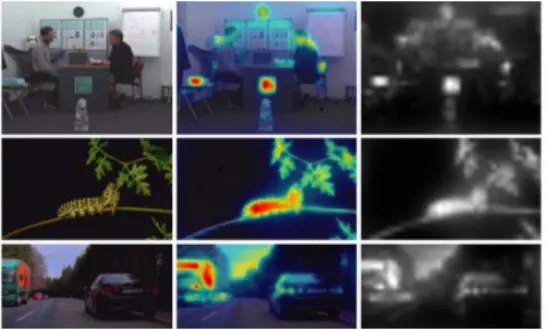
Figure 4 shows sample results that are based on graph-based visual saliency image attention method. The detailed explanation of the algorithm can be found in [15].
Computation of Saliency Based on Depth Map
We observe that depth is another factor to decide whether an object is of interest or should be ignored. In other words, closer objects should be more salient due to prox-imity to the eye position. Therefore, we also use the depth map to calculate depth
Fig. 4. Graph-based saliency map. a) Original image; b) salient parts of the image (red - most salient); c) resulting saliency map.
saliency for each pixel in the input image. The function below for computing the depth importance map, adapted from the work of Longurst et al. [16], uses a model of exponential decay to get a typical linear model of very close objects. Therefore, in the equation, d and AD are constants to approximate the linear model by the overall rate
of exponential decay [16]:
Computation of Overall Saliency Map
For each region that was computed as the result of the earlier segmentation step, we compute the overall saliency of the region, by averaging the sum of the color-based and depth-based saliency of pixels belonging to the region.
3.2.3 Background Resynthesis
The next steps after extracting important regions from the original color map are to resize the color map that has gaps to the standard thumbnail size, and to fill gaps with the information extracted from the surrounding area. This step adopts Harrison et al.’s inpainting method [17] that reconstructs the gaps with the same texture as the given input image by successively adding pixels from the image. The procedure is capable of reproducing large features from this input image, even though it only examines interactions between pixels that are close neighbors. Decomposing the input image into a feature set is avoided and the method could reproduce a variety of textures, making it suitable for this purpose.
3.2.4 Pasting of Visually Significant Objects
After extracting the important objects from the original color map and background resynthesis, the next step is to paste them onto the new background. We use a con-straint-based method to paste each important region due to their overall saliency value from the most salient to least [3]. The goal of the algorithm is to preserve the relative positions of the important regions in order to maintain certain perceptual cues and
keep the resized image’s layout similar to the original image. To achieve this, there are four constraints: positions of the important objects must stay the same, aspect ratios of the important objects must be maintained, the important objects must not overlap in the retargeted background if they are not overlapping in the original image and the background color of the important region must not change.
By using a decreasing order of the overall saliency, this step reduces the change in position and size of the important objects. Thus, from the most salient object to the least, the algorithm searches whether the four constraints are satisfied or not that are described above, and changes the size and position of the important object according to the original and target color map by calculating aspect ratio.
3.2.5 3D Thumbnail Creation
As a result of the previous step, two channels for the thumbnail are generated – the RGB thumbnail color map, and the corresponding depth map approximating the depth of each pixel. In the 3D thumbnail creation step, these color and depth maps are con-verted to a 3D mesh representation. This conversion is necessary, as the depth image representation has several drawbacks for the thumbnail case. Thumbnails are expected to be small in size, to allow several of them to appear simultaneously on display. Depth images also introduce image fitting problems such as matching the perspective of the 3D thumbnail and the rendered 3D scene, and the eye-separation value of the cameras. Another drawback is that using a 3D mesh is much more flexible in terms of 3D display usage. One can apply different object reconstruction methods to obtain the meshes and then render the scene for multiple view rendering.
For construction of the 3D mesh, we gather the depth values of every pixel on the thumbnail using the depth image and produce vertices for each pixel. Then we connect these vertices to form the mesh. Depth values of pixels are mapped to the depth values of vertices. To increase the contrast in depth values we use only the minimum and maximum depth values of pixels and normalize them to [0-1] interval. We then simplify the 3D mesh to obtain a model that can be rendered in real time on the mobile device.
3.3 3D User Interface Layout for Viewing Thumbnails
One of the main reasons, and perhaps the most important one, to use thumbnails is to display as many of the items as possible at the same time. Therefore, the thumbnails are expected to be small, but still reasonably large to let the user have an idea on what is "inside" each item. We consider this principle while designing our 3D media browser user interface. We aim to make use of the 3D content and the autostereo-scopic 3D display properties, for viewing the generated 3D thumbnails.
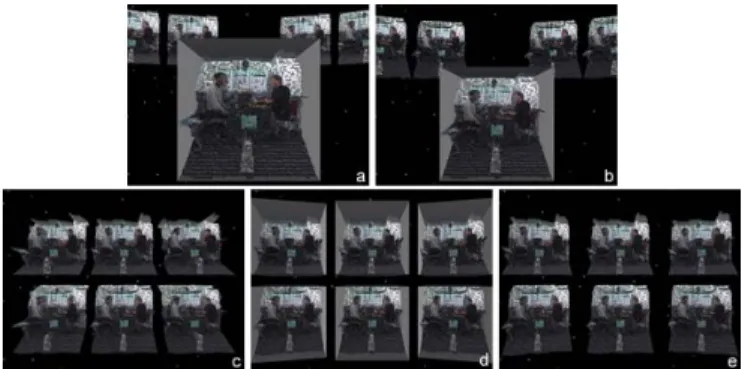
We extend the card metaphor to support 3D cards and design two essentially dif-ferent layouts, and experiment with various variations of them. The first design – i.e. linear design – focuses on one of the items by centering it on the screen and display-ing the other items at the back (Figure 5-a). The second design (Figure 5-b) – i.e. grid-based design – treats every item equally forming a grid structure. The following dis-cusses the variations we apply to these main designs:
• Rotation: in the linear design, we form a circular list (Figure 5-a) with the items at the back; in the grid-based design, all the items are forming two circular (Figure 5-d) or linear (Figure 5-c) lists that are placed on top of each other.
• Framed Thumbnails: we consider the use of frames around thumbnails to en-hance the depth perception of 3D content and to establish boundaries between thumbnails (Figure 5-d and Figure 5-e).
• Depth: the initial depth values of vertices of the mesh are mapped to [0-1] in-terval, but in order to provide a better 3D perception on the autostereoscopic display, we scale each item's depth values by different values in a search for the best value (Figure 5-a and Figure 5-b).
Fig. 5. Design alternatives for 3D user interface layout
4 Discussion
3D Thumbnail Generation
We use the automatic retargeting method for creating 3D thumbnails. We have se-lected this approach because we aim to preserve the multiple important objects’ origi-nal position, importance and background color on the given color map. As discussed, there are alternative methods for creating thumbnails such as cropping and scaling. However, the results of earlier evaluation tests for the 2D case, performed by Setlur et al., show that neither cropping nor scaling preserves recognizability as much as the retargeting method [3].
However, the retargeting method has disadvantages and limitations: the semantic relationships between objects aren’t preserved; important regions that are resized independently by their overall saliency lead to wrong relative proportions and incor-rect handling of repeated textures if the background is complex.
Although we use a simple method for creating 3D thumbnails for our system, the results are reasonable. It is also possible to use computer vision techniques that derive 3D meshes from images and GPU-based computer graphics methods that give 3D view to 2D images. We’ll investigate these methods in our future work, and perform subjective and ergonomic evaluation of these alternatives.
3D Layout
We experiment with different 3D layout options, and identify a number of design suggestions for producing a 3D media interface with high usability. Subjects in our initial tests have reported that the use of rotation in grid-based layout provides a cleaner view with less overlap. In the absence of rotation, the depth effect is more
noticeable in thumbnails that are out of focus. Subjects have also reported that in the grid-based design, use of frames increases the 3D perception in some cases, but it also increases the eye strain, thus frameless design was more comfortable than the framed design in grid-based layout. On the other hand, in the linear design, the use of frames in the centered thumbnail yields significantly better perception in 3D than non-frame representation.
For the linear design option, we conclude that the average depth value scaling val-ues in the interval [1.5-2] provide a better depth perception on our auto-stereoscopic displays. The scaling values below this interval are still usable, but do not provide a good depth perception. Scaling values above are also usable until a certain limit, but they increase the screen space needed to show the thumbnail because of the increasing perspective effect. As for the background items in the linear-based design, the thumb-nails need to be small in size, however, smaller size than a threshold decreases the depth perception.
As a future work, we plan to conduct several ergonomics tests on the UI part of this study as well as experimenting with different UI designs that use 3D thumbnails.
Acknowledgments
This work is supported by FP7 ICT All 3D Imaging Phone (3DPHONE) project. The depth images shown in this work are courtesy of Fraunhofer Heinrich Hertz Institute.
References
1. European 3DPHONE Project Homepage (2009), http://www.the3dphone.eu 2. Texas Instruments ZoomTM OMAP34x MDK (2009), http://www.omapzoom.org 3. Setlur, V., Takagi, S., Raskar, R., Gleicher, M., Gooch, B.: Automatic Image Retargeting.
In: International Conference on Mobile and Ubiquitous Multimedia, Christchurch, New Zealand, pp. 59–68 (2005)
4. Suh, B., Ling, H., Bederson, B., Jacobs, D.: Automatic Thumbnail Cropping and its Effec-tiveness. In: ACM Symposium on User interface Software and Technology, Vancouver, Canada, pp. 95–104 (2003)
5. Jojic, N., Frey, B., Kannan, A.: Epitomic Analysis of Appearance and Shape. In: IEEE In-ternational Conference on Computer Vision, Nice, pp. 34–41 (2003)
6. Smolic, A., Müller, K., Dix, K., Merkle, P., Kauff, P., Wiegand, T.: Intermediate View In-terpolation based on Multi-View Video plus Depth for Advanced 3D Video Systems. In: IEEE International Conference on Image Processing, San Diego, CA, pp. 2448–2451 (2008)
7. Müller, K., Smolic, A., Dix, K., Kauff, P., Wiegand, T.: Reliability-Based Generation and View Synthesis in Layered Depth Video. In: Proc. IEEE International Workshop on Mul-timedia Signal Processing (MMSP 2008), Cairns, Australia, pp. 34–39 (2008)
8. Spence, R., Apperley, M.: Data Base Navigation: an Office Environment for the Profes-sional. Journal of Behaviour and Information Technology 1(1), 43–54 (1982)
9. Apple, Inc. iPod Touch Description (2009), http://www.apple.com/ipodtouch 10. Cooliris, Inc. (2009), http://www.cooliris.com
11. Comaniciu, D., Meer, P.: Mean shift: A robust Approach Toward Feature Space Analysis. IEEE Trans. on Pattern Analysis and Machine Intelligence 24(5), 603–619 (2002) 12. Felzenszwalb, P., Huttenlocher, D.: Efficient Graph-Based Image Segmentation.
Interna-tional Journal of Computer Vision 59(2), 167–181 (2004)
13. Pantofaru, C.: A Comparison of Image Segmentation Algorithms. Technical Report, Pitts-burgh, PA (2005)
14. Mirmehdi, M., Petrou, M.: Segmentation of Color Textures. IEEE Transactions on Pattern Analysis and Machine Intelligence 22(2), 142–159 (2000)
15. Harel, J., Koch, C., Perona, P.: Graph-Based Visual Saliency. In: Advances in Neural In-formation Processing Systems, Cambridge, MA, vol. 19, pp. 545–552 (2007)
16. Longhurst, P., Deba Hista, K., Chalmers, A.: A GPU Based Saliency Map For High-Fidelity Selective Rendering. In: International Conference on Computer Graphics, Virtual Reality, Visualisation And Interaction, Cape Town, South Africa, pp. 21–29 (2006) 17. Harrison, P.: A Non-Hierarchical Procedure for Re-Synthesis of Complex Textures. In: