PREPARATION AND CHARACTERIZATION OF ULTRA-THIN FILMS CONTAINING Au AND Ag NANOPARTICLES USING LAYER-BY-LAYER
DEPOSITION TECHNIQUE
A THESIS
SUBMITTED TO THE DEPARTMENT OF CHEMISTRY AND THE INSTITUTE OF ENGINEERING AND SCIENCES
OF BİLKENT UNIVERSITY
IN PARTIAL FULFILLMENT OF THE REQUIREMENTS FOR THE DEGREE OF
MASTER OF SCIENCE
By
CAN PINAR CÖNGER July 2009
I certify that I have read this thesis and that in my opinion is it is fully adequate, in scope and quality, as a thesis of the degree of Master in Science
... Prof. Dr. Şefik Süzer (Principal Advisor)
I certify that I have read this thesis and that in my opinion is it is fully adequate, in scope and quality, as a thesis of the degree of Master in Science
... Prof. Dr. Duygu Kısakürek
I certify that I have read this thesis and that in my opinion is it is fully adequate, in scope and quality, as a thesis of the degree of Master in Science
... Assist. Prof. Dr. Oğuz Gülseren
I certify that I have read this thesis and that in my opinion is it is fully adequate, in scope and quality, as a thesis of the degree of Master in Science
... Assist. Prof. Dr. Dönüş Tuncel
I certify that I have read this thesis and that in my opinion is it is fully adequate, in scope and quality, as a thesis of the degree of Master in Science
... Dr. Gülay Ertaş
Approved for the Institute of Engineering and Science
……….. Prof. Dr. Mehmet Baray
ABSTRACT
PREPARATION AND CHARACTERIZATION OF ULTRA-THIN FILMS CONTAINING Au AND Ag NANOPARTICLES USING LAYER-BY-LAYER
DEPOSITION TECHNIQUE
CAN PINAR CÖNGER M.S. in Chemistry
Supervisor: Prof. Dr. Şefik Süzer July, 2009
The main objective of this thesis is to investigate the layer-by-layer deposited polyelectrolyte and polyelectrolyte/metal nanoparticle films by using X-ray Photoelectron (XPS) and Optical Spectroscopy (UV-Vis).
Within this purpose, in the first part of the study, layer-by-layer deposited single and oppositely charged bilayered films are investigated by XPS. To extract additional information in the molecular level, the samples are analyzed while applying an external voltage bias. It is shown that applying external electrical stimuli to a single polyelectrolyte layer coated Si/SiO2 system responds to the change in the polarity by molecular rearrangements, evidenced by the changes only in the intensity of the corresponding –N+(1s) peak.
In the second part of the study, metal nanoparticle (Au and/or Ag) incorporated polyelectrolyte films are investigated by optical spectroscopy. Within this frame, multilayer gold and silver nanaoparticle/polyelectrolyte films are prepared both separately and in bimetallic form. In order to get further understanding about the optical responses of single type of metal nanoparticle incorporated systems, several experimental approaches are followed. These approaches also enable us to control and manipulate the optical properties of these compact structures.
The last part focuses on incorporation of metallic ions into layer-by-layer assembled polyelectrolyte matrices through ion-exchange method. It is shown that metal ions can be incorporated and subsequently reduced within this polymer matrix by UV or X-ray irradiation and can also form nanoparticles.
Keywords: Layer-by-Layer Deposition, Polyelectrolytes, Au and Ag Nanoparticles, Surface Plasmon Resonance, Interlayer Interparticle Interaction, Ion-Exchange, XPS.
ÖZET
KATMAN-KATMAN KAPLAMA YÖNTEMİYLE Au VE Ag NANOPARÇACIKLARI İÇEREN ULTRA-İNCE FİLMLERİN
HAZIRLANMASI VE KARAKTERİZASYONU
CAN PINAR CÖNGER Kimya Yüksek Lisans Tezi Danışman: Prof. Dr. Şefik Süzer
Temmuz 2009
Bu tezin ana amacı katman-katman kaplama yöntemiyle kaplanan polielektrolit ve polielektrolit/metal nanoparçacık çiftlerinin X-ışını Fotoelektron (XPS) ve Optik Spektroskopi (UV-Vis) yöntemleriyle incelenmesidir.
Bu amaç kapsamında, çalışmanın ilk kısmında katman-katman kaplama yöntemiyle kaplanan tek ve zıt yüklü iki polielektrolit katmanlı filimler XPS yöntemiyle incelenmiştir. Ayrıca, moleküler düzeyde daha fazla bilgi edinebilmek amacıyla, örneklere dışarıdan voltaj uygulanmıştır. Si/SiO2 alttaşı üzerine kaplanan tek bir polielektrolit katmanı dışarıdan elektriksel olarak uyarılmış ve bu sistemin değişken polariteye bağlı olarak moleküler olarak yeniden düzenlendiği, ilgili -N+(1s) tepeciklerindeki intensite değişimleriyle kanıtlanmıştır.
Çalışmanın ikinci kısmında, metal nanoparçacık (Au ve/veya Ag) dahil edilmiş polielektrolit filmleri optik spektroskopik yöntemle incelenmiştir. Bu
çerçevede, çok katmanlı altın ve gümüş nanoparçacık/polielektrolit filmleri ayrı ayrı ve bimetalik formlarda hazırlanmıştır. Tek tip nanoparçacık dahil edilmiş polielektrolit filmlerinin optik özellikleri hakkında daha fazla bilgi edinebilmek amacıyla, birkaç deneysel yaklaşım takip edilmiştir. Bu yaklaşımlar bize aynı zamanda bu çok katmanlı yapıların optik özelliklerini kontrol etme ve yönlendirme olanağını sağlamıştır.
Çalışmanın son kısmı iyon değişimi yöntemiyle metal iyonları dâhil edilmiş katman-katman kaplama metoduyla hazırlanmış polielektrolit matrislerine odaklanmıştır. Metal iyonlarının sisteme ne derece dahil edilebildiği, UV ve/veya X-ışınlarına maruz bırakılarak polimer matrisi içerisinde indirgenmesi ve nanoparçacık oluşumu ile incelenmiştir.
Anahtar Kelimeler: Katman-Katman Kaplama, Polielektrolitler, Au ve Ag Nanoparçacıkları, Yüzey Plasmon Rezonans, Katmanlar Arası Etkileşim, XPS.
LIST OF ABBREVATIONS
LbL: Layer-by-Layer LB: Langmuir-Blodgett NP: Nanoparticle
PAH: Poly(allyamine hydrochloride) PEI: Poly(ethylenimine)
PMMA: Poly(methyl methacrylate) PSS: Poly(sodium 4-styrene-sulfonate) QCM: Quartz Crystal Microbalance SAM: Self Assembled Monolayer SEM: Scanning Electron Microscope SPR: Surface Plasmon Resonance UV-Vis: Ultraviolet-Visible WCA: Water Contact Angle
ACKNOWLEDGEMENTS
At the end of this comprehensive scientific study and education, I want to express my deepest thanks to Prof. Şefik Süzer for his supervision and guidance throughout these studies for the last three years.
I would thank to our past and current lab group members Hikmet Sezen, Dr. Ivalina Abramova, Eda Özkaraoğlu and special thanks to Hacı Osman Güvenç and İlknur Tunç.
I would also like to thank to Chemistry Department members Emine Yiğit and Ethem Anber.
I will always remember my dear friends Esra Gülser, S. Altuğ Poyraz, Mustafa Sayın, Abidin Balan, Alper Kılıklı, Halil İbrahim Okur, Fahri Alkan.
My family has a special meaning in my life. I am grateful to my mother who watches over me like an angel, my father for his endless moral support, my sister and my brother in law for their unconditional love and sacrifice.
TABLE OF CONTENTS
1. INTRODUCTION...1
1.1 Layer-by-Layer Deposition...1
1.1.1 Polyelectrolytes...3
1.1.2 Polyelectrolyte Adsorption and Multilayer Formation...5
1.1.3 Ion-Exchange Chemistry in Multilayers...8
1.2 Layer-by-Layer Assembly of Nanoparticles...9
1.2.1 Optical Properties of Metal Nanoparticles...10
1.2.1.1 Surface Plasmon Resonance...10
1.2.1.1.1 Size Dependency...11
1.2.1.1.2 Composition Dependency...12
1.2.1.1.3 Surrounding Medium Dependency...14
1.2.2 Optical Responses of Metal Nanoparticle Incorporated LbL Films...14
1.3 X-ray Photoelectron Spectroscopy...17
1.3.1 Principles...18
1.3.2 Applications of XPS in Polyelectrolyte Multilayers...21
1.4 Aim of the Study...25
2. EXPERIMENTAL...26
2.1 Materials...26
2.2 Instrumentations...26
2.3.1 Preparation of Polyelectrolyte Multilayers on Silicon
Surfaces...27 2.3.2 Preparation of Polyelectrolyte/Metal Nanoparticle (Au and/or Ag) Films...28
2.3.2.1 Preparation of Citrate-Capped Gold Nanoparticles...29 2.3.2.2 Preparation of Citrate-Capped Silver Nanoparticles...29 2.3.2.3 Cyanide Treatment for Gold Nanoparticle/Polyelectrolyte
Systems...29 2.3.3 Incorporation of Au and/or Ag Ions into Polyelectrolyte Multilayers and Their In-situ Photochemical Reduction...30
3. RESULTS AND DISCUSSION...32 3.1 Characterization of Layer-by-Layer Assembled Ultra-Thin Polyelectrolyte Films on Si/SiO2 Substrate...32
3.1.1 Water-Contact-Angle Measurements...32 3.1.2 XPS Characterization of Single Layered Polyelectrolyte on Si/SiO2 Substrate...33 3.1.3 Angle Dependent XPS Characterization of Single Layered
Polyelectolyte Film on Si/SiO2 Substrate...38 3.1.4 XPS Characterization of Bilayered Polyelectrolyte Film on Si/SiO2 Substrate...40 3.1.5 Angle Dependent XPS Characterization of Bilayered Polyelectrolyte Film on Si/SiO2 Substrate...42 3.2 Optical Response of Metal Nanoparticle Incorporated Polyelectrolyte Multilayers...44
3.2.1 Incorporation of Au Nanoparticles between Polyelectrolyte
Layers...44
3.2.2 Incorporation of Ag Nanoparticles between Polyelectrolyte Layers...50
3.2.3 Combinations of the Au-Ag Nanoparticles between Polyelectrolyte Layers...50
3.2.4 Cyanide Treatment for Gold Nanoparticle/Polyelectrolyte Systems...52
3.3 Incorporation of Au Ions into Polyelectrolyte Layers through Ion-Exchange...56
3.3.1 Incorporation of Au Ions into LbL Assembled Polyelectrolyte Matrices through Ion-Exchange...57
3.3.2 UV-Induced Reduction of Au Ions in Polyelectrolyte Matrices...57
3.3.3 X-ray Induced Reduction of Au Ions in Polyelectrolyte Matrices...62
4. CONCLUSIONS...66
LIST OF FIGURES
Figure 1. Illustration of the effect of the ionic strength on polyelectrolyte
shape...4 Figure 2. (A) Schematic representation of polyelectrolyte adsorption on a substrate. Steps 1-3 depict the polycation and polyanion adsorption respectively. Steps 2-4 show washing processes. (B) Molecular illustration for polyelectrolyte deposition on a negatively charged substrate. (C) Molecular structures for the most commonly used polyelectrolytes: Poly(allylamine hydrochloride) and Poly(stryrene sulfonate) sodium salt...7 Figure 3. (a) Schematic representation for the metal nanoparticles that are interacting with the electromagnetic radiation. (b) Oscillation modes for a metal nanorod: Transverse and longitudinal oscillations respectively...12 Figure 4. Schematic representation of a typical XPS set-up...19 Figure 5. Illustration showing the variation of the depth length as a function of the take-off angle...20 Figure 6. Survey spectrum of a bilayered Si/SiO2 system...22 Figure 7. Schematic diagram of a DC biased XPS set-up...27 Figure 8. Schematic representation for introducing the gold ions into polyelectrolyte multilayers and their subsequent reduction...31 Figure 9. Water-Contact-Angle measurements after deposition of each PAH/PSS layers...32 Figure 10. XP spectrum of a single polyelectrolyte (PAH) on Si/SiO2 substrate recorded under -10 V and +10 V external bias...35 Figure 11. Schematic representation of the measured potentials by XPS when the sample is under (a) -10 V and (b) +10 V external bias...36 Figure 12. The curve-fitted N1s region with two components (-N+), (-N) and their corresponding areas in units of total counts and full-width-half-maximum (FWHM) values in eV under negative and positive external bias for single PAH layer...38 Figure 13. Schematic representation of the rearrangement of the positively charged ammonium groups upon switching the sign of the potential of the substrate from -10V to +-10V...37
Figure 14. XP spectrum of a single polyelectrolyte (PAH) layer deposited Si/SiO2 sample showing the regions of C1s, N1s and Si2p, recorded at 900 and 300 electron take-off angle...40 Figure 15. XP spectrum of a single PAH and a single PSS layers on Si/SiO2
substrate recorded under -10 V and +10 V external...41 Figure 16. The curve-fitted N1s region with two components (-N+), (-N) and their corresponding areas in units of total counts and full-width-half-maximum (FWHM) values in eV under negative and positive external bias for single PAH + single PSS layer...42 Figure 17. Intensity ratios of the corresponding peaks at 900 and 300 electron take-off angles plotted against 1/sin (electron take-take-off angle) for one single PAH and one single PAH + one single PSS layers...43 Figure 18. UV-Vis spectra of (PAH/Au NP)6 film on a glass surface...45 Figure 19. UV-vis absorption spectra of (a) gold nanoparticle solution and (b) layer-by-layer assembled gold nanoparticle/polyelectrolyte film
(PAH/Au NP/PAH)...46 Figure 20. (a) UV-Vis spectra of (PAH/Au NP)6 (b) Graph showing the relationship between area under UV peak and the number of metal layers...47 Figure 21. UV-Vis spectra of a one PAH layer + one Au nanoparticle layer with different deposition times...48 Figure 22. UV-Vis spectra of (a) (PAH/Au)2 (b) (PAH/Au/PAH/PSS/PAH/Au) (c) (PAH/Au(PAH/PSS)2PAH/Au)...49 Figure 23. (a) UV-Vis spectra of (PAH/Ag NP)6 (b) Graph showing the relationship between area under UV peak and number of metal layers...51 Figure 24. UV-Vis spectra of (a) (PAH/Ag/PAH/Au)2 (b) (PAH/Au/PAH/Ag)2
film...52 Figure 25. Absorption intensities plotted against time for 0.01 M KCN treated (a) (PAH/Au/PAH/PSS) (b) (PAH/Au/PAH/PSS/PAH) and (c) (PAH/Au/(PAH/PSS)2) films...54 Figure 26. UV-Vis spectra for (a) (PAH/Au)2 film and (b) 0.01M KCN treated (PAH/Au)2 film (c) Absorption intensity plotted against time for a 0.01M KCN treated (PAH/Au)2 films...55
Figure 27. XPS survey spectra of (a) HAuCl4 solution treated (PEI/PSS/PAH) film (b) HAuCl4 solution treated (PEI/PSS/PAH) film + PAH/PSS...58 Figure 28. (I) SEM image of a patterened (PEI/PSS/PAH/HAuCl4) film irradiated with UV light (II) UV-vis spectra of (a) (PEI/PSS/PAH/HAuCl4) (b)
(PEI/PSS/PAH/HAuCl4/PAH) (c) (PEI/PSS/PAH/HAuCl4/PAH/PSS) films
irradiated with UV light...59 Figure 29. UV-Vis absorption spectra of (I) PEI/PSS/PAH/HAuCl4 film irradiated with UV light (a) at room temperature (b) 50ºC and (II)
PEI/PSS/PAH/HAuCl4/PAH/PSS film irradiated with UV light (a) at room
temperature (b) 50ºC...61 Figure 30. XPS spectra of Au4f region corresponding to (a) PEI/PSS/PAH/HAuCl4 (b) PEI/PSS/PAH/HAuCl4/PAH and (c) PEI/PSS/PAH/HAuCl4/PAH/PSS
films...64 Figure 31. XPS survey spectra of (a) PEI/PSS/PAH/HAuCl4, (b)
PEI/PSS/PAH/HAuCl4/PAH/PSS and (c) UV light irradiated
1. INTRODUCTION
Surface coating has always been a very important synthetic route for introducing new functionalities to the materials‟ surfaces, while conserving the bulk features of the underlying support. Developing new strategies for surface coating opened an interdisciplinary field for scientists and engineers that embrace polymeric, organic, inorganic and biological components. From the technological aspect, it is always desirable to introduce multi-functionalities to the surfaces. Polymeric materials attracted particular attention for the surface modification because of the known versatility of polymers. A very recent approach fulfills the expectations of preparing functional surfaces where arrangements of organic molecules can be controlled in nanoscopic level. The method introduces deposition of single molecular layers in a consecutive manner to form multicomposite structures, the so-called “Layer-by-Layer (LbL) Deposition”.
1.1 Layer-by-Layer Deposition
For about 60 years, new approaches aim to tailor the materials‟ surfaces are dominated by the Langmuir-Blodgett (LB) technique. In this method, monolayers are first formed on a water interface and then transferred onto a solid support subsequently.1 In the late 1960s, by using LB technique, Kuhn and co-workers pioneered fabrication of synthetic heterostructures of organic molecules.2 They demonstrated that monomolecular layer systems can form functional units which exhibit different properties than individual layers. They also showed for the first time
that individual layers can be manipulated in nanoscale by using donor and acceptor dyes in different layers of the LB films.
However, scientists were seeking for an alternative method for thin-film formation since LB technique suffered from the limitations with respect to substrate size, topology and film stability. In 1966, a promising work was proposed by Iler where multilayer structures can be constructed by using charged inorganic colloids.1 Although the work did not attract much attention of scientists at that time, it created the basic principles of multilayer formation processes for next generation experiments.
In the early 1990s, Decher‟s group introduced a technique for the fabrication of the multicomposite films which is based on the electrostatic attraction between the oppositely charges species.1,3,4 The method has encountered a strongly increasing interest for establishing nanoarchitecture films due to the ease of the process and the independency on nature, size and topology of the substrate. Moreover, the technique has proven its usefulness, in a wide variety of charge supporting building block materials like macromolecules,2 biomacromolecules such as proteins and DNA,5 colloidal particles, etc. Complex functionality of layer-by-layer assembled films give application access by tailoring the surface interactions and choosing materials used such as light-emitting thin films, permselective gas membranes, electrochromic films, electrocatalysis, sensors, anti-corrosive coatings, etc.2 The basic building blocks of the LbL technique are the charged polyelectrolytes.
1.1.1 Polyelectrolytes
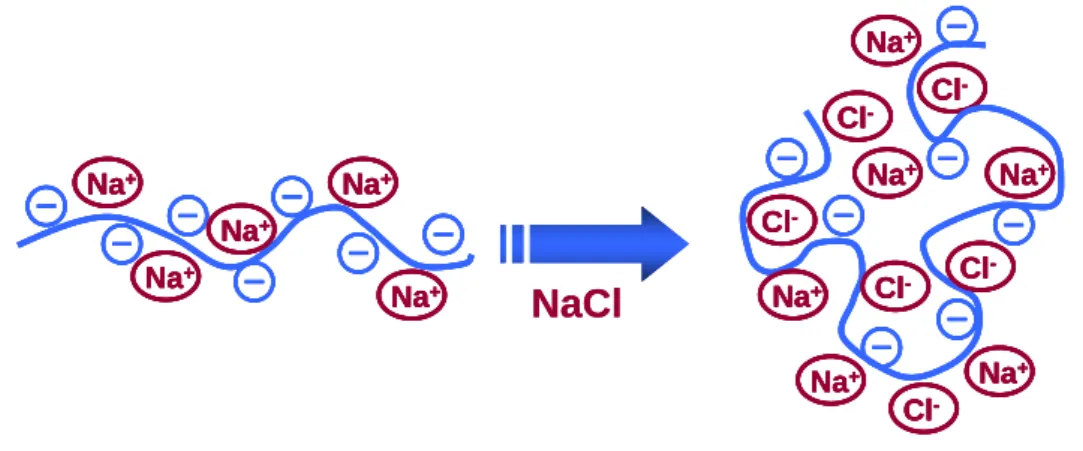
Polyelectrolytes have found numerous applications in the fields of science and engineering as well as their functions in cellular mechanisms in the form of proteins, polypeptides and nucleic acids. Applications in the field of chemistry mainly focused on polymer interface, materials, analytical and colloidal chemistry. A polyelectrolyte is defined as a macromolecular species that dissociates into a charged polymeric molecule when it is placed into an ionizing solvent. In order to conserve the electroneutrality, dissociation is accompanied by smaller oppositely charged counterions to neutralize the charge on the repeating unit.6-8 Ionic strength of the solution is an important factor for tuning the form of the polyelectrolyte. As it is depicted in Figure 1, if the ionic strength of the solution is low, this macromolecular specie tends to be in its most expanded form owing to the intramolecular repulsion on each monomeric unit.9 Conversely, in the high ionic strength solutions, a polyelectrolyte becomes more coiled due to the screening effects of polymer charges by the excess number of counterions in the solution. The significance of this physical property of a polyelectrolyte has been, and will continue to be a major study for experimental and theoretical scientists. The degree of charge screening can be tuned in order to control the thickness, uniformity, stability and permeability of polyelectrolytes and their corresponding layer-by-layer assembled composite structures.
Complexation ability of oppositely polyelectrolytes is an important aspect in terms of the similarities between polyelectrolyte complexes and their corresponding multilayer structures. Schlenoff and co-workers showed that polyelectrolytes and
Na+ Na+ Na+ Na+ Na+ Cl -Na+ Na+ Na+ Na+ Na+ Na+ Cl -Cl -Cl -Cl -Cl
-NaCl
Na+ Na+ Na+ Na+ Na+ Na+ Na+ Na+ Na+ Na+ Na+ Na+ Na+ Na+ Na+ Cl -Na+ Na+ Na+ Na+ Na+ Na+ Cl -Cl -Cl -Cl -Cl -Cl -Cl -Na+ Na+ Na+ Na+ Na+ Na+ NaNa++ Na+ Na+ Na+ Na+ Cl -Cl -Cl -Cl -Cl -Cl -Cl -Cl -Cl -Cl-NaCl
Figure 1. Illustration of the effect of the ionic strength on polyelectrolyte shape.10
their multilayer structures contribute to similar characteristics like internal structure, physical structure and morphology.11 Charges on the monomeric units can be balanced by either “intrinsic compensation” or “extrinsic compensation”. The term intrinsic compensation refers to balancing the charge units of polymer chain with an oppositely charged polyelectrolyte. However, in the presence of an external salt solution, salt counterions tend to equilibrate the net charge by entering the bulk of the complex and convert it to extrinsically compensated state.12 Polyelectrolyte multilayers share the same properties where they form structured and compatible depositions on different substrates. It has been also shown that polyelectrolyte solutions and their multilayer structures can not even be distinguished by X-ray diffraction method because of the highly interpenetration properties of multilayer complexes in molecular level because of the absence of Bragg peaks.12
Due to the ability to reach any pores or cracks on supporting surface without blocking their openings2, polyelectrolytes are superior on ready made solids or colloidal complexes on assembly processes. Beside these accessibility characteristics, polyelectrolytes have found numerous application areas like
ultrafiltration membranes, fuel cell membranes, environmental detectors and chemical sensors, etc.2
1.1.2 Polyelectrolyte Adsorption and Multilayer Formation
Interfacial properties of the materials are still great challenge for scientists. Polymer adsorption provides prevailing tools for investigating the interfacial properties. Although the thickness of a polymer layer depends on the nature of the substrate and polymer, it is always restricted by the amount of adsorbed polymer.13 If adsorption process is applied in a dilute solution, the size of a polymer layer does not surpass the polymer size in the bulk solution. This limitation brings about that thick films can not be constructed by using simple adsorption in molecular level. By using layer-by-layer deposited multilayer concept, one can obtain relatively thick films with a rather well-controlled thickness in molecular level. This perception introduces most versatile and efficient ways for the formation of films with a well-controlled thickness and necessary characteristics.
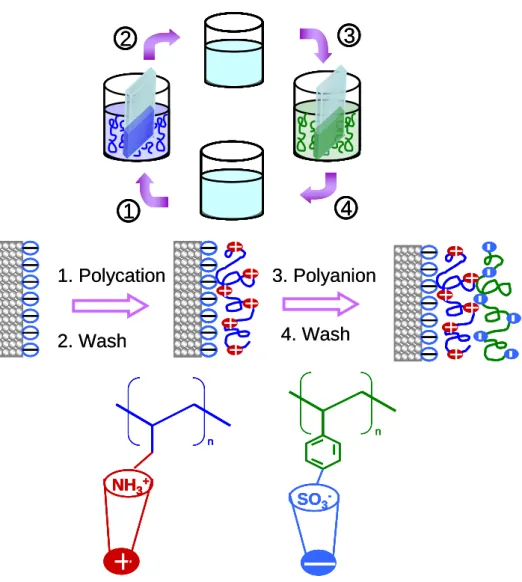
Inversion and successive renovation of the surface properties is a key for a successful deposition of multilayer films. The method is very simple and versatile as demonstrated in Figure 2 for subsequent deposition of polycation (positively charged)-polyanion (negatively charged) couples on a negatively charged substrate. The process is driven by strong electrostatic forces between charged substrate and oppositely charged species that is prepared from its solution. Single monomolecular layers can be constructed alternately on any charged objects independently from its nature, size and topology. A schematic representation of multilayer formation depicts the adsorption of a polycation and polyanion on a negatively charged substrate, respectively. Two common polyelectrolytes are used in the illustration as building
blocks; Poly(allylamine hydrochloride) as a polycation and poly(styrene sulfonate) as a polyanion (Figure 2C). Because polyelectrolytes can reach any pores or cracks on substrate and coat them without clogging their openings, surface charge is overcompensated by the adsorbed polymer layer in each deposited layer. ζ potential measurements also verifies this charge overcompensation,14 thus one can adsorb another polymer layer that is oppositely charged. Concentrations of the polyelectrolyte solutions are typically in the ranges of several milligrams per milliliters. The used amounts in multilayer fabrications are much larger than the required. This strategy is followed in order to ensure that solutions do not become exhausted during the construction of films involving hundreds of layers.
After adsorption of each layer, washing procedure is used in order to remove the weakly bounded molecules which also stabilize the adsorbed polymer layers.15 This process also ensures no free polyelectrolytes interact in solution with other components. Different deposition times are reported in the literature from minutes to hours. In the case of polyelectrolyte adsorption, several minutes are sufficient to terminate the deposition step15,16 where for metallic cluster e.g. gold colloids, hours are needed depending also on their concentrations.17,18
In the LbL processing, most commonly used substrates for the deposition are flat surfaces. In order to coat large surfaces, new methods were utilized. For this purpose, Schlenoff introduced the spraying method where solutions of oppositely charged polyelectrolytes are sprayed onto a vertically held sample in an alternative fashion.19 Similarly, spin coating method was introduced to LbL deposition that was demonstrated by Hong20,21 and by Weng.22 In both approaches, the amount of polyelectrolyte solution to coat the large surfaces is much less then the classical
layer-by-layer deposition. Thus, both of these new methods are expected to contribute to the general acceptance of the technology.
n SO3
-+
NH3+ n+
+
+
+
+
+
+
+
+
+
+
+
2. Wash 1. Polycation 3. Polyanion 4. Wash1
2
3
4
n SO3-+
NH3+ n n SO3 -n n SO3-+
NH3+ n+
NH3+ n+
+
+
+
+
+
+
+
+
+
+
+
+
+
+
+
+
+
2. Wash 1. Polycation 3. Polyanion 4. Wash1
2
3
4
1
2
3
4
Figure 2. (A) Schematic representation of polyelectrolyte adsorption on a substrate. Steps 1-3 depict the polycation and polyanion adsorption respectively. Steps 2-4 show washing processes. (B) Molecular illustration for polyelectrolyte deposition on a negatively charged substrate. (C) Molecular structures for the most commonly used polyelectrolytes: Poly(allylamine hydrochloride) and Poly(stryrene sulfonate) sodium salt.
A
B
1.1.3 Ion-Exchange Chemistry in Multilayers
Incorporation of metal ions into various matrices and surfaces using mostly easy and economical chemical processes is a key synthetic route for numerous applications like catalysis, sensing, biochemical applications etc. The Layer-by-Layer Technique fulfills these expectations since almost any ionic species including synthetic polyelectrolytes, biopolymers, nanoparticles, etc. can be incorporated into multilayer assemblies through the alternating deposition of the oppositely charged species.1,3,4,23,24
In most studies including LbL method, it is always desirable to control the surface functionalities of the materials, such as wettability. In a recent study Huck and co-workers showed that wetting characteristics of cationic polyelectrolyte deposited substrates can be modified by choosing a different nature of counterion.25 Choi et al. demonstrated the formation of Self-Assembled Monolayers (SAMs) presenting imidazolium ions at the tail ends on Au substrate having different anions and the effect of counterions on the surface wettability.26 It has also been shown that imidazolium ion-terminated monolayers can be assembled on silicon surfaces where water contact angle was increased via exchanging Cl- counterions with PF6- but a complete exchange between counterions takes several hours. The studies were conduced by Niu and co-workers to a further level by achieving a fast exchange between counterions.27 They applied a small positive potential to polyelectrolyte-functionalized ionic liquid modified ITO. A resulting current was caused by the exchange of the counterions between the interface and the solution. It was shown that the contact angle of the film can be tuned after applying an electric field to the film. In a very recent study Su et al. presented a well-established ion-exchange chemistry
to multilayers assembled by LbL technique using common polyelectrolytes on silicon substrate in order to tune surface wettability.28 This approach is expected to be applicable to any substrate conferred by the LbL assembly because it involves no chemical modification of the substrate or the polyelectrolytes used.
Recent attempts for incorporating metallic or inorganic ions into multilayer assemblies showed that ionic groups can be created in the multilayer which can bind desired inorgic salt by controlling the pH of the solution during fabrication of the thin films from weak polyelectrolytes.29 After incorporation of the inorganic salts, they converted to nanoparticles subsequently. As it was shown by our group in a recent study, irradiation by X-ray and 254 nm deep-UV of gold salt in a PMMA film leads to reduction of gold ions and nanocluster formation which is evidenced by both X-Ray Photoelectron Spectroscopy (XPS) and UV-vis-NIR absorption spectroscopy.30
1.2 Layer-by-Layer Assembly of Nanoparticles
Metal nanoparticles have attracted a lot of attention because of exhibiting unusual physical and chemical properties that strongly differs from the properties of bulk metals.31 Thus, these nanoparticles have interesting perspectives in the applications such as biomaterials, biomedicines, catalysts and sensors.32
Incorporation of nanoparticles into thin film structures with a well-defined control over chemical and physical properties poses a major confront. In order to produce thin films of metal nanoparticles that can lead to novel application in wide range of applications, numerous methods have been developed. Deposition of nanoparticle layers through Langmuir-Blodgett technique, deposition of nanoparticles via sol-gel chemistry and formation of nanoparticles based on
templating polymeric thin films are some examples for the developed techniques over the years.33 Despite the establishment of thin films including nanoparticles, assembly of these particles onto a surface having different characteristics e.g. geometry, type has remained as an unsolved problem.
After the development of layer-by-layer deposition method, the technique is utilized and expanded to the preparation of conformal thin films including nanoparticle partnered polyelectrolytes.20,34-38 The extension of LbL method to incorporation of metal nanoparticles with precise control over film properties, introduced multifunctionality to these nanostructured films by the means of catalytic, magnetic and optical properties.
1.2.1 Optical Properties of Metal Nanoparticles
The fascinating optical properties are one of the most interesting aspects of metallic nanoparticles which strongly depend on particle size and shape. Gold in bulk form exhibits yellow color in reflected light where thin gold films look bluish in transmission. As the particle size of gold decreases, the color changes from several tones of purple and red.31 The drastic change in color originates from the so-called surface plasmon resonance phenomena.
1.2.1.1 Surface Plasmon Resonance
When the conduction electrons of nanoparticles interact with the incident electromagnetic radiation, they exhibit collective oscillation that dominates the optical properties. For the particles where their sizes are much smaller than wavelengths of the incident light, electrons move in phase in the particle. Based on this knowledge, it is considered that they create a dipole under the influence of the
incident radiation. On each side of the particle, surface polarization charges are generated as a result of the electron motion (Figure 3a). In order to compensate this polarization, a restoring force forms in the nanoparticle which leads to a resonance frequency in the absorption spectrum. The sharp band resulted from this phenomena is termed as surface plasmon resonance. In order to exhibit drastic color effects, the plasma frequency of the nanoparticle has to lie in the visible part of the absorption spectrum. For the metals such as Pb, Cd and Hg, the electrons possess plasmon resonances in the UV part. Additionally, oxidative properties of these metals make the surface plasmon experiments harder. For the case of the metals like Au, Ag and Cu, the plasmon frequency lies in the visible part of the absorption spectrum, therefore surface plasmon experiments are mostly carried out with these metals.
There are additional contributors that affect the resonance frequency, and most of the discussions are focused on the size , shape and nature of the surrounding medium. For the case of the nonspherical particles, for instance rods, the oscillation modes can be either along (longitudinal) or across (transversal) the rod (Figure 3b). Because there is a strong dependence of the resonance wavelength on orientation of the electric field relative to the particle, optical properties are strongly affected.31
1.2.1.1.1 Size Dependency
Size dependency of the plasmon frequency of metallic nanoparticles, especially gold nanoparticles, has been widely investigated by various groups.39-42 Particles having diameters smaller than 5 nm do not exhibit appreciable plasmon absorption.43 As size of the particle becomes larger than 5 nm, the absorption band covers the visible region.43 It is known that 5-50 nm silver and gold nanoparticles have strong absorption bands at around 390-420 nm and 520-560 nm, respectively.44
+ + + + + + ++ + + + +
--
-- --
-+ + + +
-
-
-++ ++
- -
--Electric Field(a)
(b)
Magnetic Field + + + + + + ++ + + + +--
-- --
-+ -+ -+ -+ + + ++ + + + +
--
-- --
-+ + + +
-
-
-++ ++
- -
-+ + + +
-
-
-++ ++
- -
--Electric Field(a)
(b)
Magnetic FieldFigure 3. (a) Schematic representation for the metal nanoparticles that are interacting with the electromagnetic radiation. (b) Oscillation modes for a metal nanorod: Transverse and longitudinal oscillations respectively.
When the size of the nanoparticles increase, i.e. >25 nm, the plasmon bands start to broaden and red-shifted.44 The change in the position and the shape of the absorption band is explained by El-Sayed44 as inhomogeneous polarization of particles by the electromagnetic field. It is said that, as the particle size increases, dimensions of the nanoparticles becomes comparable with the wavelength of the interacting light.
1.2.1.1.2 Composition Dependency
Combination of the metal nanoparticles in different combination has gained an increasing attention in recent years. For tailoring surface plasmons, bimetallic nanoparticles are very important which can be classified into two types. First one is the alloys which stand for the particles of two metals distributed homogeneously.
The other type of the bimetallic nanoparticles is the so-called core-shell nanoparticles. In the case of the core-shell particles, particles of the two metals arrange heterogeneously.
Among the numerous bimetallic systems investigated,39,42 combination of Au and Ag metals has interesting consequences. Both Au and Ag have sharp absorption bands in the visible part of the spectrum and because they have similar lattice constants in forming fcc crystals, they can form alloy particles in any composition.45 Alloy nanoparticles are most of the time prepared by simultaneous reduction of the metal salts. A number of groups have studied the relationship between the composition of the Au-Ag alloys and the plasmon absorption band.44,46,47 They demonstrated that there is a linear dependency between the composition and wavelength of the SPR band. It is shown that the position of the SPR band lies between the absorption band of pure gold and pure silver. Color also changes via changing the composition. As Au content of the alloy increases, the color changes through yellow to red.
Synthesizing core-shell nanoparticles containing gold and silver from different synthetic routes is also presented by various authors.48,49 These different approaches follow either incorporation using sequential of the metals or segregation during co-reduction. In the case of the core-shell nanoparticles plasmon absorption is mostly determined by the shell. When silver is deposited onto gold, the position of the plasmon band changes drastically, i.e. from 520 nm to 400 nm depending on the shell thickness.50 This radical change is explained as alteration in the oscillation mode of the surface conduction electrons.
1.2.1.1.3 Surrounding Medium Dependency
The other factor affecting the plasmon absorption of the metal nanoclusters is the surrounding medium. Solvent medium that the nanoparticles are prepared can outcome with two categories: The first group includes the solvents that can modify the refractive index of surrounding nanoparticle and the second group of solvents can complex with the surface of the clusters.43 In order to understand the solvent phenomena, gold nanopartices are the most investigated.43,51
The solvents having no active functional groups, do not interact with the surface of the gold. It is demonstrated that when gold nanoparticles are prepared in such solvents, the absorption band shifts to higher wavelengths with an increase in the refractive index.43
When the gold nanoparticles are prepared in polar solvents, the position of the absorption maximum does not change because of the complexing ability of these solvents with gold surfaces. Because gold particles have high electron affinity, they are capable of withdrawing electrons from the solvent.43 This property leads to stabilize these charged particles by the solvent molecules and prevents aggregation of the particles.
1.2.2 Optical Responses of Metal Nanoparticle Incorporated LbL Films Controlled tunability of the surface plasmon frequencies of the metal nanoparticles is a key process for the potential applications of the chemical and biosensor technology, advanced spectroscopy and microelectroelectronic devices.52 The most important parameters that affect the plasmon frequency are the shape of the nanoparticles, surrounding medium and the interparticle distances.53 Layer-by-layer deposition technique is now the most widely used assembly process for the
incorporation of the metal nanoparticles because of the great flexibility on choosing the substrate, material and controlling the average thickness of the corresponding layers. The first attempt for the preparation of gold nanoparticle-polyelectrolyte films by tunable optical properties was by Calvert and his co-workers.18 In these films gold nanoparticles were introduced in an organic media which have different dielectric properties. Hence the nanoparticles were subjected to an interaction between this matrix and also with each other, within and between individual layers.52 The interparticle separation and the dielectric constant of the matrix were thought as the major factors affecting the dipolar-dipolar interactions and resulting surface plasmon resonance. It is usually expected to observe a red-shift in the SPR band of an inorganic nanoparticle when it is intercalated into an organic matrix. In the previous works,42,54 only one broad absorption peak was observed without separate contributions of individual and collective resonances.
Another effort for incorporating gold nanoparticles into LbL films was presented by Zhang et al.55 They proposed a new method for fabrication of the gold nanoparticle/polyelectrolyte films. In order to achieve high stability, they utilized the layer-by-layer technique in the assembly step and by a post-photoreaction, the ionic interactions were converted to covalent linkages.55 By using this method, they claimed that a patterned multilayer surface is achieved containing both organic and inorganic hybrids.
Considering the preparation of the films, interparticle distances between the nanoparticles and the environment that the nanoparticles are embedded, become the most important factors that significantly affect the optical properties of these films. Considering the dilute assemblies of the nanoparticles, it is thought that the refractive index of the surrounding medium is the most important factor.42 It is recently shown
that for closely packed nanoparticle films on either flat surfaces56 or on spheres57, dipole-dipole interactions play a significant role on the optical properties of the nanoparticles. In these closely-packed systems, the determining mechanism for the surface plasmon frequency is the interparticle separation.
In a recent study, Tsukruk et al. demonstrated that organized multilayer films from gold and polyelectrolyte layers can be constructed where individual and collective resonances of gold nanoparticles can be observed separately.52 They claimed that all films showed a strong extinction peak in the range of 510-550 nm owing to the plasmon absorption of individual gold nanoparticles. However, they observed a contribution of a second strong peak at around 620 and 660 nm for the films including sufficient gold nanoparticle density. They attributed this contribution as the collective plasmon resonance of gold nanoparticles from intralayer coupling (interaction within the layer). Additionally, it is said that under certain conditions interlayer interparticle resonance (interaction between the layers) could be observed distinctly at around 800 nm in the UV-Vis spectra. Similar work was performed by Liz-Marzan and his co-workers where spherical and triangular/hexagonal synthesized gold nanoparticles were embedded into an organic matrix via the layer-by-layer assembly.58 It was observed that as the number of the gold nanocolloid bilayers increased, a new band developed at 650 nm. This finding was associated with the interaction of the nanoparticles in the adjacent layers.
In order to control the interparticle separation, Liz-Marzan and Mulvaney presented a work using Au(core)@Si(shell) particles in multilayer assemblies.56,58 Silica was used as a shell material because of its inertness. By varying the shell thickness, they determined the interparticle separation. They observed that as the thickness of the shell increases, the separation between gold nanoparticles increases
which leads to a blue-shift in the plasmon resonance band toward the characteristic of isolated gold nanoparticles.
Preparation of metal nanoparticle/polyelectrolyte multilayers is not limited with substrates and film structures. In the layer-by-layer deposited systems, gold nanoparticles can also be used as templates. Caruso et al. demonstrated that oppositely charged polyelectrolytes can be coated on carboxylic acid derivatized gold nanoparticles.59 It is shown that, after deposition of each polyelectrolyte layer on gold particles, a systematic red-shift on the SPR was observed. This shift was attributed to the successful coating of polyelectrolyte layers. They have also been shown that the polyelectrolyte functionalized gold nanoparticles can be further deposited onto planar surfaces. So by using this strategy, both solution based multilayers and film structures can be obtained.59 By using the same approach, Caruso‟s group also introduced multilayer hollow polyelectrolyte spheres.60 Alternating deposition of oppositely charged polyelectrolytes on gold nanoparticles yielded stable organic shells after several polymer layers. These metallic cores were then dissolved with cyanide ions. It was claimed that obtained hollow polyelectrolyte multilayer capsules would have very important aspects in functionalized surfaces.
Demonstrations of the metal nanoparticle incorporated layer-by-layer systems showed that, molecular control over the films can tune the optical properties of the nanoparticles. These findings are thought to be very promising for the further scientific and commercial applications.
1.3 X-ray Photoelectron Spectroscopy
X-ray Photoelectron Spectroscopy, XPS, is a powerful technique and one of the most widely used for the surface analysis of the materials. XPS, which is also
known as the ESCA (Electron Spectroscopy for Chemical Analysis) was first discovered by Siegbahn. As a result of the continuous development of various experimental parameter, XPS has become the most popular surface analysis method because of its great ability to give chemical information and sensitivity for solids, thin films and nanostructures.61
1.3.1 Principles
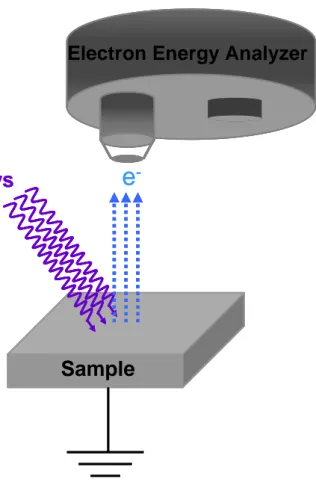
XPS is based on the kinetic energy determination of the emitted photoelectrons when the sample under investigation is subjected to highly energetic X-rays as shown schematically in Figure 4. Binding energy of the emitted electro ns is determined by the Einstein‟s equation:
BE = hυ - KE – Φ (1) where BE corresponds to the binding energy, hυ to energy of the X-ray and KE to kinetic energy of the photoelectrons. Φ stands for the work function of the spectrometer which is the necessary energy needed to move an electron from the Fermi level of the system into vacuum.
The energy of the photoelectrons leaving the sample is determined by the help of the analyzer which gives a spectrum with a series of photoelectron peaks. Binding energies of these photoelectron peaks are characteristic of elements, thus gives chemical and physical information about the few outer atomic layers of the sample due to the so-called photoelectric effect.62
Surface sensitivity originates from the strong inelastic collisions between the generated photoelectrons and the other atoms in the solid. The probe length of XPS is directed by a material dependent value called attenuation length (AL) or inelastic
Sample
e
-X-rays
Electron Energy Analyzer
Sample
e
-X-rays
Electron Energy Analyzer
Figure 4. Schematic representation of a typical XPS set-up.
mean free path (IMFP) represented by „λ‟. The term is defined as the distance travelled by the photoelectrons without losing energy while its intensity is reduced to the value of 1/e. The incident photoelectrons lose their energy because of elastic and inelastic collisions. The initial intensity of the photoelectrons, Io, decays as a function of the distance travelled into the solid according to the relationship, which is defined as:
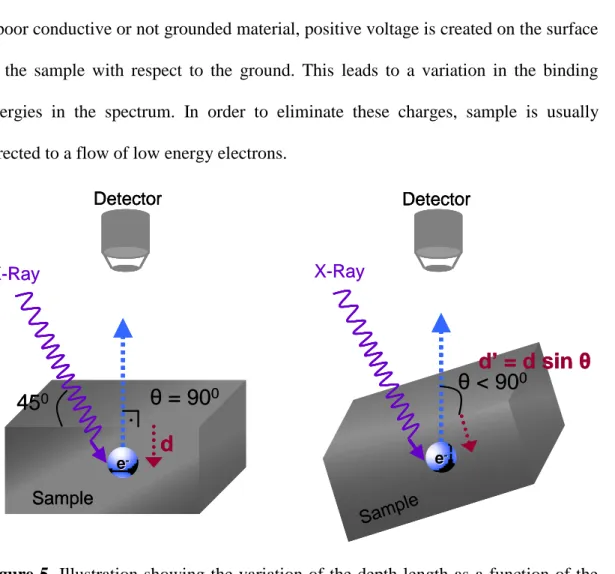
I/Io = e –d/λ (2) The short range of the probe length, 10-20 nm, has very important consequences especially for the nano-sized structures through its high surface sensitivity. Additionally, the surface sensitivity can also be increased by changing the analyzing angle of the emitted electrons with respect to surface plane of the sample
as illustrated in Figure 5. The method is called Angle Resolved XPS where the depth length is decreased down to 1-2 nm.63,64
During XPS measurements, electrons are emitted from the sample under investigation and they flow to the analyzer. As a result of this process, a positive charge is generated on the surface of the sample which is known as „surface charging‟. If the sample is a conductive material, the positive charge can be replenished with an electron withdrawn from the ground. In contrast, if the sample is a poor conductive or not grounded material, positive voltage is created on the surface of the sample with respect to the ground. This leads to a variation in the binding energies in the spectrum. In order to eliminate these charges, sample is usually directed to a flow of low energy electrons.
e e-
-.
θ = 90
045
0 e e--θ < 90
0d
d’ = d sin θ
Detector Detector Sample Sample X-Ray X-Ray e e--.
θ = 90
045
0 e e--θ < 90
0d
d’ = d sin θ
Detector Detector Sample Sample e e--.
θ = 90
045
0 e e--θ < 90
0d
d’ = d sin θ
Detector Detector Sample Sample X-Ray X-RayFigure 5. Illustration showing the variation of the depth length as a function of the take-off angle.
However, in some conditions, it may also lead to negative charging because of the excess number of electrons.63,65 On the other hand, charging of the sample
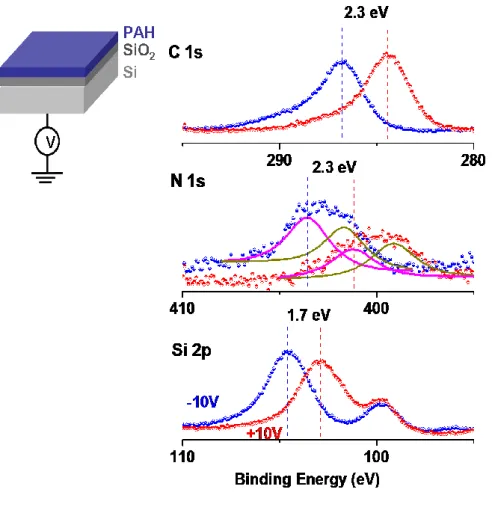
during photoemission process can be very beneficial in order to extract additional information about the sample under analysis if the extent and sign of the charging can be controlled as reported in literature.63,66-69 In order to control charging, one of the most versatile method is application of an external bias. For a conductive material, the positions of photoelectron peaks are displaced equally by the application of a voltage stress. However, if the sample is non-conductive, altering in the position of the photoelectron peaks will not be equal, because the charge accumulation is not only dependent on the applied voltage but also on the different capacity of the charge domains. When an external bias is applied to a Si/SiO2 system, the binding energy difference between Si+4 and Si0 increases under negative voltage stress and decreases under positive voltage stress. Generation of the secondary electrons, stray electrons and the electrons coming from the filament also contribute for neutralization process. In the case of the application of the positive bias, more electrons are attracted to the surface resulting with decreasing binding energy difference between Si+4 and Si0 2p peak. Conversely, under negative bias, these electrons will be repelled from the surface and lead to increase in the binding energy difference.64
1.3.2 Applications of XPS in Polyelectrolyte Multilayers
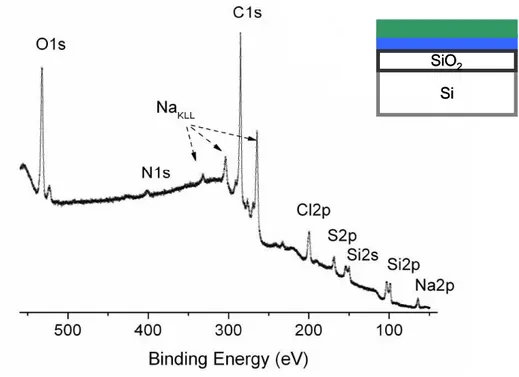
XPS is an important analytical tool for characterizing thin film structures like layer-by-layer deposited polyelectrolyte multilayers, which gives the opportunity to extract useful information such as elemental identification, composition, chemical state and thickness. The binding energy of the peaks is element specific and XPS can identify all elements except hydrogen and helium. In the case of the multilayer structures, the adsorption of each layer can be monitored using XPS.69 Figure 6
shows a survey XP spectrum of the SiO2/Si substrate coated by a positively charged polyelectrolyte (Poly(allyamine hydrochloride)) and a negatively charged polyelectrolyte (Poly(styrene sufonate) sodium salt). N1s signal corresponds to PAH where S2p peak is an evidence for the adsorption of the PSS. In most of the layer-by-layer studies, XPS is used for characterization. Lourenço et al. analyzed the influence of NaCl salt on the presence of the counterions in the LbL films.9
Figure 6. Survey spectrum of a bilayered Si/SiO2 system.
Oppositely charged polyelectrolyte films were investigated with different ionic strengths using XPS.9 It was established that when films were washed with pure water after each deposition step, counterions were distributed through the bulk film. Nevertheless, when the films that were washed with salt after each deposition,
Si SiO2 PAH PSS Si SiO2 PAH PSS
part of the counterions were distributed through the bulk film and the other part stayed on the film surface. A detailed work about the dependence of the Donnan potential on the acid-base equilibria in LbL self assembly (LbL-SA) films was reported by Tagliazucchi et al.70 In order to characterize the films, they combined electrochemical methods such as cyclic voltammetry (CV) and electrochemical quartz microbalance (EQCM), with XPS and Fourier Transform Infrared Reflection-Absorption Spectroscopy (FTIR-RAS). They obtained two independent contributions to the Donnan potential where one arising from the charges that are located in the outer region of the multilayer and the other one produced by the charges that are created or destroyed during protonation or deprotonation of the amino groups. In order to determine the degree of protonation of these amino groups, quantitative analysis was made by XPS and FTIR. Another elemental analysis with XPS for the confirmation of multilayer structures was demonstrated by Liu et al.71 They presented the usage of LbL process in order to fabricate catalyst particles of a controlled size distribution and packing density for aligned carbon nanotube growth. By using the UV-Vis and X-ray photoelectron spectroscopic measurements, they claimed that LbL process is not only advantageous for controlling the particle size and packing density, but also advantageous for preventing the catalyst nanoparticles from segregation during nanotube growth process.
Besides elemental analysis, XPS is also used in determining the chemical states of the deposited materials in LbL studies. Bruening et al. presented the preparation of catalytic nanoparticle containing films prepared by LbL method.72 They have also investigated the catalytic selectivity of these films. Alternating deposition of PdCl42- and polyethylenimine (PEI) is followed by the reduction of Pd(II) with NaBH4. Formation of the nanoparticles is confirmed with both
Transmission Electron Microscopy (TEM) and XPS. By using XPS, it is determined that ~70% of the Pd in the films was reduced. In the light of this information, they prepared two different systems having different type of polyelectrolytes and number of layers and they determined the effect of overlayers on the turn-over frequencies.
Another important feature of the XPS characterization in polyelectrolytes is that one can determine the thickness of the each adsorbed layer. In a recent work, Caruso et al. presented a detailed work about the thickness determination of polyelectrolyte films on gold. By using proper relationship they found that, a four-layered polyelectrolye film has a thickness about 7.5 nm where reliability of this value was also supported by SPR and UV measurements.73 Another work for thickness determination of the polyelectrolyte films is presented by us where the average thicknesses of the overlayers were estimated by using the formula for the attenuation of XPS signals.69 The relationship is further simplified by making measurements in two different take-off angles and the thickness of the each polyelectrolyte layer is estimated as 0.6 nm.
The quantitative analysis can also be made in XPS experiments by using the area of the monitored peaks. Hsieh et al. reported for the multilayer assemblies of PSS and PAH that are formed by sequential adsorption, XPS can be used to determine the stoichiometry between ammonium ions and sulfonate groups.74 It has been shown that the stoichiometry has differed from substrate to substrate and this information can be utilized to determine a general method for polymer surface modification.
1.4 AIM OF THE STUDY
This thesis mainly focuses on the preparation and the characterization of the layer-by-layer assembled polyelectrolyte multilayers and polyelectrolyte/metal nanoparticle films.
In the first part, formation of the polyelectrolyte layers will be presented. This part includes the characterization of polyelectrolyte coated thin films on Si/SiO2 system with X-ray photoelectron spectroscopy (XPS). Investigation of the response of polyelectrolyte layers to an external stimulus during XPS measurements will also be discussed in detail.
The second part of the study discusses the formation of the polyelectrolyte/metal nanoparticle (Au and/or Ag) films on glass surfaces. The optical properties of these films are investigated with UV-vis absorption spectroscopy and results will be discussed extensively.
The last part presents introducing Au and/or Ag ions into polyelectrolyte films through ion-exchange chemistry. This section will introduce characterization of these films with UV-vis spectroscopy after irradiation with UV light and investigating their in-situ reduction while recording XPS data.
2. EXPERIMENTAL SECTION 2.1 Materials
Poly(allylamine hydrochloride) (PAH), Poly(sodium 4-styrene-sulfonate) (PSS), Poly(ethylenimine) (PEI), Gold(III) chloride trihydrate (HAuCl4.3H2O), sodium citrate dihydrate ( HOC(COONa)(CH3COONa)2.2H2O) were purchased from Aldrich. Sodium chloride (NaCl), Hydrochloric acid (HCl), Hydrofluoric acid (HF) and Potassium Cyanide (KCN) were purchased from Merck, Silver nitrate (AgNO3) was from Fluka and NaBH4 from BDH chemicals. Milli-Q Grade water was used in all preparations.
2.2 Instrumentations
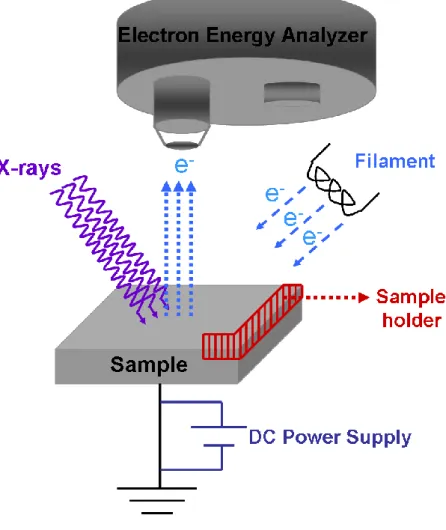
In order to record the XPS data, two different spectrometers KRATOS ES300 and ES800 with MgKα (not monochromatized) sources at 1253.6 eV were used. All measurements were done with a base pressure of 10-8 Torr. Sample is subjected to the X-rays with a 450 angle and the analyzer is located on top of the sample with a 900 with respect to the surface of the sample plane where in this orientation the take-off angle is 900, unless otherwise mentioned. The sample rod is connected to either the ground or a DC power supply externally while recording the XPS data under external bias. An illustrative XPS measurement under DC external bias is represented in Figure 7.
Double beam Varian Cary 5E spectrophotometer was used for UV-Vis absorption measurements.
For contact angle measurements, Tantec Contact Angle Meter was used. 254 nm deep UV radiation using a low-pressure 10 W Hg lamp was used to irradiate samples containing ionic gold.
The Scanning Electron Microscope (SEM) image was recorded using ZEISS EVO-40. The image was recorded at 5.00 kV (EHT) operating voltage and at 1.90 A filament current.
Figure 7. Schematic diagram of a DC biased XPS set-up.
2.3 Procedures
2.3.1 Preparation of Polyelectrolyte Multilayers on Silicon Surfaces For this purpose, cationic type polyelectrolyte poly(allylamine) hydrochloride (PAH) and anionic type polyelectrolyte poly(sodium 4-styrenesulfonate) (PSS) were used. Adsorption procedure was carried out from 0.15M NaCl solution with an
amount of 0.5 g/l polyelectrolyte, using established procedure.1,3 Because PAH is a weak electrolyte, having strong structural dependence on pH, the pH of the solution was adjusted to 8.0. As a support material, HF-cleaned Si (100) substrate was used with further thermal treatment at 700 °C in air to grow a thin oxide layer. The substrate was first dipped into the 0.10 M NaOH solution. Deposition was performed by further dipping into the separate PAH and PSS solutions respectively. Samples were rinsed with deionized water for 1 min after adsorption of each layer. By dipping the samples into polyelectrolyte solutions in an alternative fashion, one can build-up as many layers as needed.
2.3.2 Preparation of Polyelectrolyte/Metal Nanoparticle (Au and/or Ag) Films
Polyelectrolyte/metal nanoparticle films are prepared in the same manner with the polyelectrolyte multilayers. Glass or quartz are used as the support materials. The substrates are treated with 0.01M NaOH solution first about 40 min. cationic type polyelectrolyte, PAH, is used for the deposition partners of the citrate-capped nanoparticles since the citrate capping renders the nanoparticle a negative charge. The deposition process starts with PAH (0.5 g/l) for 1 hour. The adsorption is followed with dipping the supporting substrate into nanoparticle solutions that are in the same concentration as they were prepared. Alternating deposition of glass or quartz into polyelectrolyte and nanoparticle solutions gives multilayer structures.
2.3.2.1 Preparation of Citrate-Capped Gold Nanoparticles
0.5 mM Tetracholoroauric acid salt was dissolved in 100 ml water and heated to boiling temperature under vigorous stirring. Preheated (~ 300 C) 5 ml 1 wt % sodium citrate solution was added quickly to the boiling gold solution. The solution is boiled for about 15-20 min. Color change to red wine indicates formation of gold nanoparticles with 15-20 nm avarege size. The UV-Vis absorption spectrum gives a sharp peak at 520 nm.
2.3.2.2 Preparation of Citrate-Capped Silver Nanoparticles
For the preparation of the silver colloids, 0.3 mM 99 ml solution of citrate and 1mM NaBH4 is cooled for about 30 min. 1 ml of the cooled AgNO3 (0.01M) solution is added to the solution under vigorous stirring. NaBH4 is added to the citrate solution just before addition of the AgNO3. The color of the solution turns to yellow which is an indication of the silver colloid formation at around 10 nm. UV-vis absorption spectrum gives a sharp peak at 400nm.
2.3.2.3 Cyanide Treatment for Gold Nanoparticle/Polyelectrolyte Systems
0.01 M KCN was used in all treatments. The films were prepared as explained above. In order to etch gold, corresponding films were inserted into the KCN solution for about 30 seconds and washed with deionized water about 1 min after each dipping. UV-Vis spectrum was recorded after each and every KCN treatment.
2.3.3 Incorporation of Au Ions into Polyelectrolyte Multilayers and their In-situ Photochemical Reduction
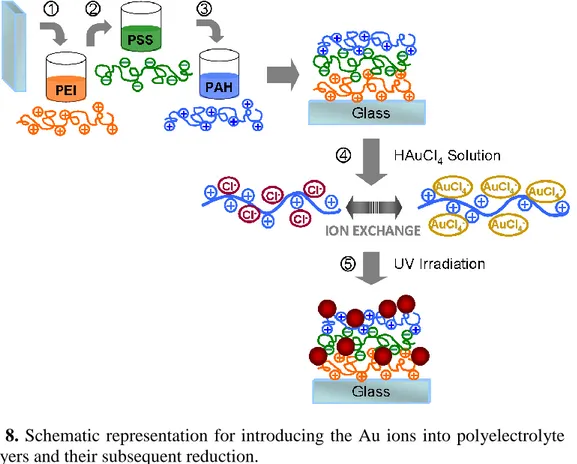
Typical polyelectrolytes, PEI, PSS and PAH are employed for building up multilayers before introducing Au ions. As a supporting material, glass is used that is pretreated with Piranha solution for 40 min. PEI (1mg/ml) is used as a first layer and each polyelectrolyte layer adsorption has lasted 1 h and followed with 1min washing. After the deposition of the PEI, the substrate is dipped into PSS (1mg/l) and PAH (1mg/l) solutions respectively, both involving 0.75M NaCl. In the case of the introducing Au ions, the outermost layer should be PAH having Cl- as counterions. Deposition time for the Au ions is chosen as 12 h. Additional polyelectrolyte layers can also be deposited on top of the metallic layers by using the same procedure.
After the integration of the Au ions, the films are exposed to 254 nm deep UV radiation using a low-pressure 10 W Hg lamp to induce the reduction of Au in the polyelectrolyte matrix. The reduction of the ions and subsequent nanoparticle formation were followed by Cary 5E UV-vis-NIR spectrometer which will be discussed in detail.
Figure 8. Schematic representation for introducing the Au ions into polyelectrolyte multilayers and their subsequent reduction.
3. RESULTS AND DISCUSSION
3.1 Characterization of Layer-by-Layer Assembled Ultra-Thin Polyelectrolyte Films on Si/SiO2 Substrate
3.1.1 Water-Contact-Angle Measurements
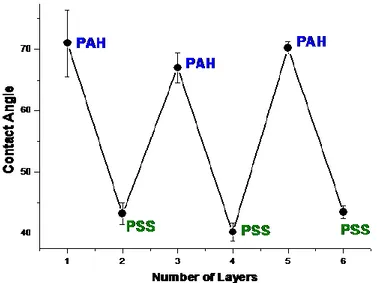
Sequential adsorption of oppositely charged polyelectrolyte layers results with different wetting characteristics. The traditional method for assessing wetting properties of heterogeneous surfaces is the Water Contact Angle (WCA) method. For an alternately deposited PAH and PSS layers, contact angle measurements show that wetting characteristics of the supporting surface changes through hydrophobic to hydrophilic after each polyelectrolyte insertion. In Figure 9 it is shown that, the average contact angle for a PAH-terminated surface is about 70º, and for a PSS-terminated surface, it is observed to be around 40º. The periodicity of the change in the contact angle is reserved even for multiple layers, so one can easily follow up and ensure the deposition of a polyelectrolyte layer by the WCA measurements.
Figure 9. Water-Contact-Angle measurements after deposition of each PAH/PSS layers.
Although water contact angle method is used for evaluating the wetting properties of the surfaces, it gives information only on the macroscopic level. Because controlling the surface properties of the surfaces is still a great challenge for most of the scientists, for more detailed information in the molecular level, various other types of spectroscopic and imaging methods are utilized. Due to the chemical specificity and interface sensitivity, XPS is one of the most powerful techniques for extracting molecular information.61,75,76
3.1.2 XPS Characterization of Single Layered Polyelectrolyte Film on Si/SiO2 Substrate
In surface analysis, XPS is one of the most powerful techniques because of its high surface sensitivity (1-20 nm).61 By using XPS as a characterization tool, one has a chance to extract useful and unique information such as elemental identification, composition, chemical state of the surface species and thickness.
As discussed in the experimental part, in XPS analysis if the sample under investigation is a non-conductive material, it may lead to positive charging due to the photoelectrons emitted from the sample. By using direct flow of low-energy electrons, one can prevent the material from these charges, where under some conditions it may also lead to negative charging due to capture of excess electrons.63,65 Applying an external voltage bias can control this surface charging and provide further analytical and electrical information.66-68,77-83 In order to extract additional information for the polyelectrolyte films, the same approach can also be used.
A single layer polyelectrolyte film is prepared on silicon with ca. 5 nm oxide layer on top and investigated with XPS as shown in Figure 10. For Si/SiO2 system