498
AJCS 6(3):498-505(2012) ISSN:1835-2707
Plant density and mixture ratio effects on the competition between common vetch and wheat
Ibrahim Atis
1*, Kagan Kokten
2, Rustu Hatipoglu
3, Saban Yilmaz
1, Mehmet Atak
1, Ersin Can
11
Department of Field Crops, Faculty of Agriculture, Mustafa Kemal University, Hatay, Turkey
2Department of Field Crops, Faculty of Agriculture, Bingol University, Bingol, Turkey
3Department of Field Crops, Faculty of Agriculture, Cukurova University, Adana, Turkey
*Corresponding author: [email protected]; [email protected]
Abstract
Mixtures of annual forage legumes with winter small grains for forage are practiced traditionally in the Mediterranean countries. The aim of the present study was to investigate the effects of variable seed mixture rates and different plant densities on the forage yield. The study also investigated the competition effects among mixture partners in the mixture of common vetch (Vicia sativa L.) and wheat (Triticum aestivium L.). Field trials were conducted at two locations (L1, Hatay and L2, Adana) during the 2008-09 and 2009-10 growing seasons. Three plant densities (200, 400, 600 plants m-2) and five seed mixture ratios (100 % V, 75% V + 25% W, 50% V + 50% W, 25% V + 75% W, 100 % W) of common vetch (V) and wheat (W) were used. The results of the study showed that increased plant density in the mixture resulted in increased dry matter yield per unit area. In addition, increased seed ratio of wheat in the mixture caused increased dry matter yield per unit area. Also, elevated dry matter yield resulted in increased crude protein yield. Land equivalent ratio (LER), aggressivity (A) and competitive ratio (CR) indexes showed that common vetch was the dominant species in all common vetch-wheat mixtures.
Keywords: Annual mixtures, competition, plant density,
Abbreviations: Adana (L1), aggressivity (A), competitive ratio (CR), Hatay (L2), land equivalent ratio (LER), vetch (V), wheat (W)
Introduction
Common vetch (Vicia sativa L.) is very popular annual fodder crop and common vetch - cereal mixtures are frequently grown in the Mediterranean countries for animal feeding (Anil et al., 1998; Lithourgidis et al., 2006; Dhima et al., 2007). Common vetch - cereal mixtures as a hay or silage are very important for feeding dairy livestock. Wheat – legume mixtures grown for forage are of increased importance in the rations of ruminant animal diet because of improved successful silage techniques (Anil et al., 1998). It is well known that mixture of legumes and cereals has some advantages over pure stands. Crops within the mixtures use the environmental resources efficiently and produce more yield than their pure stands. Cereal crops use the nitrogen fixed by the legume crops. Protein and carbohydrate rates of feed originated from mixtures are balanced and the feed from mixture has higher feeding value compared to the feed from pure sowings of mixture components (Karadag and Buyukburc, 2003; Tuna and Orak, 2007; Mariotti et al., 2009). Besides advantages, the technique offers some disadvantages over pure stands. The most important problem of the mixed system is the managing of the crops. Different crops within mixed growing systems are grown together and they compete with each other for limited resources, which results in intra-specific and inter-specific competition between mixed crop species (Yilmaz, 2005). Plants need some abiotic components of the ecosystem as well to survive. The most frequent competition factors for plants are water, nutrients, light, O2 and CO2. The requirements of plants to compensate them after competition may be different among different plant species (Haynes, 1980). To recognize competition among the plants, a lot of mathematical models
were suggested. These models were summarized by Weigelt and Jolliffe (2003), which concluded that competition experiments mainly are composed of different plant densities and different growing patterns. They are concentrated on to compare performance of mixed growing versus sole growing (Connolly et al., 2001; Weigelt and Jolliffe, 2003). Land equivalent ratio (LER), competitive ratio (CR) and aggressivity (A) are some of the competition indexes frequently used to compare mixture and pure stand (Bhatti et al., 2006; Dhima et al., 2007; Yilmaz et al., 2008; Erol et al., 2009, Wahla et al., 2009; Rahetlah et al., 2010; Pasynkova and Zavalin, 2010). The aims of this research were (i) to evaluate common vetch and wheat pure stands as well as their mixtures in three plant densities (200, 400 and 600 plants m2) under five seeding ratios for forage and crude protein yield and (ii) to estimate the effect of competition between the two species used in the intercropping systems.
Results and discussion Dry matter yield
Dry mater yield was significantly influenced by plant densities during two years. The highest dry matter yield was obtained from the plant density of 600 plants m-2 during two years (Table 2). Hauggaard-Nielsen et al. (2006) reported that mixture components may use ecological resources more efficiently than sole crops, and available resources may support a greater number of plants. The results of this study confirm that regardless of mixing proportion, the highest planting density of 600 plants m-2 should be preferred for
499
high dry matter yield. The effects of locations were significant in terms of total dry matter yield during first year but they were insignificant during second year (Table 2). Averaged total dry mater yield in L2 (Adana) was higher compared to L1 (Hatay). Increased seed rate of wheat in mixtures significantly increased the hay yield of mixtures at two locations (Table 3). This finding suggest that vetch as a climbing plant climbed over the support plant wheat in this experiment containing the mixture of vetch – wheat. Vetch plant in pure stands, especially with high plant density, was lodged, and resulted high dry matter losses. Lithourgidis et al. (2011) reported that lodging is frequently occurred some crops and yield can severely decrease. Vetch plants in L2 grew rapidly resulting in taller plants compared to L1 but stems of the plants in L2 were very thin. In the mixture, the vetch plants climbed over the wheat plants, which resulted increased their dry matter yield. Previous research also confirm this study and report that increased cereal sowing rates in common vetch-cereal mixtures result in higher dry mater or hay yield (Karadag and Buyukburc, 2003; Kokten et al., 2003;2009); Lithourgidis et al., 2006; Dhima et al., 2007;). Total and partial dry matter yields during first year were higher compared to dry matter yields during the second year (Table 2, 3). Averages of total dry matter yields were 7.28 t ha-1 and 5.36 t ha-1 during first and second year, respectively. Higher dry matter yields during first year may be due to higher rainfall (Table 1). This situation suggests that growing performance and competition of species in the mixture depend on ecological factors (Hauggaard-Nielsen et al., 2006; Kokten et al., 2009).
Crude protein yield
Crude protein yield was significantly influenced by plant densities during both years (Table 2). Although the maximum protein yield of 904 kg ha-1 and 679.4 kg ha-1 were obtained from 600 plants m-2 plant density during first and second years, respectively, protein yield of 600 plants m-2 plant density was not significantly different from the protein yield of plants with density of 400 plant m-2 during the second year. The trend showed an increase in plant density was positively related with crude protein yield which suggests that increased crude protein yields in higher plant densities may be due to increased dry matter yield in higher plant densities. An analysis of the two years results at both locations further shows significant differences in crude protein yield as the mixture rate changed (Table 4). Crude protein yields ranged 597.5 kg ha-1 (pure wheat) to 941.0 kg ha-1 (25 % V: 75 % W) during first year and 454.0 kg ha-1 (pure vetch) to 723.1 kg ha-1 (25 % V: 75 % W) during the second year. Tukel et al. (1997) reported that lowest crude protein yield from pure vetch due to lower dry matter yield of vetch compared to vetch + triticale mixtures and pure triticale. The highest protein yield was obtained from 25 % V: 75 % W mixture rate. Despite the higher protein content of pure vetch than mixtures and pure wheat (unpublished data), the amount of protein produced per unit ha decreased due to the low dry matter yield per ha. Common vetch hay had more protein content compared to wheat hay which affected the hay quality. The results are confirmed by the previous studies by Karadag and Buyukburc (2003), Kokten et al. (2009) and Lithourgidis et al. (2006). Also, protein yield was significantly influenced by years and locations. Protein yield during first years was less compared to the protein yield during the second year. Obtained higher dry matter yield during the first year may have led to such
differences resulting in variation of protein yield during two years. The first year averaged protein yield in L2 was higher compared to L1, the inverse situation was observed during second year. The effect of ecological conditions on dry matter yield, protein content and competition features of mixture counterparts may have caused these differences. Livestock needs protein for growth and milk production and protein yield per ha directly are related to crude protein contents and total forage yield. Since protein is one of most costly supplement for livestock, the total amount of protein produced per unit area is one of the most important quality characteristics as suggested by Cabellero et al. (1995), Assefa and Ledin, (2001), Lithourgidis et al. (2006) and Eskandari et al. (2009).
Land equivalent ratio (LER)
LER verifies the effectiveness of mixtures for using available resources of environment compared to pure cropping. For this purpose, LER value is being used frequently to compare effectiveness of the mixture and pure growing (Dhima et al., 2007, Yilmaz et al., 2008; Erol et al., 2009; Rahetlah et al., 2010). In this experiment total LER values were greater than 1 in all plant densities and mixture rates (Tables 5, 6). This finding demonstrated that all plant densities and mixture ratios, mixture of common vetch and wheat were advantageous compared to their pure stands. Some researchers emphasize on the advantages of intercropping (Karadag and Buyukburc, 2003; Yilmaz et al., 2008; Pasynkova and Zavalin, 2010; Rahetlah et al., 2010), whereas, the others have focused disadvantages of intercropping. Researchers concluded that disadvantages depend on mainly species used, mixture ratios, ecological conditions and experimental years (Lithourgidis et al., 2006; Dhima et al., 2007; Kokten et al., 2009; Rakeih et al., 2010). In this research the plant densities of 200 and400 plants m-2 gave the maximum LER values of 1.34 and 1.52 in the first and second year respectively. However, LER values of plant densities were insignificant during the second year. LERtotal values increased with increase in the proportion of wheat in the mixture during first year of the experiment. The maximum LERtotal value of 1.59 was determined from 25V:75W seed mixture during first year. The second year LERtotal values were insignificant. All values of LERtotal were higher than 1 in all seed mixture rates. Locations were significant in terms of LER value during the first year (Table 5). Averaged LER value in L2 (Adana) was significantly higher compared to L1 (Hatay). As the partial LER values are concerned, LERvetch values were greater than 0.5 in all plant densities and seed mixture rates. LERwheat values were generally lower than 0.5 (Tables 5, 6). These finding showed that common vetch was the dominant species (has an advantage) in the mixture. Some investigations showed that common vetch was the dominant species in mixed growing with wheat but the other cereals such as barley, oat and triticale had the higher partial LER values compared to the partial LER values of common vetch (Turk et al., 2002; Dhima et al., 2007; Rahetlah et al., 2010; Rakeih et al., 2010). Especially, Dhima et al. (2007), who studied common vetch-oat, common vetch-barley, common vetch-triticale and common vetch-wheat mixtures, pointed out that in wheat-common vetch mixture, wheat had the lower LER values than 0.5. It can be concluded that wheat was the weaker competitor than the other cereals in common vetch-cereal mixtures. Increased rate of wheat in the mixture resulted in the increased partial LER value of wheat.
500
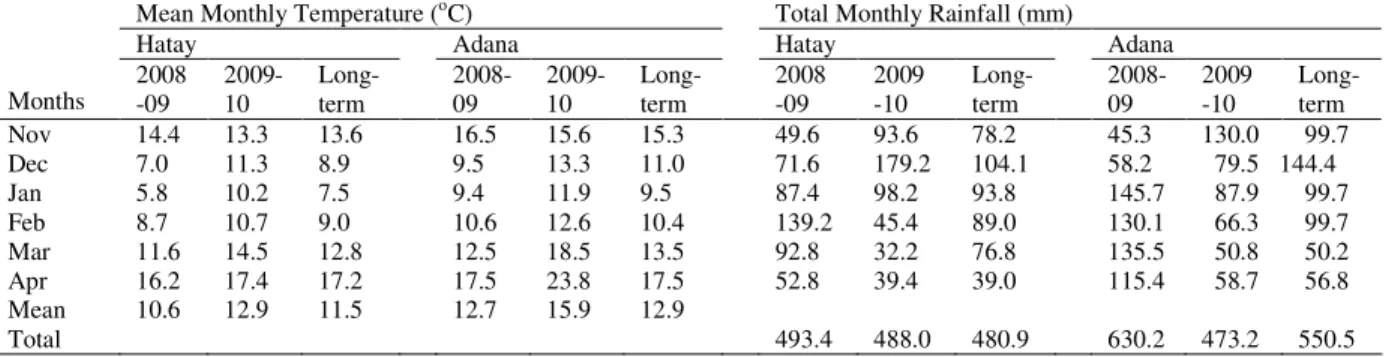
Table 1. Monthly mean air temperature and total rainfall during the study and long term data (means of 20 years).Mean Monthly Temperature (oC) Total Monthly Rainfall (mm)
Hatay Adana Hatay Adana
Months 2008 -09 2009-10 Long-term 2008-09 2009-10 Long-term 2008 -09 2009 -10 Long-term 2008-09 2009 -10 Long-term Nov 14.4 13.3 13.6 16.5 15.6 15.3 49.6 93.6 78.2 45.3 130.0 99.7 Dec 7.0 11.3 8.9 9.5 13.3 11.0 71.6 179.2 104.1 58.2 79.5 144.4 Jan 5.8 10.2 7.5 9.4 11.9 9.5 87.4 98.2 93.8 145.7 87.9 99.7 Feb 8.7 10.7 9.0 10.6 12.6 10.4 139.2 45.4 89.0 130.1 66.3 99.7 Mar 11.6 14.5 12.8 12.5 18.5 13.5 92.8 32.2 76.8 135.5 50.8 50.2 Apr 16.2 17.4 17.2 17.5 23.8 17.5 52.8 39.4 39.0 115.4 58.7 56.8 Mean 10.6 12.9 11.5 12.7 15.9 12.9 Total 493.4 488.0 480.9 630.2 473.2 550.5
Table 2. Total dry matter yields and crude protein yields in different plant densities.
Dry Matter Yield (t ha-1)
Crude Protein Yield (kg ha-1)
Plant Density
(plants m-2) Hatay Adana Mean Hatay Adana Mean 200 4.48 e+ 7.94 b 6.20 C* 579.4 809.3 694.3 B 400 5.99 d 7.91 b 6.95 B 668.7 786.7 727.7 B 600 7.04 c 10.31 a 8.67 A 773.8 1038.9 906.4 A Mean (Loc) 5.84 B++ 8.72 A 674.0 B 878.3 A 2 0 0 8 -2 0 0 9 Mean (Year) 7.28 A** 776.1 A 200 3.75 5.16 4.45 B* 504.3 488.8 496.6 B 400 5.25 5.30 5.27 B 710.9 473.8 592.4 AB 600 6.16 6.55 6.36 A 789.0 569.7 679.4 A Mean (Loc) 5.05 5.67 668.1 A 510.8 B 2 0 0 9 -2 0 1 0 Mean (Year) 5.36 B 589.4 B
+) Values with the different small letter in a column in a year are significantly different according to the LSD test at P<0.05. *) Values with the different capital letter in a column in a year are significantly different according to the LSD test at P<0.05. ++) Means of location values with the different capital letter (within a line) are significantly different at P<0.05.
**) Means of year values with the different capital letter are significantly different at P<0.05.
Aggressivity (A)
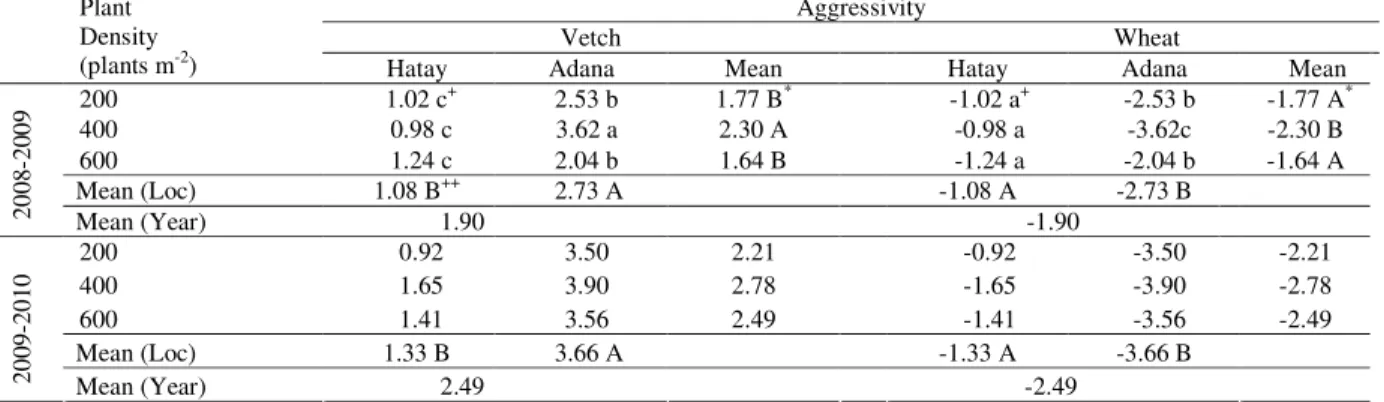
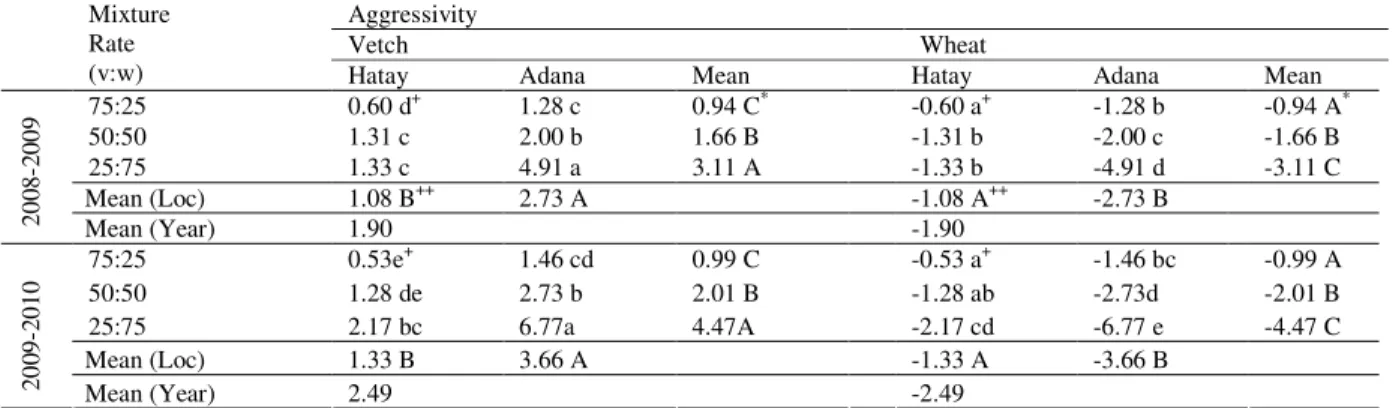
In our experiment Avetch values were positive and Awheat values were negative. These results showed that common vetch was the dominant species in the mixture of common vetch and wheat (Tables 7, 8) in agreement with Dhima et al. (2007). On the other hand, some other researches demonstrated that cereals, except to wheat, were the dominant species in the intercropping of cereals with legumes (Dhima et al., 2007; Wahla et al., 2009; Pasynkova and Zavalin, 2010; Rahetlah et al., 2010; Rakeih et al., 2010). Plant densities were significant for A during the first year but were insignificant during the second year (Table 7). The highest Avetch value was observed in 400 plants m-2 plant density. As aggressivity concerned in terms of seed mixture rate, increasing proportion of the common vetch in mixture Avetch values decreased. The highest Avetch values of 3.11 and 4.47 were observed from 25V:75W mixture rate during first and second year, respectively. From these results, it could be concluded that decreasing the proportion of common vetch in the mixture decreased intra-specific competition of common vetch, and increased number of the cereal for common vetch to climb to catch the sunlight increased. Locations were significant in terms of Avetch values during two years. Mean Avetch value in L2 was higher compared to L1. This suggests that L2 (Adana) had good ecological conditions compared to the L1 (Hatay) for common vetch growing.
Competitive Ratio (CR)
The results of CR confirmed with those of LER and aggressivity. Common vetch was the dominant species in the mixture of common vetch and wheat in agreement with Dhima et al. (2007). In all plant densities and mixture ratios studied CRvetch values were higher compared to CRwheat values (Tables 9, 10). CR values of both species were insignificantly influenced by plant density during both years. The maximum CRwheat value was obtained from the plant density of 400 plants m-2 during first year and 200 plants m-2 during second year (Table 9). The maximum Avetch values were recorded in the plant density of 400 plants m-2 during first year and plant density of 600 plants m-2 during the second year. Seed mixture rates were significant for CRwheat values for two years. In general, CRvetch and CRwheat values decreased as the proportion of species increased (except CRwheat for 75V:25W plant densities of the first year). Erol et al. (2009) reported that increased or decreased proportion of common vetch in mixtures of vetch and oat resulted in irregular changes in CR values, as inter-specific competition is complex phenomenon and is variable as species compete for so many factors. Differences in CR values for locations were significant (Table 9). Common vetch was the dominant species at both locations. Mean CRvetch value in L2 (Adana) was higher compared to L1 (Hatay) while mean CRwheat value in L1 was higher compared to L2.
501
Table 3.Dry matter yields of the mixtures and pure sowings as affected by the mixture rate.Dry Matter Yield (t ha-1)
Vetch Wheat Total
Mixture Rate
(v:w) Hatay Adana Mean Hatay Adana Mean Hatay Adana Mean Pure vetch 3.81 c+ 5.10 b 4.45 - - - 3.81 d 5.10 cd 4.45 C* 75:25 3.42 c 5.38 b 4.40 1.08 e 0.79 e 0.94 D* 4.49 d 6.18 bc 5.33 C 50:50 3.80 c 5.60 ab 4.70 2.58 d 1.87 de 2.23 C 6.38 bc 7.47 b 6.93 B 25:75 2.21 d 6.51 a 4.36 5.08 c 5.73 c 5.40 B 7.29 b 12.24 a 9.76 A Pure wheat - - - 7.20 b 12.61 a 9.90 A 7.20 b 12.61 a 9.90 A Mean (Loc) 3.31 B++ 5.65 A 3.99 B 5.25 A 5.84 B 8.72 A 2 0 0 8 -2 0 0 9 Mean (Year) 4.48 A** 4.62 A 7.28 A Pure vetch 2.76 bc 2.18 cd 2.47 - - - 2.76 fg 2.18 g 2.47 E* 75:25 2.93 b 2.70 b-d 2.82 2.21 d 0.69 e 1.45 C* 4.49 de 3.39 ef 3.94 D 50:50 2.63 b-d 3.18 ab 2.91 2.29 d 1.47 de 1.88 C 4.92 cd 4.65 d 4.78 C 25:75 2.00 d 3.78 a 2.89 3.96 c 3.69 c 3.82 B 5.96 c 7.47 b 6.71 B Pure wheat - - - 7.15 b 10.66 a 8.90 A 7.15 b 10.66 a 8.90 A Mean (Loc) 2.58 2.96 3.90 4.13 5.05 5.67 2 0 0 9 -2 0 1 0 Mean (Year) 2.77 B 3.93 B 5.36 B
+) Values with the different small letter in a column in a year are significantly different according to the LSD test at P<0.05. *) Values with the different capital letter in a column in a year are significantly different according to the LSD test at P<0.05. ++) Means of location values with the different capital letter (within a line) are significantly different at P<0.05.
**) Means of year values with the different capital letter are significantly different at P<0.05.
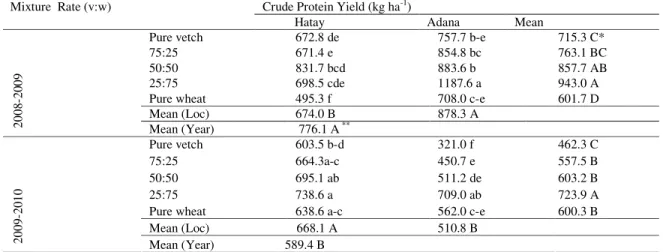
Table 4. Crude protein yields of the mixtures and pure sowings as affected by the mixture rate.
Crude Protein Yield (kg ha-1) Mixture Rate (v:w)
Hatay Adana Mean
Pure vetch 672.8 de 757.7 b-e 715.3 C*
75:25 671.4 e 854.8 bc 763.1 BC
50:50 831.7 bcd 883.6 b 857.7 AB
25:75 698.5 cde 1187.6 a 943.0 A
Pure wheat 495.3 f 708.0 c-e 601.7 D
Mean (Loc) 674.0 B 878.3 A 2 0 0 8 -2 0 0 9 Mean (Year) 776.1 A ** Pure vetch 603.5 b-d 321.0 f 462.3 C 75:25 664.3a-c 450.7 e 557.5 B 50:50 695.1 ab 511.2 de 603.2 B 25:75 738.6 a 709.0 ab 723.9 A
Pure wheat 638.6 a-c 562.0 c-e 600.3 B
Mean (Loc) 668.1 A 510.8 B 2 0 0 9 -2 0 1 0 Mean (Year) 589.4 B
+) Values with the different small letter in a column in a year are significantly different according to the LSD test at P<0.05. *) Values with the different capital letter in a column in a year are significantly different according to the LSD test at P<0.05. ++) Means of location values with the different capital letter (within a line) are significantly different at P<0.05.
**) Means of year values with the different capital letter are significantly different at P<0.05.
From the results mentioned above, it was concluded that increased plant densities resulted in increased dry matter yield. Also increased wheat proportion in the seed mixture resulted in higher dry matter yield. For better quality performance and higher yield, the seed mixture of 25% vetch + 75% wheat could be preferred. In terms of competition features, LER, A and CR indexes showed that common vetch was the dominant species in the mixture. L2 (Adana) had better ecological conditions for common vetch growing compared to L1 (Hatay).
Materials and methods Site description
Experiments were conducted at two locations (L1 and L2) during the 2008-09 and 2009-10 growing seasons. First location (L1) was Research Station of Mustafa Kemal University, Hatay located at 36° 15' N and 36° 30' E and second location (L2) was Research Station of Cukurova University, Adana located at 37o 23' N and 35o 22' E in the Eastern Mediterranean regions of Turkey.
502
Table 5. Land Equivalent Ratio (LER) values for the mixture of vetch and wheat as affected by plant density.LER values
Vetch Wheat Total
Plant Density (plants m-2)
Hatay Adana Mean Hatay Adana Mean Hatay Adana Mean 200 0.84 c+ 1.14 b 0.99 B* 0.48 0.22 0.35 1.32 b+ 1.36 b 1.34 AB* 400 0.80 c 1.59 a 1.19 A 0.43 0.22 0.33 1.23 b 1.81a 1.52 A 600 0.87 c 0.96 bc 0.91 B 0.35 0.25 0.30 1.22 b 1.20 b 1.21 B Mean (Loc) 0.83 B++ 1.23 A 0.42 A 0.23 B 1.25 A 1.46 B 2 0 0 8 -2 0 0 9 Mean (Year) 1.03 0.33 1.36 200 0.64 1.56 1.10 0.29 0.22 0.25 0.94 1.77 1.35 400 1.04 1.59 1.31 0.38 0.21 0.29 1.41 1.80 1.61 600 1.03 1.48 1.26 0.41 0.16 0.28 1.45 1.64 1.54 Mean (Loc) 0.90 B 1.54 A 0.34 A 0.20 B 1.26 1.73 2 0 0 9 -2 0 1 0 Mean (Year) 1.22 0.28 1.50
+) Values with the different small letter in a column in a year are significantly different according to the LSD test at P<0.05. *) Values with the different capital letter in a column in a year are significantly different according to the LSD test at P<0.05. ++) Means of location values with the different capital letter (within a line) are significantly different at P<0.05.
Table 6. Land Equivalent Ratio (LER) values for the mixtures of vetch and wheat as affected by the mixture ratio.
LER values
Vetch Wheat Total
Mixture Rate
(v:w) Hatay Adana Mean Hatay Adana Mean Hatay Adana Mean 75:25 0.89 c+ 1.15 b 1.02 0.15 d+ 0.06 e 0.11 C* 1.04 c+ 1.21 bc 1.26 C* 50:50 1.03 bc 1.16 b 1.09 0.37 c 0.16 d 0.26 B 1.40 b 1.31 b 1.36 B 25:75 0.58 d 1.38 a 0.98 0.74 a 0.47 b 0.61 A 1.31 b 1.85 a 1.59 A Mean (Loc) 0.83 B++ 1.23 A 0.42 A 0.23 B 1.25 B 1.46 A 2 0 0 8 -2 0 0 9 Mean (Year) 1.03 0.33 1.36 75:25 1.03 1.31 1.17 0.21 0.07 0.14 1.24 1.37 1.31 50:50 0.96 1.51 1.23 0.32 0.14 0.23 1.28 1.65 1.46 25:75 0.73 1.82 1.27 0.55 0.37 0.46 1.28 2.18 1.73 Mean (Loc) 0.90 B 1.54 A 0.34 A 0.20 B 1.26 1.73 2 0 0 9 -2 0 1 0 Mean (Year) 1.22 0.28 1.50
+) Values with the different small letter in a column in a year are significantly different according to the LSD test at P<0.05. *) Values with the different capital letter in a column in a year are significantly different according to the LSD test at P<0.05. ++) Means of location values with the different capital letter (within a line) are significantly different at P<0.05.
Table 7. Values of agressivity for the mixture components of the vetch + wheat mixture as affected by the plant density.
Aggressivity
Vetch Wheat
Plant Density
(plants m-2) Hatay Adana Mean Hatay Adana Mean
200 1.02 c+ 2.53 b 1.77 B* -1.02 a+ -2.53 b -1.77 A* 400 0.98 c 3.62 a 2.30 A -0.98 a -3.62c -2.30 B 600 1.24 c 2.04 b 1.64 B -1.24 a -2.04 b -1.64 A Mean (Loc) 1.08 B++ 2.73 A -1.08 A -2.73 B 2 0 0 8 -2 0 0 9 Mean (Year) 1.90 -1.90 200 0.92 3.50 2.21 -0.92 -3.50 -2.21 400 1.65 3.90 2.78 -1.65 -3.90 -2.78 600 1.41 3.56 2.49 -1.41 -3.56 -2.49 Mean (Loc) 1.33 B 3.66 A -1.33 A -3.66 B 2 0 0 9 -2 0 1 0 Mean (Year) 2.49 -2.49
+) Values with the different small letter in a column in a year are significantly different according to the LSD test at P<0.05. *) Values with the different capital letter in a column in a year are significantly different according to the LSD test at P<0.05. ++) Means of location values with the different capital letter (within a line) are significantly different at P<0.05.
L1 had clay soil with pH of 7.12, 6.45% CaCO3, 74.1 kg ha-1 phosphorus, and 1.93% organic matter at the depth of 30 cm. L2 had also clay soil with pH of 7.72, 7.30% CaCO3, 50.1 kg ha-1 phosphorus, and 1.81% organic matter at the depth of 30 cm. Climatic data of the locations during the experiment period were summarized in Table 1.
Crop management and experimental design
Common vetch (cv. Kubilay 82) and wheat (cv. Adana 99) were grown as sole crops and intercrops. Seed bed preparation included ploughing, disk harrowing, and cultivation. Sowing was performed by hand during second week of November at both locations.
503
Table 8. Values of aggressivity for the mixture components of the vetch + wheat mixture as affected by the mixture ratioAggressivity
Vetch Wheat
Mixture Rate
(v:w) Hatay Adana Mean Hatay Adana Mean
75:25 0.60 d+ 1.28 c 0.94 C* -0.60 a+ -1.28 b -0.94 A* 50:50 1.31 c 2.00 b 1.66 B -1.31 b -2.00 c -1.66 B 25:75 1.33 c 4.91 a 3.11 A -1.33 b -4.91 d -3.11 C Mean (Loc) 1.08 B++ 2.73 A -1.08 A++ -2.73 B 2 0 0 8 -2 0 0 9 Mean (Year) 1.90 -1.90 75:25 0.53e+ 1.46 cd 0.99 C -0.53 a+ -1.46 bc -0.99 A 50:50 1.28 de 2.73 b 2.01 B -1.28 ab -2.73d -2.01 B 25:75 2.17 bc 6.77a 4.47A -2.17 cd -6.77 e -4.47 C Mean (Loc) 1.33 B 3.66 A -1.33 A -3.66 B 2 0 0 9 -2 0 1 0 Mean (Year) 2.49 -2.49
+) Values with the different small letter in a column in a year are significantly different according to the LSD test at P<0.05. *) Values with the different capital letter in a column in a year are significantly different according to the LSD test at P<0.05. ++) Means of location values with the different capital letter (within a line) are significantly different at P<0.05.
Table 9. Values of competitive ratio for the mixture components of the vetch + wheat mixture as affected by the plant density
Competitive Ratio
Vetch Wheat
Plant Density (plants m-2)
Hatay Adana Mean Hatay Adana Mean
200 2.56 7.66 5.11 0.45 0.14 0.29 400 2.23 12.38 7.30 0.52 0.10 0.31 600 3.78 5.62 4.70 0.35 0.21 0.28 Mean (Loc) 2.86 B+ 8.55 A 0.44 A 0.15 B 2 0 0 8 -2 0 0 9 Mean (Year) 5.70 0.30 200 2.55 11.15 6.85 0.51 0.15 0.33 400 3.33 11.38 7.36 0.36 0.15 0.26 600 2.74 12.45 7.60 0.42 0.10 0.26 Mean (Loc) 2.88 B 11.66 A 0.43 A 0.13 B 2 0 0 9 -2 0 1 0 Mean (Year) 7.27 0.28
+) Means of location values with the different capital letter (within a line) are significantly different at P<0.05.
Table 10. Values of competitive ratio for the mixture components of the vetch + wheat mixture as affected by the mixture ratio
Competitive Ratio
Vetch Wheat
Mixture Rate
(v:w) Hatay Adana Mean Hatay Adana Mean
75:25 2.62 6.65 4.63 0.52 0.19 0.35 A* 50:50 2.86 8.40 5.63 0.37 0.14 0.25 B 25:75 3.09 10.61 6.85 0.44 0.12 0.28 AB Mean (Loc) 2.86 B+ 8.55 A 0.44 A 0.15 B 2 0 0 8 -2 0 0 9 Mean (Year) 5.70 0.30 75:25 1.68 d+ 7.25 c 4.46 C* 0.67 a+ 0.21cd 0.44 A 50:50 3.03 d 11.07 b 7.05 B 0.33 b 0.11de 0.22 B 25:75 3.91 d 16.67 a 10.29 A 0.28 bc 0.08 e 0.18 B Mean (Loc) 2.87 B 11.66 A 0.43 A 0.13 B 2 0 0 9 -2 0 1 0 Mean (Year) 7.27 0.28
+) Values with the different small letter in a column in a year are significantly different according to the LSD test at P<0.05. *) Values with the different capital letter in a column in a year are significantly different according to the LSD test at P<0.05. ++) Means of location values with the different capital letter (within a line) are significantly different at P<0.05.
Fertilizer rates of 50 kg ha-1 N and P2O5 were applied at sowing. The experimental design was split plot design with three replications. The main plot treatments were plant densities (200 plant m-2, 400 plant m-2 and 600 plant m-2) and sub-plots treatments were five seed mixture rates (pure vetch, 75% V+25%W, 50% V+50% W, 25% V+75% W and pure wheat) based on seed number. Thousand seeds weight of vetch was 70.0 g and the thousand kernel weight was 33.8 g. And then, required seed numbers were used according to
mixture rate in the experiment. Experimental plots had 4 rows with row spacing of 20 cm and a row length of 5 m. In the experiment, irrigation was not performed but weed control was manually. All pure stands and mixture treatments were harvested at the pod formation stage of common vetch at both locations. 1 kg green forage sample from each treatment was taken after harvest, species were separated by hand and then they were dried at 65 o C for dry matter determinations. Nitrogen concentration in ground subsamples
504
of vetch hay and wheat straw were determined by the Kjeldahl procedure (Bulgurlu and Ergul, 1978) and crude protein concentration was calculated by the formula of N concentration × 6.25.
Competition indexes
The land equivalent ratio (LER) was used as index for mixed stand advantage for both legume (common vetch) and cereal (wheat). LER values were calculated as fallow:
LER= (LERvetch + LER wheat), LERvetch=(Yvw/Yv), LERwheat=(Ywv/Yw)
Where Y v and Y w were the yields of common vetch and wheat as sole crop, respectively, and Yvw and Ywv were yields of common vetch and wheat in the mixture, respectively. When LER is greater than 1, the mixed growing favors the growth and yield of species. In contrast, when LER is lower than 1, the mixed growing negatively affects the growth and yield of plants grown in mixture (Caballero et al., 1995; Dhima et al., 2007). The other index used to determine the competitive relationship between two crops in mixtures is aggressivity (A), (Bhatti et al., 2006). Aggressivity is formulated by McGilchrist (1965) as below:
Awheat= {Ywv/(YwZwv)}- {Yvw/(YvZvw)} Avetch={Yvw/(YvZvw)}- {Ywv/(YwZwv)},
Where, Zvw and Zwv were the seed rates of common vetch and wheat in the seed mixture. If Awheat = 0 both crops are equally competitive, If Awheat is positive, then the wheat is dominant, if Awheat is negative, then the wheat is dominated by vetch in the mixture (Wahla et al., 2009). Competitive ratio (CR) is another way to assess competitive ability between different species. The CR gives more desirable competitive ability for the crops and also advantages over other indexes. The CR represents simply the ratio of individual LER of the two component crops in which they are initially sown. Then, the CR index was formulated as below;
CRvetch= (LERvetch/LERwheat) (Zwv/Zvw)
Data were analyzed by using the MSTAT-C computer software program. The ANOVA was performed by using split plot design with the 3 main plot treatments and 5 sub-plot treatments replicated three times. Treatment mean differences were separated and tested by Fisher’s protected least significant difference (LSD) at P = 0.05 significance level. As the analysis of variance indicated years were significant the values were reported as means of the two growing seasons.
References
Anil L, Park J, Phipps RH, Miller FA (1998) Temperate intercropping of cereals for forage: a review of the potential for growth and utilization with particular reference to the UK. Grass Forage Sci 53:301-317.
Assefa G, Ledin I (2001) Effect of variety, soil type and fertilizer on the establishment, growth, forage yield, quality and voluntary intake by cattle of oats and vetches cultivated in pure stands and mixtures. Anim Feed Sci Technol 92: 95–111.
Bhatti IH, Ahmad R, Jabbar A, Nazir MS, Mahmood T (2006) Competitive behaviour of component crops in different sesame-legume intercropping systems. Int J Agric Biol 8:165-167.
Bulgurlu S, Ergul M (1978) The physical, chemical and biological analysis methods of feeds. Ege Univ Agric Fac Nr:127, Izmir.
Cabellero R, Goicoechea EL, Hernaiz PJ (1995) Forage yields and quality of common vetch and oat sown at varying seeding ratios and seeding rates of common vetch. Field Crops Res 41: 135-140.
Connolly J, Wayne P, Bazzaz FA (2001) Interspecific competition in plants: how well do current methods answer fundamental questions? Am. Nat 157: 107–125.
Dhima KV, Lithourgidis AS, Vasilakoglou IB, Dordas CA (2007) Competition indices of common vetch and cereal intercrops in two seeding ratio. Field Crops Res 100: 249-256.
Erol A, Kaplan M, Kizilsimsek M (2009) Oats (Avena sativa) — common vetch (Vicia sativa) mixtures grown on a low-input basis for a sustainable agriculture. Trop Grasslands 43:191–196.
Eskandari H, Ghanbari A, Javanmard A (2009) Intercropping of cereals and legumes for forage production. Not Sci Biol 1(1): 7-13.
Hauggaard-Nielsen H, Andersen MK, Jørnsgaard B, Jensen ES (2006) Density and relative frequency effects on competitive interactions and resource use in pea-barley intercrops. Field Crops Res 95:256-267.
Haynes RJ (1980) Competitive aspects of the grass- legume association. Adv Agron 33: 227-261.
Karadag Y, Buyukburc U (2003) Effect of seed rates on forage production, seed yield and hay quality of annual legume-barley mixtures. Turk J Agric For 27: 169-174. Kokten K, Celiktas N, Atis I, Hatipoglu R, Tukel T (2003)
Research on effects of sowing rate and mixture rate on hay yield and hay quality of mixture of vetch and triticale under dryland of Cukurova. Presented at the Turkey 5. Field Crops Congress, University of Dicle, Diyarbakir/Turkey, 13-17 October 2003.
Kokten K, Toklu F, Atis I, Hatipoglu R (2009) Effects of seeding rate on forage yield and quality of vetch (Vicia sativa L.) - triticale (Triticosecale Wittm.) mixtures under East Mediterranean rainfed conditions. Afr J Biotechnol 8:5367-5372.
Lithourgidis AS, Vasilakoglou IB, Dhima KV, Dordas CA, Yiakoulaki MD (2006) Forage yield and quality of common vetch mixtures with oat and triticale in two seeding ratios. Field Crops Res 99:106-113.
Lithourgidis AS, Dordas CA, Damalas CA, Vlachostergios DN (2011) Annual intercrops: an alternative pathway for sustainable agriculture. Aust J Crop Sci 5(4):396-410. Mariotti M, Masoni A, Ercoli L, Arduini I (2009) Above- and
below-ground competition between barley, wheat, lupin and vetch in a cereal and legume intercropping system. Grass Forage Sci 64:401-412.
McGilchrist CA (1965) Analysis of competition experiments. Biometrics 21: 975–985.
Pasynkova EN, Zavalin AA (2010) Evaluation of the efficiency of spring wheat and vetch mixed crops. Russ Agric Sci 36(1): 5–8.
Rahetlah VB, Randrianaivoarivony JM, Razafimpamoa LH, Ramalanjaona VL (2010) Effects of seeding rates on forage yield and quality of oat (Avena sativa L.) vetch (Vicia sativa L.) mixtures under irrigated conditions of Madagascar. African J Food Agric Nutr Develop 10:4254-42167.
505
Rakeih N, Kayyal H, Larbi A, Habib N (2010) Forage yield and competition indices of triticale and barley mixed intercropping with common vetch and grasspea in the Mediterranean region. Jordan J Agric Sci 6:194-207. Tukel T, Hasar E, Hatipoglu R (1997) Effect of mixture rates
and cutting dates on the forage yield and quality of vetch-triticale mixtures and their seed yields under lowland conditions of Cukurova. XVIIIrd International Grassland Congress, Canada, 8-19 June 1997.
Tuna C, Orak A (2007) The role of intercropping on yield potential of common vetch (Vicia sativa L.)/ oat (Avena sativa L.) cultivated in pure stand and mixtures. J Agric Biol Sci 2(2):14-19.
Turk MA, Abdel-Rahman, Tawaha M (2002) Effect of variable sowing ratios and sowing rates of bitter vetch on the herbage yield of barley-bitter vetch mixed cropping. Asian J Plant Sci 4:467-469.
Wahla IH, Ahmad R, Ehsanullah, Ahmad A, Jabbar A (2009) Competitive functions of components crops in some barley based intercropping systems. Int J Agric Biol 11: 69–72.
Weigelt A, Jolliffe P (2003) Indices of plant competition. J Ecol 91:707–720.
Yilmaz S (2005) Determining intra-and inter- specific competition in vetch (Vicia sativa L.) and barley (Hordeum vulgare L.) mixtures. MSc Thesis, Institute of Naturel and Applied Sciences, University of Cukurova, Adana/Turkey. Yilmaz S, Atak M, Erayman M (2008) Identification of
advantages of maize-legume intercropping over solitary cropping through competition indices in the East Mediterranean Region. Turk J Agric For 32:111-119.