6 Price competition between
Turkish and East Asian exports
in the European Union
market in the 1990s
An empirical investigation*
Zelal Kotan and Serdar Sayan
1 Introduction
Turkey experienced a major export boom following the introduction of the structural adjustment programme of 1980, which entailed a decisive policy switch from protectionist import substitution policies to trade liberalization and export orientation. The value of exports increased from $2.26 billion in 1979 to $12.96 billion in 1990, rising to almost $31 billion in 200 I. The composition of exports also underwent a major change, shifting away from heavy concentration in agri-cultural and livestock products and towards manufactured goods, principally textiles and garments, iron and steel, and food-processing products (Sayan and Demir 2003). Yet, this initial phase of diversification signalled only a change in the commodity composition of Turkish exports, rather than marking a transfor-mation in its market concentration. Textiles and clothing, for example, signifi-cantly increased their shares in total exports, reaching about 44 per cent after
1989 (Erlat 1993). Similarly, despite a visible increase in the number of export destinations after 1980, a greater portion of Turkish exports continued to be shipped to relatively few markets, particularly the European Union (EU). 1
Such concentration of exports with respect to markets and product categories has the potential to make the country's export receipts vulnerable to variations in the demand. Given the intensity of competition that Turkish exports face from close substitutes from other countries, increasing export receipts and market shares often involves price competition. The EU market is particularly important within this context, since it has traditionally been the major export destination for Turkish products. Yet, for most Turkish manufacturing exporters, the EU market is subject to intense competition.
In this chapter, we consider price competition between Turkish and East Asian (EA) exports of selected manufacturing products in the EU market. We conduct an empirical investigation into the nature and effectiveness of this competition, focusing on Turkish competition with EA exports. This focus is due to the importance of the East Asian countries as Turkey's main competitors in the EU market as frequently cited by the Turkish Exporters' Association during the 1990s.
120 Zeta! Katan and Serdar Sayan
For this purpose, we develop and estimate a model for a series of commodities, using data from 1990 to 1999. The model we develop is similar to that used in Merkies and Van Der Meer (1988) and relates the respective market shares of Turkish and EA exporters to relative prices charged by each country's exporters against competitors.
We analyse markets for six commodity groups: 'Textiles', 'Clothing', 'Road vehicles', 'Electrical machinery', 'Power generating machinery', and 'Telecom-munications equipment'. Textiles and Clothing are intuitive choices as they have long been major export sectors for Turkey:2 due to their weight in total exports, fluctuations in these exports can cause significant variations in Turkey's export receipts. Moreover, textile exports are known to significantly contribute to eco-nomic growth (Guerrieri and Milana 1995) and to have a potentially important role in improving a country's overall competitiveness in international markets (Daniels 1999).
Even so, the 1990s was a decade during which the relative significance of textiles and garment exports declined, while that of other categories increased (Lohrmann 2000): thus, the other commodity groups in the list were selected as up-and-coming export categories for Turkey, with the potential to replace Textiles and Clothing as the leading source of export revenue (see Appendix 6.Al for the commodity coverage of these groups).3 These commodities are also highly tradable goods with an increasing share in total exports of both Turkey and the EA countries as well as in world trade, especially in recent years.4
Our country sample includes China, Hong Kong, Republic of Korea (hereafter, South Korea), and Taiwan as the main EA group of competitors against Turkish exports in the EU markets. The selection of these countries in our sample was determined on the basis of export similarity indices calculated for Turkey vis-a-vis each of these countries.
Our analysis provides evidence that price competition is important in explain-ing the shares of Turkish and EA exports in the EU market, and produces useful information on relative price elasticities. We also explore ways in which the possible contributions of Turkey's proximity to the EU market as well as the Customs Union (CU) between Turkey and the EU may be evaluated with regard to the competitiveness of Turkish products.
The rest of the discussion is organized as follows. The next section provides an overview of the export performance of the product groups under consideration within the last decade. Section 3 describes the data and the framework of investi-gation. The results obtained are presented in Section 4. The last section concludes the chapter with a summary of the findings and suggestions for further research.
2 The performance of Turkish exports in the 1990s
The 1990s witnessed a structural change in the growth and composition of Turkey's exports. The initial export boom of the early to mid-l 980s was fuelled by excess production capacity in the manufacturing sector, itself the result of a comprehensive structural adjustment programme introduced in 1980. The
Competition between Turkish and East Asian exports 121
programme started with a devaluation and was followed by measures aimed at the liberalization of trade and financial markets. As a consequence of the contraction in domestic demand (which resulted from wage restraints), many sectors traditionally serving the domestic market looked abroad for new markets. The result was a significant increase in the value and diversity of exports, a trend that continued for most of the 1980s (Uygur 1997, Kotan and Sayan 200 l ).
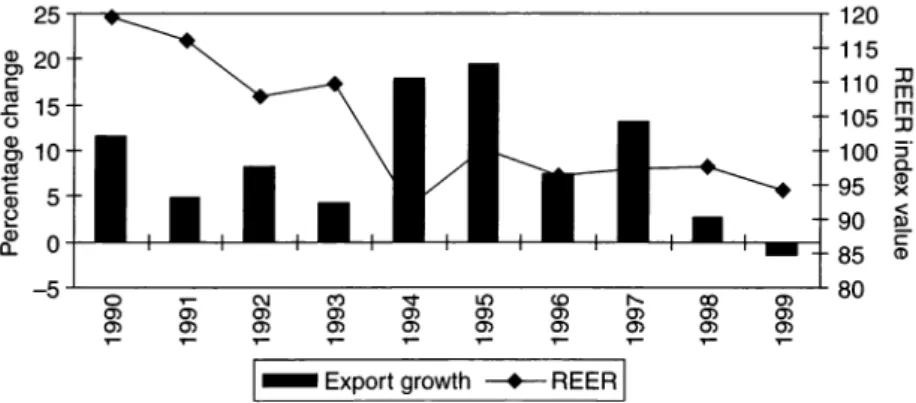
An examination of Turkey's export performance in the 1990s, though, reveals that both export growth and the ratio of exports to GNP experienced marked fluc-tuations (Figure 6.1 ). The slow export growth of the period 1990-3 can be attrib-uted to the overvaluation of the domestic currency. By 1994, however, growth had been restored thanks to a sizeable real depreciation of the currency.
This correspondence between high rates of export growth and real depre-ciations (Figure 6.2)5 implies that export performance and real exchange rate movements are strongly correlated (Brada et al. 1997).
40~~~~~~~~~~~~~~~~~~~~~~~~15 ~ 30
e
~20 !6' i: 10 (I) ~if.
0I -
Export growth-+-
Exports to GNP ratioI
Figure 6.1 Growth of exports and exports to GNP ratio, 1980--99. Source: SIS (2001) and CBRT (2001).
25 2l, 20 C: ~ 15 0 2l, 10 .l!! C: 5 (I)
e
cf.
0 -5 0 0) C\I C') 'st IO <OI'-;;;
0) 0) 0) 0) 0) 0) 0) 0) 0) 0) 0) 0) 0) 0)I-
Export growth--+-
REERI
120 115 110 105 100 95 90 85 CX) 0) 80 0) 0) 0) 0) ::0 m m ::0 5· a. ~ pl C: CD
Figure 6.2 Export growth and changes in real effective exchange rate (REER), 1990--9. Source: SIS (2001) and CBRT (2001).
122 Zelal Katan and Serdar Sayan
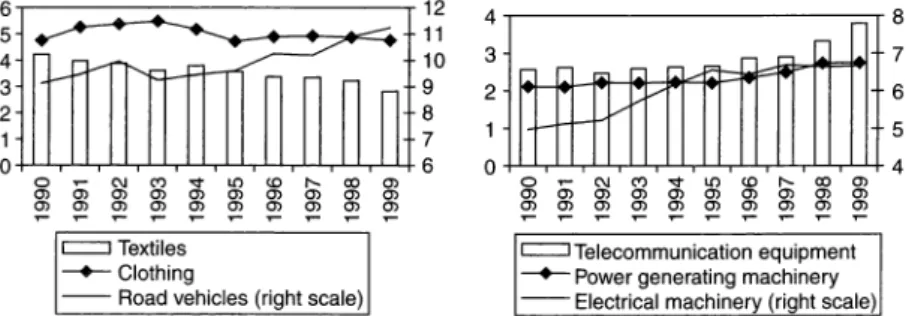
Other than changes in the real value of the Turkish Lira (TL), developments in major export markets, particularly in the EU, affected Turkey's export perform-ance during the 1990s as well. Using constant market share (CMS) analysis, for instance, Kotan (2000) shows that a slower growth of EU imports ( compared to the rest of the world) during the period 1990-7 has impeded Turkish exports to some extent. The analysis in Kotan (2000) shows further that this slowdown in import demand by the EU was accompanied by a change in the composition of its imports. The EU's demand for textiles and clothing declined during the second half of this period, whereas its demand for the other product groups under con-sideration here increased, leading to a gradual increase of these products in total imports. The two panels in Figure 6.3 illustrate the developments in the shares of these groups in EU imports.
Since the EU is Turkey's major market, the decline in the share of textiles and clothing in total EU imports affected the performance of this leading export sec-tor for Turkey. Even though textiles and clothing exports managed to catch up with the performance of manufacturing exports, which continued to grow faster than total exports in the 1990s, the composition of Turkish exports changed due primarily to the remarkable export performance of the other product categories we consider. The progress of Electrical machinery, Power generating machinery, Telecommunications equipment, and especially Road vehicles sectors was indeed exceptional, with the average annual growth rate of exports increasing from 20.1 per cent in 1990-3 to 41.5 per cent in 1994-9 (Figure 6.4).6
Turkish producers of the non-agro-based products considered here managed to increase their exports to the EU just when the EU's import demand for these prod-ucts expanded. The remarkable exports growth for this group of prodprod-ucts in fact helped counter the effects of the contraction in the Textiles and Clothing exports receipts. As a result, recent developments in the EU's demand for imports do not appear to have adversely affected Turkey's export receipts. However, heavy dependence of Turkish exports, both in terms of composition and volume, on these developments remains a cause for concern for both policy makers and exporters in Turkey.
c::::::J Textiles --+-Clothing
- - Road vehicles (right scale)
c::::::J Telecommunication equipment --+-Power generating machinery - - Electrical machinery (right scale)
Figure 6. 3 Shares of selected product groups in the EU imports (% ), 1990-9. Source: OECD International Trade Statistics CD-ROM.
Competition between Turkish and East Asian exports 123 100 . - - - ~ 80 60 40 20 0 +4c..,..iiii[L,.ll5,,d!!!L,D,::e,l;~:;;s.,....rl -20 - 4 0 ~ - - - ~ cii C\I c,:)
....
It) <O ,.._ a, C!)C!) C!) C!) C!) C!) C!) C!) C!) ~ ~ C!) C!) C!) C!) C!) ~ ~ ~ ~ ~ ~ c:::J Total exports
-+--
Tex1iles ---e--- Clothing --- Road vehicles 100 . - - - ~ 80 60 40 20 0 .µ::7>.-LLr'GIL,,.,1=-,...LJ-,--L--'---,--"-L-,dS"--r-=-i -20 - 4 0 ~ - - - ~ c:::J Total exports-+--
Power generating machinery---e--- Telecommunication equipment --- Electrical machinery Figure 6.4 Growth rates of Turkish exports in selected sectors, 1990--9. Source: OECD International Trade Statistics CD-ROM.
In general, concentration of exports with respect to markets and product groups has the potential to negatively affect the overall export performance of a country and its receipts. Such concentration may be particularly damaging for the export-ing country, when world demand for the products in question or the total demand for imports in major markets falls (Lloyd 1994). In such cases, it may become very hard for the exporting country to maintain - let alone increase - its market share. Changes in export performance due to shifts in the degree of competitive-ness, on the other hand, are easier to deal with as policy measures may be very effective in such instances. In fact, relative price disturbances may alter the competitive position of a country in the export market, having a considerable effect on overall export performance (Lloyd 1994).7
Assessing the competitive position of Turkish exports vis-a-vis EA exports to the EU market requires an understanding of the performance of EA exports for the product groups studied here. The next section provides evidence concerning the importance of price competition in the EU market for these products, and discusses Turkey's additional advantages of geographic proximity and CU membership with the EU.
3 Empirical investigation - the framework
In this section, we explain how we can estimate the effectiveness of price competition between Turkey and the EA countries with respect to the six product groups under consideration here.
3.1 Theoretical background
We begin our analysis by considering homothetic import demand functions resulting from a two-stage utility maximization process (Merkies and Van Der Meer 1988). In the first stage, a constant elasticity of substitution (CES) utility
124 Zelal Katan and Serdar Sayan
function is maximized subject to the import budget of the importing country (EU in this case), to be allocated between a number of commodities indexed by
k E { I, 2, ... , m}. The solution to this problem enables us to express
M",
the opti-mum demand for commodity k imports by the EU, as a function of the total demand for imports, M; the ratio of the import price index of commodity k,P'<,
to the overall import price level, P; and a parameter representing the stable taste pattern of the EU,
~i.
That is:(pi<)(l
-u)M"=
'flM -p (6.1)where a is the elasticity of substitution at the top level of utility maximization. 8
In the second stage, a utility function similar to that of the first stage is maximized subject to the budget allocated to the imports of commodity k (as determined in the previous stage) so as to determine imports from exporters of different countries. The solution to this problem yields:
(6.2)
where n is the index for the country supplying commodity k to the EU.
Equation (6.2) shows that~' the optimum import demand for each commod-ity k by the EU from each exporter n, depends on the optimum level of import demand for commodity k -
M"
in Equation (6.1), a price ratio, and the corre-sponding stable taste pattern parameter, B!. The price ratio shows the price that the exporting country n charges for commodity k relative to that commodity's average import price in the EU market. 3k in Equation (6.2) is the elasticity parameter which, when subtracted from I, measures the percentage change in the share of exporting country n in the commodity k imports resulting from a one per cent increase in the price charged by country n exports relative to average import price. This interpretation of ak follows from:din(::)= (I -
~
d In(::) (6.3)Equation (6.3) indicates that when the price of commodity k exported from Turkey to the EU increases relative to the prices charged by EA exports, Turkey loses her relative price competitiveness, and hence market share, in the EU market.
To proceed with the estimation, Equation (6.2) is manipulated to convert it into the following form (Kotan and Sayan 2001):
Competition between Turkish and East Asian exports 125 where the product of the terms in brackets with the base period values of
M':,
serves to obtain the error terms with equal variances (Kotan and Sayan 200 I).3.2 Data and estimation
Equation ( 4) has been estimated using data for the period between 1990 and 1999. The product coverage of each category is given in Appendix 6.Al in terms of three..:digit Standard International Trade Classification (SITC) Revision 3. Values and prices of total imports and exports were taken from IMF's International
Financial Statistics CD-ROM. All trade data (manufacturing exports from Turkey and EA countries to the EU, as well as EU's manufacturing imports from Turkey, EA countries, and the rest of the world) are obtained from the OECD International
Trade Statistics CD-ROM, expressed both in values and quantities. Export and import prices were calculated by dividing values by respective quantities and then indexing by the Laspeyres method. 9
In selecting the EA countries for our sample, two criteria were used. Availability of data as well as the export similarity indices calculated for Turkey vis-a-vis China, Hong Kong, South Korea, and Taiwan (see Appendix 6.B 1 ). The degree of similarity in the case of Textiles and Clothing was found to be high. In this category, Turkish exports turned out to have the highest degree of export sim-ilarity with exports from China and Hong Kong. Unlike the export similarities for Textiles and Clothing, however, the similarity index for Electrical machinery exports turned out to be fairly low throughout the 1990s. In addition, export sim-ilarity indices declined slightly over time in the case of Power generating machin-ery and Telecommunications equipment. In the case of Road vehicles, on the other hand, initially low values of similarity indices at the beginning of the 1990s significantly increased over time for all countries under consideration. For exam-ple, the export similarity index for Turkey vis-a-vis South Korea, the highest of all, rose from 2.3 in 1990 to 25.8 in 1999.
A fixed-effects model is used in the panel data estimation of Equation (6.3) using ordinary least squares (OLS) (Matyas 1995). The fixed-effects model is chosen since it estimates the model conditionally on errors using the simple OLS technique, thereby ignoring the dependence of the errors and regressors. Regardless of whether the errors that are initially assumed to be random are correlated with one or more regressors, the fixed effects estimator depends only on the deviations of the regressand and regressors from group means. The estimates remain consistent within the group, even though they may be inconsistent for the full sample (Davidson and MacKinnon 1993).
4 Empirical findings
Our empirical analysis was carried out first by considering the 1990-9 period as a whole. Two sub-periods, 1990--4 and 1995-9, corresponding to low- and high-growth periods for Turkish exports, respectively ( and high and low values of real
126 Zelal Kotan and Serdar Sayan
exchange rates), were then considered separately to see if there would be any dif-ferences in results across these two periods.
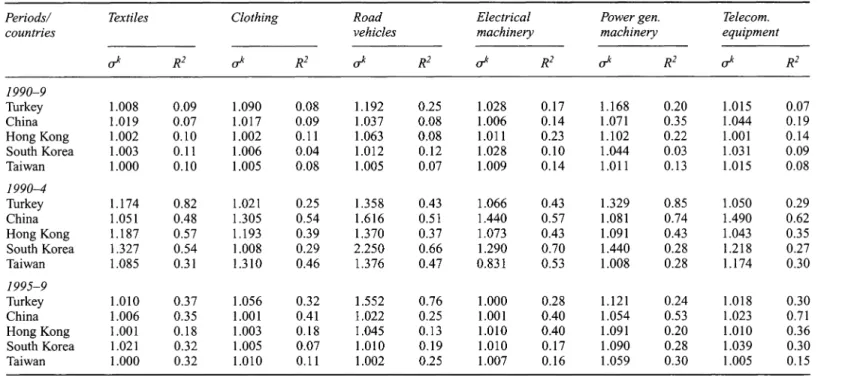
Panel data estimation results for the entire sample period indicate that relative prices are not significant determinants of the relative shares of the EU's total imports from Turkey, China, Hong Kong, South Korea, and Taiwan. However, separately estimating the equation for the two sub-periods leads to considerably different results. The estimates of elasticities of substitution vary widely, imply-ing that margins for chargimply-ing high mark-ups over cost in the short- to medium-run changed for exporters during the 1990s. Table 6.1 presents the panel data estimation results for each country, by period and for the relevant product groups.
It must be noted that all estimates for
u*
(the elasticity of substitution for prod-uct category k ) reported in the table are statistically significant at the one per cent level and all have the expected signs. 10The results imply that relative prices notably affected the relative shares of Turkey, China, Hong Kong, South Korea, and Taiwan in the EU's textiles imports during the period 1990-4. In other words, when export prices in a given country increase relative to competitor countries, that country stands to lose part of its share in the EU market. The estimated values indicate that the EU's demand for imports of textiles from all countries in the sample is elastic. This is especially the case for imports from Turkey, South Korea, and Hong Kong. The R2 values
reported in the second column of Table 6.1 imply that price competition explains over 80 per cent of the movements in the relative share of Turkish exports and nearly half of the relative shares of EA exports to the EU's textiles market during the first half of the 1990s. It is further observed from the R2 values that during the
1990-4 period, price competition better explains the share of each exporting country in the EU market than in the 1995-9 period. Thus, it appears that com-petition over market shares was subject to stiffer price comcom-petition in the first sub-period than in the second.
The estimation results for clothing exports reported in the third and fourth columns ofTable 6.1 are similar to the results for textiles. Relatively higher prices for one exporting country will reduce its market share relative to others here too; and the elasticities declined during the 1995-9 period for all EAs. A comparison of R2 values across the two sub-periods indicates that price competition gets
rel-atively stiffer in the second period, for Turkish clothing exports only. The EU's elasticities of substitution among the exporters of clothing are observed to decrease somewhat after 1994, implying that the pressure of price competition diminishes in the 1995-9 period compared to the previous sub-period. The reduc-tion in the elasticities of substitureduc-tion in the second period also implies that it becomes relatively easier to charge higher mark-ups over cost, with a lower risk of losing market share.
The results reported in the fifth and sixth columns ofTable 6.1 depict a similar picture for Road vehicles. R2 values for the 1990-4 period show that price
competition explains almost half of the market share for each EA road vehicle manufacturer exporting to the EU (for South Korea this ratio is as high as
Table 6.1 Estimated results for the selected product groups
Periods/ Textiles Clothing Road Electrical Power gen. Telecom.
countries vehicles machinery machinery equipment
- -
-cl'
R2cl'
R2cl'
R2cl'
R2cl'
R2cl'
R2 1990-9 Turkey 1.008 0.09 1.090 0.08 1.192 0.25 1.028 0.17 1.168 0.20 1.015 0.07 China 1.019 0.07 1.017 0.09 1.037 0.08 1.006 0.14 1.071 0.35 1.044 0.19 Hong Kong 1.002 0.10 1.002 0.11 1.063 0.08 1.011 0.23 1.102 0.22 1.001 0.14 South Korea 1.003 0.11 1.006 0.04 1.012 0.12 1.028 0.10 1.044 0.03 1.031 0.09 Taiwan 1.000 0.10 1.005 0.08 1.005 0.07 1.009 0.14 1.011 0.13 1.015 0.08 1990-4 Turkey 1.174 0.82 1.021 0.25 1.358 0.43 1.066 0.43 1.329 0.85 1.050 0.29 China 1.051 0.48 1.305 0.54 1.616 0.51 1.440 0.57 1.081 0.74 1.490 0.62 Hong Kong 1.187 0.57 1.193 0.39 1.370 0.37 1.073 0.43 1.091 0.43 1.043 0.35 South Korea 1.327 0.54 1.008 0.29 2.250 0.66 1.290 0.70 1.440 0.28 1.218 0.27 Taiwan 1.085 0.31 1.310 0.46 1.376 0.47 0.831 0.53 1.008 0.28 1.174 0.30 1995-9 Turkey 1.010 0.37 1.056 0.32 1.552 0.76 1.000 0.28 1.121 0.24 1.018 0.30 China 1.006 0.35 1.001 0.41 1.022 0.25 1.001 0.40 1.054 0.53 1.023 0.71 Hong Kong 1.001 0.18 1.003 0.18 1.045 0.13 1.010 0.40 1.091 0.20 1.010 0.36 South Korea 1.021 0.32 1.005 0.07 1.010 0.19 1.010 0.17 1.090 0.28 1.039 0.30 Taiwan 1.000 0.32 1.010 0.11 1.002 0.25 1.007 0.16 1.059 0.30 1.005 0.15128 Zelal Katan and Serdar Sayan
two-thirds). Considerably high elasticities of substitution during the same period reveal that exporters did not have wide margins for charging mark-ups over cost. However, both the elasticities and explanatory power of price competition for EAs are observed to decline significantly after 1994. Turkey, on the other hand, became increasingly more dependent on price competition during the second half of 1990s in this sector.
The results for exports of Electrical machinery and Power generating machinery are presented in columns 7-10 of the same table. During the 1990--4 period, price competition in these two sectors explains a significant part of each exporter's share in the EU market ( see the relevant R2 values). These values are particularly high for Turkey and China in the Power generating machinery market. This is due to the high elasticities of substitution in the same period, which do not allow for wide margins between costs and prices. In the 1995-9 period, on the other hand, the influence of price competition on market shares declined considerably as seen in the reduced elasticities of substitution.
In the case of Telecommunications equipment, we do not find much deviation between the estimated elasticities of substitution of the two consecutive sub-periods (see the last two columns in Table 6.1). This implies that the nature of price competition did not change significantly during the 1990s in this sector. However, the elasticities of substitution declined in the latter period, especially for China and South Korea, giving exporters from these countries more scope to charge higher mark-ups.
An overview of the results in Table 6.1 reveals that price competition explains a greater portion of shifts in the relative shares of Turkey and EAs in the EU mar-kets in the 1990--4 period, as indicated by generally higher R2 values for this period. Road vehicles exports from Turkey are a notable exception, as dependence on price competition increases after 1994. In all other cases, the role of price pres-sures in determining market shares declines during 1995 and 1999, although the extent of the decline varies from one exporting country to another.
Increased intensity of price competition for Turkish products over the 1990--4 period is consistent with the relatively poor export performance of the country during this period when the overvaluation of domestic currency slowed export growth. In addition, despite a visible increase in the exports of products other than Textiles and Clothing, especially after 1994, Turkey did not manage to fully adapt its export structure to its growing markets and commodity groups (Lohrmann 2000). The country remained mostly a spectator while the EA countries gained a sizeable share in the world trade of those products (Noland 1997).
However, Turkish exports enjoy two potentially important advantages over their EA competitors. First, the geographic proximity of Turkey to the EU's markets and the associated transportation cost advantage is expected to enable Turkish exporters to charge relatively lower prices.11 Secondly, Turkey's membership of a CU with the EU makes it possible for Turkish manufactures to enter EU markets free from the customs duties to which EA exports are subject.
Even though the cost advantage due to Turkey's geographic proximity to the EU would be expected to be equally applicable to exporters of all products, our
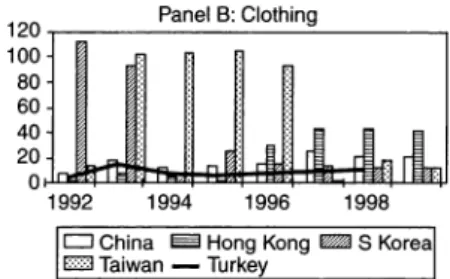
Competition between Turkish and East Asian exports 129 examination of the differences between cost, insurance, and freight (CIF) and free on board (FOB) prices of EU imports point in an interesting direction.12 The dif-ferences we have calculated between CIF import and FOB export prices for the product groups and countries in our sample indicate that only certain Turkish commodity exports to the EU benefit from the 'proximity' advantage. Textiles, Clothing and Road vehicles have transportation cost advantages but not the exports of Telecommunications equipment, or Electrical and Power generating machinery exports.
To illustrate this, we calculated the differences between the CIF and FOB prices of Textiles, Clothing, and Road vehicles for Turkey and EA countries in the EU markets. These are then presented in panels A-C in Figure 6.5. It can be clearly observed that the difference is markedly lower for Turkish exports com-pared to other countries, clearly pointing to a Turkish exporters' cost advantage in these products due to proximity factors.
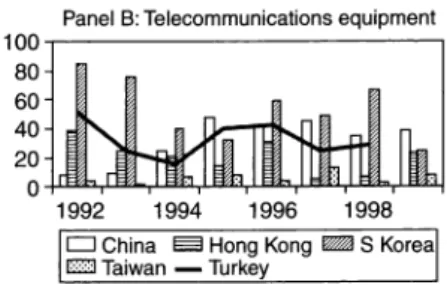
When the differences between CIF import and FOB export prices of Electrical machinery, Power generating machinery, and Telecommunications equipment are considered, the situation is somewhat reversed. Panels A and B of Figure 6.6 show that price differences are higher for Turkey in some years but lower in others for Electrical machinery and Telecommunications equipment. This implies that Turkey's proximity advantage is not as strong in the case of these products as in the case of Textiles, Clothing, and Road vehicles.
Panel A: Textiles
,~l!A .
.J.J.~ .•.
,.~.~I
1992 1994 1996 1998 CJ China ~ Hong Kong ll!!m S Korea
Em Taiwan - Turkey
:~lil
1992 1994T"f
1996j"~.~
1998~I
CJ China ~ Hong Kong B S Korea GD Taiwan - Turkey
Panel C: Road vehicles
1992 1994 1996 1998 CJ China ~ Hong Kong B S Korea
Em Taiwan - Turkey
Figure 6.5 Export (FOB) and import (CIF) price differences, 1992-9. Panel A: Textiles; Panel B: Clothing; Panel C: Road vehicles.
130 Zelal Kotan and Serdar Sayan
:~l-dl '!~J~~~I
1992 1994 1996 1998 1992 1994 1996 1998D China ~ Hong Kong l!llml S Korea
Eill Taiwan - Turkey
D China ~ Hong Kong E S Korea
~ Taiwan - Turkey
Panel C: Power generating machinery
'~Jati
!~o
~•-JI
J
I
I I I
1992 1994 1996 1998
D China Eeel Hong Kong • S Korea Em Taiwan - Turkey
Figure 6.6 Export (FOB) and import (CIF) price differences, 1992-9; Panel A: Electrical
machinery; Panel B: Telecommunications equipment; Panel C: Power generating machinery.
Source: Authors' calculations based on OECD data.
In the case of Power generating machinery, the differences between CIF import and FOB export prices for Turkey are higher during the first sub-period under consideration, but they begin to decline gradually after 1995, indicating that the cost advantage may disappear over time (Figure 6.6, panel C). One possible explanation of this phenomenon may be due to the economies of scale involved in the EA's exports to the EU (Noland 1997, Kotan and Sayan 2001). In other words, the volume of shipments may enable EA exporters to overcome Turkey's transportation cost advantages vis-a-vis EU markets.
In addition to geographic proximity, the 1996 Turkey-EU CU agreement offers an additional advantage to Turkish exports. Under this agreement, customs duties on Turkish manufacturing exports to the EU are to be phased out gradually. However, the effects of Turkey's membership in the CU on her price competitive-ness cannot be explored here since the gradual nature of the reductions make the extraction of relevant information from the data very difficult.
5 Conclusions
This chapter has investigated the nature and effectiveness of price competition between Turkish and EA exports of selected manufacturing products in the EU
Competition between Turkish and East Asian exports 131 market between 1990 and 1999. For this purpose, we estimated a model that allows relative market shares of Turkish and EA exporters in the EU markets to be determined by prices of imports from respective countries. We considered People's Republic of China, Hong Kong, South Korea, and Taiwan as Turkey's main EA competitors in the EU markets.
In our analysis, we focused on six commodity groups: Textiles, Clothing, Road vehicles, Electrical machinery, Power generating machinery, and Telecommunications equipment. The first two groups were included in the sample in view of their importance as Turkey's leading exports, especially in recent decades. As such, variations in the Textiles and Clothing exports may cause serious fluctuations in Turkey's export receipts. The latter four groups, on the other hand, have become more important for Turkey recently. Exports of these products have risen in importance in world trade too. They can potentially help improve a country's international competitiveness and, hence, prospects for growth.
The results of the panel data estimation suggested that relative price movements play an important role in determining the relative shares of Turkey and EA countries in the EU market for the product groups considered during the 1990-4 period. More precisely, our estimations confirmed that a country's share of exports in the EU markets for a particular product group is inversely related to its relative price movements. However, this dependence fell considerably in the 1995-9 period, except for Turkey's Road vehicle exports, which became more dependent on price competition after 1994.
The results also indicated that the EU's import demand for all product groups was elastic during the period 1990-4, implying that the exporters of these prod-ucts would not be able to charge high mark-ups over their costs in that period. On the contrary, elasticity was lower during the period 1995-9 allowing them to charge higher mark-ups over costs without risking a significant loss in their market shares
Within this context, Turkish exporters shipping their products to the EU market were noted to have two potential advantages over their competitors from the EA countries. First, the geographical proximity of Turkey to the EU entails lower transportation costs for Turkish exports. Yet, further investigation of this issue led to the remarkable finding that the cost reducing effects of geographical proxim-ity do not equally apply to all product groups considered. While Turkey's prox-imity advantage was clearly visible in the case of Textiles, Clothing, and Road vehicles, this was not so for other product groups. The explanation we offered for this asymmetry was based on the economies of scale associated with the large volumes of EA shipments to the EU.
A second advantage of Turkish exporters is thought to come from Turkey's special status vis-a-vis the EU, involving a gradual abolition of customs duties on Turkish manufacturing exports to the EU. In fact, custom duties were bilaterally reduced to very low levels or were totally abolished for certain products long before the CU agreement was put into effect in 1996 (DPT 1995). However, due to data restrictions, a full exploration of this issue was beyond the scope of this chapter.
132 Zelal Kotan and Serdar Sayan
In conclusion, our results indicate that the cost reducing effects of shorter distances and preferential customs duties on the competitiveness of Turkish man-ufacturing exports would not be large. The geographic proximity of Turkey to the EU markets is likely to provide some cost advantage by lowering freight costs, but such an advantage can be overcome by large volumes of shipments from coun-tries that are not so close to the EU markets. So, proximity alone is not likely to be sufficient to give Turkey a significant edge in competition against EA exporters. In the long run, the country will have to take steps to maintain and enhance its competitive advantage in key export industries, particularly in highly price competitive world markets.
Appendix A
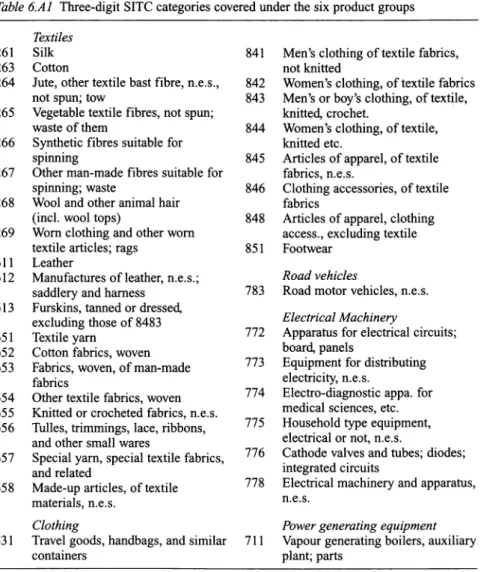
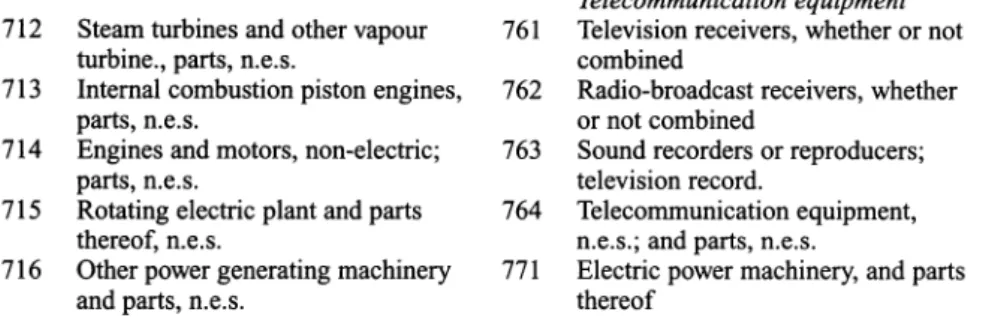
Table 6.Al Three-digit SITC categories covered under the six product groups
Textiles
261 Silk 841 Men's clothing of textile fabrics,
263 Cotton not knitted
264 Jute, other textile bast fibre, n.e.s., 842 Women's clothing, of textile fabrics not spun; tow 843 Men's or boy's clothing, of textile, 265 Vegetable textile fibres, not spun; knitted, crochet.
waste of them 844 Women's clothing, of textile, 266 Synthetic fibres suitable for knitted etc.
spinning 845 Articles of apparel, of textile 267 Other man-made fibres suitable for fabrics, n.e.s.
spinning; waste 846 Clothing accessories, of textile 268 Wool and other animal hair fabrics
(incl. wool tops) 848 Articles of apparel, clothing 269 Worn clothing and other worn access., excluding textile
textile articles; rags 851 Footwear 611 Leather
612 Manufactures of leather, n.e.s.; Road vehicles
saddlery and harness 783 Road motor vehicles, n.e.s. 613 Furskins, tanned or dressed,
excluding those of 8483 Electrical Machinery
651 Textile yarn 772 Apparatus for electrical circuits; 652 Cotton fabrics, woven board, panels
653 Fabrics, woven, of man-made 773 Equipment for distributing
fabrics electricity, n.e.s.
654 Other textile fabrics, woven 774 Electro-diagnostic appa. for 655 Knitted or crocheted fabrics, n.e.s. medical sciences, etc. 656 Tulles, trimmings, lace, ribbons, 775 Household type equipment,
and other small wares electrical or not, n.e.s.
657 Special yarn, special textile fabrics, 776 Cathode valves and tubes; diodes;
and related integrated circuits
658 Made-up articles, of textile 778 Electrical machinery and apparatus,
materials, n.e.s. n.e.s.
Clothing Power generating equipment
831 Travel goods, handbags, and similar 711 Vapour generating boilers, auxiliary
Competition between Turkish and East Asian exports 133
712 Steam turbines and other vapour
turbine., parts, n.e.s.
713 Internal combustion piston engines,
parts, n.e.s.
714 Engines and motors, non-electric;
parts, n.e.s.
715 Rotating electric plant and parts
thereof, n.e.s.
716 Other power generating machinery
and parts, n.e.s.
Appendix B: export similarities
Export similarity index is defined as:
Telecommunication equipment
761 Television receivers, whether or not
combined
762 Radio-broadcast receivers, whether
or not combined
763 Sound recorders or reproducers;
television record.
764 Telecommunication equipment,
n.e.s.; and parts, n.e.s.
771 Electric power machinery, and parts
thereof
S(n,m) ={~Minimum[Xt(lm),Xt(2m)]} *100
k
where Xt(nm) is the share of commodity kin country n's exports to country m for
n = I, 2 (Finger and Krenin 1979). This index determines the proportion of the
commodity basket of one exporter that is perfectly matched by that of the other exporter by removing the effects of the relative scale of total exports.
Table 6.Bl Export similarity indices in the EU market: Turkey versus EA countries, 1990--9
Textiles Clothing Road vehicles Electrical machinery
Turkey versus China
1990--9 50.40 31.76 3.15 1.78 1990--4 49.94 31.31 2.09 1.44 1995-9 50.85 32.21 4.21 2.12
Turkey versus Hong Kong
1990--9 48.71 31.92 2.72 0.84 1990--4 48.11 31.25 1.45 0.63 1995-9 49.31 32.59 3.98 1.04
Turkey versus South Korea
1990--9 34.18 26.90 13.28 0.70 1990--4 36.36 26.61 6.87 0.54 1995-9 32.00 27.18 19.70 0.86
Turkey versus Taiwan
1990--9 28.68 21.43 7.95 2.08 1990--4 28.65 21.09 6.81 2.02 1995-9 28.72 21.78 9.10 2.15
Source: Authors' calculations based on OECD data, period averages.
Power gen. Telecom. machinery equipment 27.85 19.26 31.18 20.97 24.52 17.54 39.04 14.58 41.79 15.18 36.28 13.98 13.69 18.17 21.50 18.33 5.88 18.02 6.57 16.67 8.55 16.81 4.58 16.53
i31lkent
LJJ11verstty
Library
Appendix C
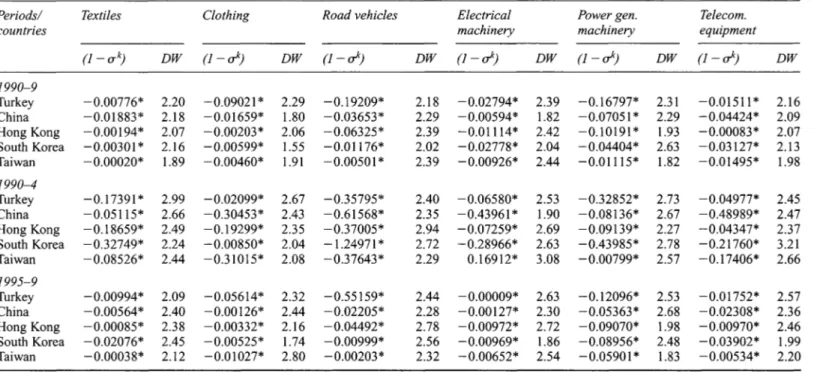
Table 6.Cl Statistical properties of the estimated results
Periods/ Textiles Clothing Road vehicles Electrical Power gen. Telecom.
countries machinery machinery equipment
-(1-ak) DW (1-uk) DW (1-uk) DW (1-uk) DW (1-uk) DW (1-uk) DW
1990-9 Turkey -0.00776* 2.20 -0.09021 * 2.29 -0.19209* 2.18 -0.02794* 2.39 -0.16797* 2.31 -0.01511* 2.16 China -0.01883* 2.18 -0.01659* 1.80 -0.03653* 2.29 -0.00594* 1.82 -0.07051 * 2.29 -0.04424* 2.09 Hong Kong -0.00194* 2.07 -0.00203* 2.06 -0.06325* 2.39 -0.Ql 114* 2.42 -0.10191 * 1.93 -0.00083* 2.07 South Korea -0.00301* 2.16 -0.00599* 1.55 -0.Ql 176* 2.02 -0.02778* 2.04 -0.04404* 2.63 -0,03127* 2.13 Taiwan -0.00020* 1.89 -0.00460* 1.91 -0.00501* 2.39 -0.00926* 2.44 -0.01115* 1.82 -0.01495* 1.98 1990-4 Turkey -0.17391* 2.99 -0.02099* 2.67 -0.35795* 2.40 -0.06580* 2.53 -0.32852* 2.73 -0.04977* 2.45 China -0.05115* 2.66 -0.30453* 2.43 -0.61568* 2.35 -0.43961 * 1.90 -0.08136* 2.67 -0.48989* 2.47 Hong Kong -0.18659* 2.49 -0.19299* 2.35 -0.37005* 2.94 -0.07259* 2.69 -0.09139* 2.27 -0.04347* 2.37 South Korea -0.32749* 2.24 -0.00850* 2.04 -1.24971* 2.72 -0.28966* 2.63 -0.43985* 2.78 -0.21760* 3.21 Taiwan -0.08526* 2.44 -0.31015* 2.08 -0.37643* 2.29 0.16912* 3.08 -0.00799* 2.57 -0.17406* 2.66 1995-9 Turkey -0.00994* 2.09 -0.05614* 2.32 -0.55159* 2.44 -0.00009* 2.63 -0.12096* 2.53 -O.oI752* 2.57 China -0.00564* 2.40 -0.00126* 2.44 -0.02205* 2.28 -0.00127* 2.30 -0.05363* 2.68 -0.02308* 2.36 Hong Kong -0.00085* 2.38 -0.00332* 2.16 -0.04492* 2.78 -0.00972* 2.72 -0.09070* 1.98 -0.00970* 2.46 South Korea -0.02076* 2.45 -0.00525* 1.74 -0.00999* 2.56 -0.00969* 1.86 -0.08956* 2.48 -0.03902* 1.99 Taiwan -0.00038* 2.12 -0.01027* 2.80 -0.00203* 2.32 -0.00652* 2.54 -0.05901 * 1.83 -0.00534* 2.20 Notes
* denotes significance at the one per cent level.
The negative sign in the first column for each product group shows that the effect is in the expected direction for all cases. Relative prices have a statistically significant effect on the relative shares in the EU market for the exporting countries.
Competition between Turkish and East Asian exports l 35
Notes
*
This chapter is an extended and modified version of Kotan and Sayan (200 I). In recent decades, EU's share in Turkey's exports has been around 50 per cent, with Germany alone accounting for an average share of 20 per cent (Sayan 2000); see Erlat and Akyuz (2001) for a detailed analysis of the concentration of Turkey's foreign trade with respect to her partner countries.2 In light of the discussion by Erlat and Sahin ( 1998) concerning a stricter use of the ter-minology of 'traditional' and 'non-traditional' exports in the literature, we deliberately avoid calling Textiles and Clothing 'traditional' exports here. We adopt instead the convention in Sayan and Demir (2003) designating Textiles and Clothing 'agro-based' sectors because of their strong backward linkages with the agricultural sector. For the sake of symmetry and convenience, we will call the other sectors under consideration here 'non-agro-based' sectors.
3 Road vehicles in particular have become one of the largest sources of exports revenue since the mid-1990s.
4 Turkey also managed to increase her share in world markets for these product categories during the 1990s (Lohrmann 2000).
5 In the period 1990--9, two firms producing passenger cars mainly for the domestic mar-ket under licences with Fiat and Renault began to look abroad for export marmar-kets (par-ticularly to the EU and the Middle Eastern markets). The period also witnessed an inflow of automotive manufacturers from the United States (such as GM and Ford), Japan (Toyota and Honda), and Korea (Hyundai), who formed joint ventures with domestic firms to increase their exports to the EU by taking advantage of Turkey's CU agreement with the latter. This led to a significant increase in exports of passenger cars, as well as commercial vehicles, including makes that are designed and produced domestically. 6 The real value of the Turkish Lira (TL) was calculated against a currency basket
con-sisting of l US dollar and 1.5 German marks. Turkish private manufacturing price indices were used to measure the domestic inflation rate, whereas foreign inflation rate was calculated using a weighted average of US and German producer price indices (with the weights of0.544 and 0.456, respectively). A fall (rise) in the index shows real depreciation (appreciation) of the TL against the currency basket.
7 A hike in the price of an imported commodity will encourage demand substitution, aided by such advantages as lower transportation and/or insurance costs, lower tariffs, etc. In such instances, changes in relative prices of different exporters of the same com-modity (or close substitutes) trigger a demand reaction.
8 See Kotan (2000) for detailed derivations of Equations (6.1) and (6.2).
9 Although there is no consensus on the choice of indexation method, the Laspeyres method is relatively more common and is thus used here (Fagerberg and Sollie 1987, Lohrmann 2000).
l O See Appendix C for a precise description of statistical properties.
11 Using a gravity model framework and based on a sample of Turkey's non-EU trade part-ners, Sayan ( 1998) and Sayan and Zaim ( 1998) have shown that the distance from Turkey to the country of destination is a significant factor affecting Turkish exports negatively. 12 Import and export prices are defined as inclusive of CIF and FOB, respectively. The
difference between the two comes from freight and insurance charges. While freight costs are directly and positively related to the distance between exporting and import-ing countries, the distance affects insurance costs only as one of several factors that insurance companies consider in determining the level of risk premium to be charged.
References
Brada, J.C., A. M. Kutan, and S. Zhou (1997) 'The exchange rate and the balance of trade: the Turkish experience', The Journal of Development Studies, 33: 675-692.
136 Zelal Katan and Serdar Sayan
CBRT/Central Bank of the Republic of Turkey (2001) Website at http://www.tcmb.gov.tr/
Daniels, P. (1999) 'Empirical gains from technology-intensive trade: an empirical
assess-ment', Cambridge Journal of Economics, 23: 427--447.
Davidson, R. and J. G. MacKinnon (1993) Estimation and Inference in Econometrics,
New York: Oxford University Press.
DPT/State Planning Organization of Turkey (1995) Turk Ekonomisi'nin Rekabet
Gucundeki Gelismeler, Ankara: DPT.
Erlat, G. (1993) 'Is there a meaningful relationship between exports and industrial
concentration? Case studies from the Turkish manufacturing industry', METU Studies
in Development, 20: 43-61.
Erlat, G. and 0. Akyuz (2001) 'Country concentration ofTurkey's exports and imports over
time', Paper presented at the 26th Annual Meeting of the Middle East Economic
Association (held in conjunction with the Allied Social Science Associations), New
Orleans, January 5-7.
Erlat, G. and B. Sahin (1998) 'Export diversification ofTurkey over time', METU Studies
in Development, 25: 47-60.
Fagerberg, J. and G. Sollie (1987) 'The method of constant market shares analysis
recon-sidered', Applied Economics, 19: 1571-1583.
Finger, J. M. and M. E. Kreinin ( I 979) 'A measure of "export similarity" and its possible
uses', The Economic Journal, 89: 905-912.
Guerrieri, P. and C. Milana (1995) 'Technology and trade competition in high-tech
products', Cambridge Journal of Economics, 19: 225-242.
IMF, International Financial Statistics, CD-ROM, Washington, DC: International
Monetary Fund.
Kotan, Z. (2000) 'Export performance of Turkey in the European Union market in
comparison to South East Asian countries: 1990-1997', Unpublished MA thesis,
Department of Economics, Bilkent University, Ankara.
Kotan, Z. and S. Sayan (2001) 'A comparative investigation of the price competitiveness of Turkish and South East Asian exports in the European Union market: 1990-I 997,
Emerging Markets Finance and Trade, 38(4): 59-85.
Lloyd, P. J. ( 1994) 'Intraregional trade in the Asian and Pacific region', Asian Development
Review, 12: 113-143.
Lohrmann, A. M. (2000) 'On Turkey's export performance: a decomposed constant market
share analysis', Russian and East European Finance and Trade, 36(4): 80-90.
Matyas, L. (1995) The Econometrics of Panel Data: Handbook of the Theory with
Applications, Boston, MA: Kluwer.
Merkies, A.H. Q. M. and T. Van Der Meer (1988) 'A theoretical foundation for constant
market share analysis', Empirical Economics, 13: 65-80.
Noland, M. (1997) 'Has Asian export performance been unique?' Journal of International
Economics, 43: 79-101.
OECD, Annual International Trade Statistics, CD-ROM, Paris: Organization of Economic
Cooperation and Development.
Sayan, S. (I 998) 'The Black Sea Economic Cooperation Project: a substitute for or a complement to globalization efforts in the Middle East and the Balkans?, Working Paper No. 9806, Cairo: Economic Research Forum.
Sayan, S. (2000) 'Recent developments in Turkish foreign trade', paper presented at the
Conference on the Economy of Turkey, Tel Aviv University, Tel Aviv, June 15.
Sayan, S. and N. Demir (2003) 'Structural change in agriculture and water requirements in
Competition between Turkish and East Asian exports 13 7
Middle East and North Africa, vol. 5 of The Research in Middle East Economics,
Amsterdam: JAi Press, pp. 289-315.
Sayan, S. and 0. Zaim (1998) 'The Black Sea Economic Cooperation Project', in Rittenberg, L. (ed.), The Political Economy a/Turkey in the Post-Soviet Era, Westport,
CT: Praeger/Greenwood Publishing Group, Inc., pp. 115-136.
SIS/State Institute of Statistics (2001) State Institute of Statistics Website at http://www.die.gov.tr/
Uygur, E. (1997) 'Export policies and export performance: the case of Turkey', Working Paper No. 9707, Cairo: Economic Research Forum.