CHISIO: A VISUAL FRAMEWORK FOR
COMPOUND GRAPH EDITING AND
LAYOUT
a thesis
submitted to the department of computer engineering
and the institute of engineering and science
of bilkent university
in partial fulfillment of the requirements
for the degree of
master of science
By
Cihan K¨
u¸c¨
ukke¸ceci
June, 2007
Assoc. Prof. Dr. U˘gur Do˘grus¨oz(Advisor)
I certify that I have read this thesis and that in my opinion it is fully adequate, in scope and in quality, as a thesis for the degree of Master of Science.
Dr. Kıvan¸c Din¸cer
I certify that I have read this thesis and that in my opinion it is fully adequate, in scope and in quality, as a thesis for the degree of Master of Science.
Dr. Markus Schaal
Approved for the Institute of Engineering and Science:
Prof. Dr. Mehmet B. Baray Director of the Institute
ABSTRACT
CHISIO: A VISUAL FRAMEWORK FOR
COMPOUND GRAPH EDITING AND LAYOUT
Cihan K¨u¸c¨ukke¸ceci M.S. in Computer Engineering
Supervisor: Assoc. Prof. Dr. U˘gur Do˘grus¨oz June, 2007
Graphs are data models, widely used in many areas from networking to biology to computer science. Visualization, interactive editing ability and layout of graphs are critical issues when analyzing the underlying relational information.
There are many commercial and non-commercial graph visualization tools. However, overall support for compound or hierarchically organized graph repre-sentations is very limited.
We introduce a new open-source editing and layout framework named Chisio for compound graphs. Chisio is developed as a free, easy-to-use and powerful aca-demic graph visualization tool, supporting various automatic layout algorithms. It is written in Java and based on Eclipse’s Graphical Editing Framework (GEF).
Chisio can be used as a finished generic compound graph editor with standard graph editing facilities such as zoom, scroll, add or remove graph objects, move, and resize. Object property and layout options dialogs are provided to modify existing graph object properties and layout options, respectively. In addition, printing or saving the current drawing as a static image and persistent storage facilities are supported. Saved graphs or GraphML formatted files created by other tools can be loaded into Chisio. Furthermore, a highlight mechanism is provided to emphasize subgraphs of users interest.
The framework has an architecture suitable for easy customization of the tool for end-users’ specific needs as well. Also Chisio offers several layout styles from the basic spring embedder to hierarchical layout to compound spring embedder to circular layout. Furthermore, new algorithms are straightforward to add, making Chisio an ideal test environment for layout algorithm developers.
Keywords: information visualization, graph layout, graph editing, software sys-tem, graph editor, compound graphs.
¨
OZET
CHISIO: B˙ILES
¸ ˙IK C
¸ ˙IZGE D ¨
UZENLEMES˙I VE
YERLES
¸T˙IRMES˙I ˙IC
¸ ˙IN G ¨
ORSEL B˙IR C
¸ ERC
¸ EVE
Cihan K¨u¸c¨ukke¸ceci
Bilgisayar M¨uhendisli˘gi, Y¨uksek Lisans Tez Y¨oneticisi: Do¸cent Dr. U˘gur Do˘grus¨oz
Haziran, 2007
C¸ izgeler, a˘g olu¸sturmaktan, biyolojiye, bilgisayar bilimlerine, bir¸cok alanda sık¸ca kullanılan veri modelleridir. G¨orselle¸stirme, etkile¸simli d¨uzenleme kabiliyeti ve ¸cizgelerin yerle¸stirilmesi, temeldeki ili¸skisel bilgilerin ¸c¨oz¨umlenmesinde kritik konulardır.
Bir¸cok ticari ve ticari olmayan ¸cizge g¨orselle¸stirme ara¸cları mevcuttur. Ancak bile¸sik veya sırad¨uzensel olarak d¨uzenlenmi¸s ¸cizge g¨osterimini sa˘glayan ara¸c sayısı ¸cok sınırlı sayıdadır.
Biz adı Chisio olan yeni bir a¸cık-kaynak d¨uzenleme ve yerle¸stirme ya-pan ¸cer¸ceve tanıtıyoruz. Chisio bedava, kullanımı kolay ve etkili, otomatik yerle¸sim algoritmalarını destekleyen bir akademik ¸cizge g¨orselle¸stirme aracı olarak geli¸stirildi. Java’da yazıldı ve Eclipse’in Grafiksel D¨uzenleme C¸ er¸cevesi’ni (GEF) temel olarak aldı.
Chisio yakınla¸stırma, kaydırma, ¸cizge nesneleri ekleme ya da ¸cıkarma, hareket ettirme, boyutunu de˘gi¸stirme gibi standart ¸cizge d¨uzenleyici ¨ozellikleri ile tamam-lanmı¸s ¨ozelle¸smemi¸s bile¸sik ¸cizge d¨uzenleyicisi olarak kullanılabilir. Var olan ¸cizge nesnelerinin ¨ozelliklerini ve yerle¸sim se¸ceneklerini de˘gi¸stirmek i¸cin nesne ¨ozellikleri ve yerle¸sim se¸cenekleri pencereleri sunulmaktadır. Ayrıca, kullanılmakta olan ¸cizgeyi yazdırma ya da resim olarak ve kalıcı bellekte saklamak da m¨umk¨und¨ur. Saklanan ¸cizgeler ya da di˘ger ara¸clar tarafından yaratılmı¸s GraphML bi¸cimindeki dosyalar Chisio’ya y¨uklenebilir. Bunlardan ba¸ska, vurgulama mekanizması ile kullanıcıların ilgilendi˘gi alt¸cizgelerin vurgulanması da m¨umk¨und¨ur.
C¸ er¸ceve, son kullanıcıların ¨ozel ihtiya¸cları i¸cin kolayca ¨ozelle¸stirilebilmeye olanak sa˘glayacak bir mimariye de sahiptir. Ayrıca Chisio yay g¨ommeli’den sırad¨uzensel yerle¸sime, bile¸sik yay g¨ommeliye, dairesel yerle¸sime ¸ce¸sitli yerle¸sim
stilleri sunmaktadır. Bundan ba¸ska, yerle¸sim algoritması geli¸stirenler i¸cin Chi-sio’yu ideal bir sınama ortamı yapacak ¸sekilde yeni algoritmalar do˘gruca ek-lenebilir.
Anahtar s¨ozc¨ukler : bilgi g¨orselle¸stirme, ¸cizge yerle¸simi, ¸cizge d¨uzenleme, yazılım sistemi, ¸cizge d¨uzenleyici, bile¸sik ¸cizgeler.
Acknowledgement
I would like to express my deepest gratitudes to my supervisor Assoc. Prof. U˘gur Do˘grus¨oz, for his guidance and feedbacks during the preparation of this thesis. It has been a great experience and privilege for me to work with him and get benefit from his valuable mentorship.
I also would like to thank Dr. Kıvan¸c Din¸cer and Dr. Markus Schaal for reviewing the manuscript of this thesis and spending their valuable time.
Above all, I am very grateful for the endless love and support of my parents G¨ul¸sen and Muhsin K¨u¸c¨ukke¸ceci, and my dearest brother, Onur and sister, Deniz. I feel stronger and happier with their love.
1 Introduction 1
1.1 Motivation . . . 5
1.2 Background Information . . . 5
1.2.1 Graphs . . . 5
1.2.2 Graph Drawing . . . 6
1.2.3 Graph Editing Framework (GEF) . . . 8
2 Related Work 10 2.1 Commercial Tools . . . 10
2.2 Non-Commercial Tools . . . 13
3 Chisio Architecture 16 3.1 The Model-View-Controller (MVC) Architecture . . . 18
3.2 Chisio Models . . . 19
3.3 Chisio Figures . . . 20
3.4 Chisio Editparts . . . 22
CONTENTS ix
3.5 Chisio Actions and Commands . . . 24
3.6 Inspector Windows . . . 24 3.7 Highlight Mechanism . . . 26 3.8 Animation in Layout . . . 27 3.9 Use Cases . . . 28 4 Chisio as an Editor 30 4.1 Drawings . . . 30 4.1.1 Nodes . . . 31 4.1.2 Compound Nodes . . . 32 4.1.3 Edges . . . 32 4.2 Chisio Tools . . . 34 4.2.1 Select Tools . . . 34 4.2.2 Zoom Tools . . . 35 4.3 Changing Topology . . . 35
4.3.1 Creating Graph Objects . . . 37
4.3.2 Deleting Graph Objects . . . 38
4.3.3 Transferring Graph Objects . . . 39
4.3.4 Reconnecting an Edge . . . 40
4.4 Changing Geometry . . . 41
4.6 Cluster IDs . . . 44
4.7 Persistent Storage . . . 45
4.8 Static Images and Printing . . . 47
5 Chisio Customization 48 5.1 Customize Editor . . . 48
5.1.1 Customizing User Interface . . . 48
5.1.2 File Operations . . . 60
5.1.3 Menu Operations . . . 65
5.2 Extendible Layout Architecture . . . 69
5.2.1 Chisio Layout Architecture . . . 69
5.2.2 Adding New Layout Algorithms . . . 69
5.2.3 New Layout Options . . . 72
5.2.4 Changing Defaults For Layouts . . . 75
6 Layout in Chisio 77 6.1 CoSE Layout . . . 77
6.1.1 CoSE Layout Steps . . . 78
6.1.2 Layout Options . . . 78
6.1.3 CoSE Layout Improvements . . . 79
6.2 Cluster Layout . . . 81
CONTENTS xi
6.2.2 Layout Options . . . 81
6.2.3 Cluster Layout Details . . . 82
6.3 CiSE Layout . . . 83
6.3.1 CiSE Layout Steps . . . 83
6.3.2 Layout Options . . . 84
6.4 Circular Layout . . . 84
6.4.1 Circle Layout Steps . . . 85
6.4.2 Layout Options . . . 85
6.5 Spring Layout . . . 86
6.5.1 Understanding the Spring Layout Algorithm . . . 86
6.5.2 Layout Options . . . 87
6.6 Hierarchical Layout . . . 88
6.6.1 Hierarchical Layout Steps . . . 88
6.6.2 Layout Options . . . 89
6.6.3 Hierarchical Layout Improvements . . . 90
7 Conclusion 94 7.1 Contribution . . . 94
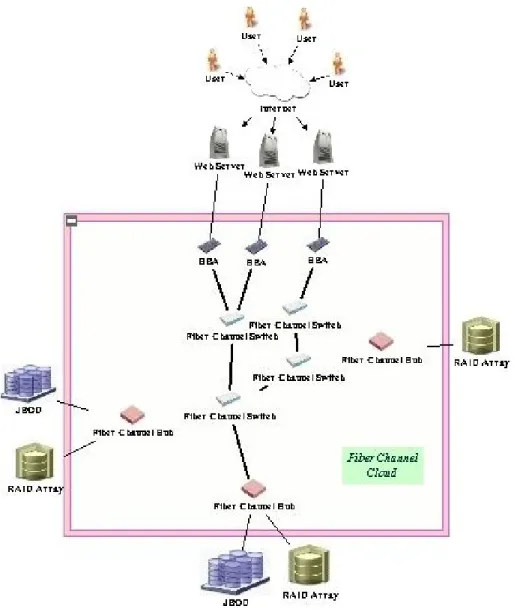
1.1 A computer network drawn using a compound graph (courtesy of
Tom Sawyer Software) . . . 2
1.2 A financial chart (courtesy of Tom Sawyer Software) . . . 3
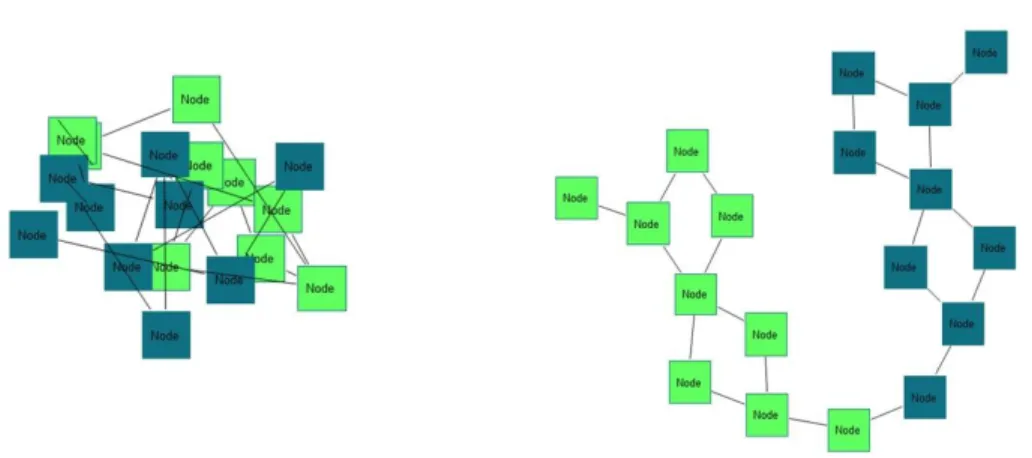
1.3 Same graph before (left) and after (right) layout . . . 3
1.4 Different layouts for the same graph . . . 4
1.5 Compound graph with inter-graph and intra-graph edges . . . 6
1.6 Same graph with different drawings . . . 7
1.7 GEF MVC Architecture . . . 8
1.8 GEF is on top of Draw2d and SWT . . . 9
3.1 A UML Class Diagram illustrating the compound graph model used in Chisio . . . 19
3.2 A UML Class Diagram illustrating the figure relations in Chisio . 21 3.3 Chisio system architecture . . . 22
3.4 A UML Sequence Diagram illustrating creation of a node with rectangle shape in Chisio . . . 23
LIST OF FIGURES xiii
3.5 A UML Sequence Diagram for running CoSE layout in Chisio . . 24
3.6 A UML Class Diagram illustrating the inspector dialogs in Chisio 25 3.7 Layers in GEF . . . 26
3.8 A UML Sequence Diagram for highlighting a node in Chisio . . . 27
3.9 A UML Use Case Diagram for Chisio as an editor . . . . 28
3.10 A UML Use Case Diagram for inspector dialogs in Chisio . . . . 29
4.1 Basics of drawing in Chisio . . . . 31
4.2 A node and its properties window or inspector . . . 31
4.3 A compound node (right) and its properties window . . . 32
4.4 Examples of edges with different styles (left) and available edge types (right) . . . 33
4.5 Edge properties window or edge inspector . . . 33
4.6 Graph properties window . . . 33
4.7 Example selection handles for all types of graph objects . . . 34
4.8 Example use of the Marquee Selection Tool . . . 35
4.9 Before marquee zoom to the area specified by the red rectangle . . 36
4.10 After marquee zooming into the area as described by Figure 4.9 . 36 4.11 Graph pop-up menu includes zoom-in and zoom-out operations . 37 4.12 Create a node by simply clicking on the drawing canvas, where you would like your new node to be placed; before the creation (left) and after the creation (right) . . . 37
4.13 Create an edge by first clicking on the source node and then on
the target node . . . 38
4.14 Remove compound; before and after . . . 38
4.15 Move/Transfer Mode combo . . . 39
4.16 When transferring a node into a compound node, the compound node’s background color changes to indicate the transfer; initially (left), when the transfer of the selected node is about to be performed 39 4.17 Clone operation; drag selected nodes pressing the CTRL key in the transfer mode and click to clone . . . 40
4.18 Create compound (right) from selected nodes (left) . . . 40
4.19 Edge reconnection; after selection of the edge (left), during drag-ging (middle) and after reconnection (right) . . . 41
4.20 Move a node by selecting and dragging it . . . 41
4.21 Resize a node; before (left) and after (right) . . . 42
4.22 Compound nodes are automatically resized . . . 42
4.23 Bendpoint creation; after selection (left), during drag of the small handle (middle), and upon completion with the release of the mouse (right) . . . 42
4.24 Bendpoint deletion; initially the edge has two bends (left); upon drag and release of the left bend, it is deleted to leave the edge with only one bend (right) . . . 43
4.25 Highlighting objects . . . 43
LIST OF FIGURES xv
4.27 New cluster ID of the node as confirmed by the node properties
window . . . 44
4.28 Coloring with cluster IDs results in three clusters, each with a unique color . . . 45
4.29 A Highlighted node for example GraphML format . . . 46
4.30 An edge for example GraphML format . . . 47
4.31 Save as image menu item . . . 47
5.1 Sample UIs for two diamond shaped nodes . . . 51
5.2 Sample screenshot of the Edge Inspector after addition of the new attribute “Arrow Size” . . . 58
5.3 Chisio Layout Architecture . . . 70
6.1 Sample CoSE layout produced by Chisio . . . . 78
6.2 CoSE layout options . . . 79
6.3 Create bendpoints as needed checkbox . . . 80
6.4 Bendpoints are automatically created for loop edges and multi edges 80 6.5 Sample Cluster layout produced by Chisio, where nodes are color-coded by their clusters . . . 81
6.6 Cluster layout options . . . 82
6.7 Sample CiSE layout produced by Chisio, where nodes are color-coded by their clusters . . . 83
6.8 CiSE layout options . . . 84
6.10 Circular layout options . . . 86
6.11 Sample Spring layout produced by Chisio . . . 87
6.12 Spring layout options . . . 87
6.13 Sample Hierarchical layout produced by Chisio . . . 88
6.14 Hierarchical layout options . . . 89
6.15 Hierarchical layout with compound support . . . 91
6.16 Same graph without (top) and with (bottom) improvement in Hi-erarchical layout by pushing up nodes . . . 92
6.17 Non-uniform node size support in Hierarchical layout . . . 92
6.18 Same graph without (left) and with (right) bendpoints in Hierar-chical layout . . . 93
List of Tables
2.1 Chisio compared to popular commercial tools . . . 11
2.2 Chisio layout compared to popular commercial tools’ layout . . . 12
2.3 Chisio compared to popular non-commercial tools . . . 14
2.4 Chisio layout compared to popular commercial tools’ layout . . . 15
Introduction
Graphs are simply a set of objects (nodes) and a set of relations (edges that connect nodes to each other) among them. By using this simple but powerful data structure many real world problems, from network to communication to data flow charts, can be modeled.
Compound graphs are graphs with nested child graphs inside. These graphs have compound nodes which have inner nodes and edges in its child graph (Fig-ure 1.1 and 1.2). Multiple nesting can be implemented by adding a compound node into another compound node and so on.
Graph visualization is a research area for drawing graphs according to their topological information [15]. These drawings must be understandable for easy interpretation and analysis. At this point, geometrical information of the graph objects comes into prominence. Location of the nodes, style of the edges change the clarity of the drawing. So, nodes must be moved or resized by user interaction or automatically. This process is known as graph layout. By using automatic graph layouts, highly complicated graphs can be visualized in an understandable fashion in a few seconds (Figure 1.3).
Different applications may require different layout styles. For example, draw-ing a flow chart generally gives the best result with hierarchical layout. Because
CHAPTER 1. INTRODUCTION 2
Figure 1.1: A computer network drawn using a compound graph (courtesy of Tom Sawyer Software)
Figure 1.2: A financial chart (courtesy of Tom Sawyer Software)
CHAPTER 1. INTRODUCTION 4
the relational information can be understood easily by using the level information that hierarchical layout reveals.
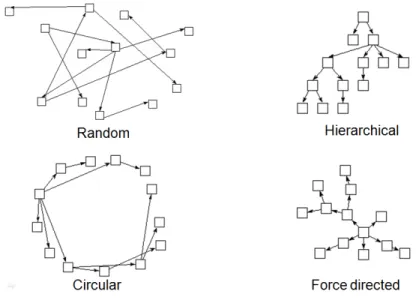
Hence for every particular graph application, we need specialized graph lay-out algorithms which consider the structural information and semantics of the graphs. This seems that we need a high number of algorithms in a generic graph layout tool. But there are several layout algorithms which are powerful enough to give best drawings in a wide range of applications. These are Radial, Circular, Hierarchical and Spring Embedder. Every one of them gives different results for the same graph (Figure 1.4).
Figure 1.4: Different layouts for the same graph
Graph visualization tools are developed to display and manipulate graphs. Some of them only support display while others also support editing. Layout support is another crucial capability for these tools.
Compound support is another aspect for graph visualization tools. Manag-ing compound graphs for both editManag-ing and layout operations is a main design constraint which must be considered from the beginning.
1.1
Motivation
Over the years, an abundant number of such tools have been made available for consumption both commercially and academically [6]. However, only a few, if any, non-commercial systems seem to address compound structures of graphs both in regards to editing and layout capabilities. Chisio should fill an important gap in this field.
Another motivation is creating an abstract layout mechanism making the development of new layout algorithms possible. For instance, with the help of step by step animation ability, layout phases can be tracked easily.
1.2
Background Information
1.2.1
Graphs
A graph G = (V, E), is a set of nodes (V ), and edges (E). An edge (u, v) ∈ E connects the nodes, u ∈ V and v ∈ V , where u is the source and v is the target.
If source and target nodes are the same for an edge (u, v), then this edge is called a loop edge. If there are several edges between u and v, then these edges are called multi-edges.
Incoming edges for a node is the list of edges that this node is the target node for. Outgoing edges for a node is the list of edges that this node is the source node for. Thus, an edge (u, v) is in the outgoing edge list of node u and in the incoming edge list of node v.
If a graph is a directed graph, edges are directional, from source node to target node. Every edge is in either incoming edges or outgoing edges for its source and target nodes.
CHAPTER 1. INTRODUCTION 6
graph can be represented by a directed graph if every undirected edge (u, v) is represented by two directed edges (u, v) and (v, u). Generally, graphs are assumed to be undirected unless otherwise specified.
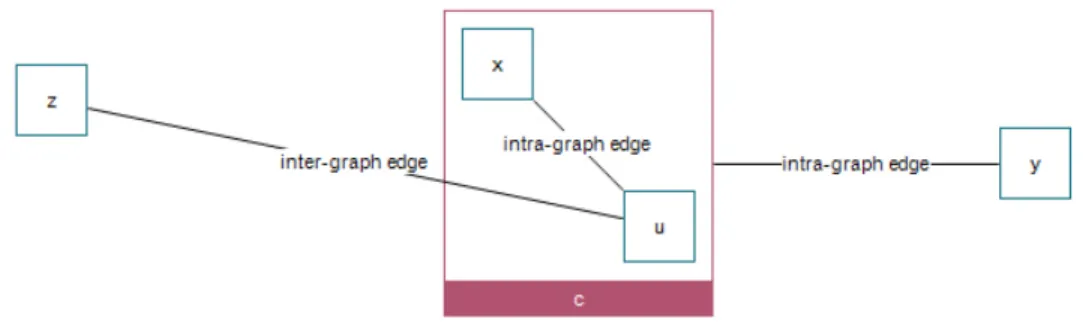
For compound graphs, a node can have a child graph in it called a compound node. There is a parent-child relationship between inner nodes of this compound node and itself. Let G1 = (V1, E1) and G2 = (V2, E2). If there is a compound
node c ∈ V1 and the child graph in it is G2, an inner node u ∈ V2 is the child
node of c and c is the parent node of u (Figure 1.5).
If an edge’s source and target nodes belong to the same graph, then this edge is an intra-graph edge. Otherwise, this edge is called an inter-graph edge (Figure 1.5).
Figure 1.5: Compound graph with inter-graph and intra-graph edges
1.2.2
Graph Drawing
A graph G = (V, E) has a topological information. Location, size and view of nodes cannot be extracted from this information. Drawing tools assign views for nodes and edges, add them geometrical information, make the graph more understandable by drawing it as a picture.
Simply put, graph drawing is a transformation from topological information to geometrical information. Graph G = (V, E) is mapped to 2D or 3D objects. It is obvious that, a graph can have different drawings (Figure 1.6).
Figure 1.6: Same graph with different drawings
as a straight line, orthogonal polygonal path or arbitrary curve, etc. There can be label, color or extra view properties for the objects according to drawing.
If there is no edge crossings on the drawing then it is called planar drawing. If a graph can be drawn like planar drawing, then graph is a planar graph.
Planarity is one of the important issues for readability of the graphs. The lesser edge crossings, the more graph is readable. Because tracking of the edges is easier when there are not any edge crossings.
Minimization of the drawing area is another parameter for readability. When drawing area is maximized, graph must be zoomed out to be viewed completely. This will decrease the recognition of nodes, and also understandability.
Total edge length is important, too. It is hard to track long edges in a drawing.
Symmetry also increases the understandability of the drawings of some graphs. Sometimes, symmetry can be preferred instead of edge crossing minimization (Figure 1.6).
Generally these kinds of aesthetics are naturally associated with optimization problems, which are computationally hard. Testing planarity takes linear time while testing upward planarity is NP-hard. Minimizing crossings is an NP-hard problem, too. Minimizing bends in planar orthogonal drawing is NP-hard in gen-eral while it is polynomial time for a fixed embedding. Thus many approximation strategies and heuristics have been devised [5].
Above parameters and other aesthetic parameters increase the readability of the drawings. To maintain these constraints, nodes and edges must be located
CHAPTER 1. INTRODUCTION 8
carefully. That brings us to layout of the graphs and automatic layout algorithms are developed to maintain these parameters.
There are many kinds of graph applications to solve different real world prob-lems. Best drawing for each one can change according to semantics and structural information of the graphs. For this purpose, many automatic layout algorithms like Radial, Hierarchical and Force-directed have been devised. These algorithms run with a best performance for a wide range of applications. In many cases, users may interact with the graphs to improve the drawings manually after run-ning automatic layouts.
1.2.3
Graph Editing Framework (GEF)
Chisio was built on top of the Eclipse Graph Editing Framework (GEF) [9]. There is a model to store necessary information, a view to visualize that model and a controller to bridge model and figure. This architecture is called MVC (Model-View-Controller). When MVC is mapped to GEF, controllers are edit-parts, views are figures and models are models, as well (Figure 1.7).
Figure 1.7: GEF MVC Architecture
The Model stores the data which is edited or viewed by the user. Because of the MVC architecture, model does not know either figure or editpart. Just a listener tracks the changes on the model and propagates them to editpart.
The View is the user interface part of the model. Each model has a view and user interacts with this view. When user changes the view, change is also transfered to the model.
The Editpart is the brain of the system. It connects the model and view and they do not know each other.
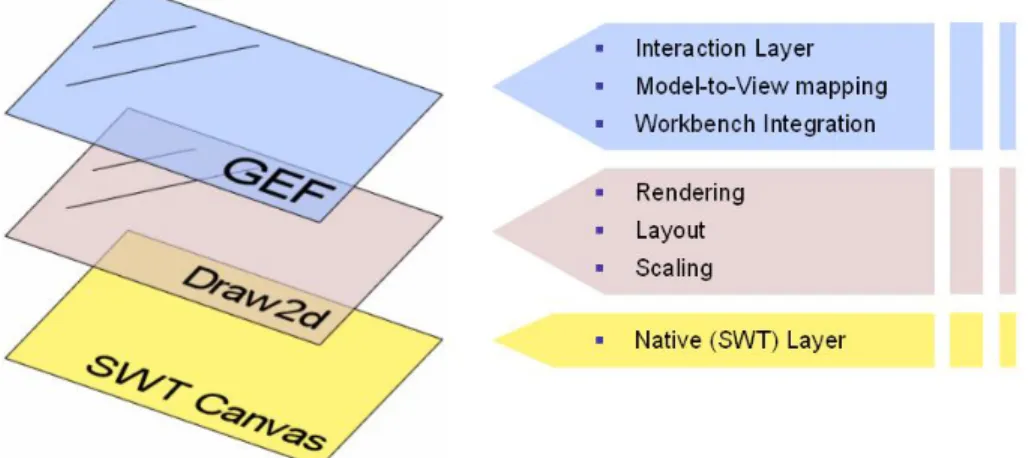
GEF is developed over Draw2d and SWT layer’s of Eclipse. SWT is the base canvas, that objects can be drawn. Draw2d draws the objects on SWT, rendering and other graphic operations are done by this layer. And GEF is at top of both to give the interaction ability with drawn figures (Figure 1.8).
Chapter 2
Related Work
There exist many commercial and non-commercial graph visualization tools. Tom Sawyer’s TSV [17], yWorks’ yFiles [20] and ILOG’s JViews Diagrammer [13] are well-known commercial tools. Their capabilities and user interfaces are generally much better than non-commercial ones like uDraw [18], Graphviz [11], VGJ [19] and Graphlet [10]. Even though Chisio is a new academic tool, its features and capabilities are comparable to most non-commercial and some commercial tools.
2.1
Commercial Tools
Compound graph support, improved visualization facilities and several layout styles make Chisio a distinguished visualization tool. Here is a comparison of Chisio with some popular commercial tools (Table 2.1). It is certain that, capabilities of Chisio are comparable to these commercial tools.
Table 2.1 shows that most of commercial tools support zooming, scaling, basic editing, save/load operations and layout. Some of them have clustering facility and highlight support, too.
Table 2.2 shows that most layout styles are supported by almost all commercial tools. If a tool has compound support, compound layout is supported too.
Mo v e/ Resize/ Zo om/ Comp ound Highligh ting Sa v e/ Clustering/ Ob ject Create/Delete Scale Supp ort Load Grouping Insp ector TSV + + + + + + + JViews + + + + + + + yEd + + + -+ + + aiSee + + + -+ -+ Chisio + + + + + + + T able 2.1: Chisio compared to p opular commercial to ols
CHAPTER 2. RELATED WORK 12 Radial Circular Hierarc hical Spring Em b edder Orthogonal Comp ound Cluster TSV + + + + + + + JViews + + + + + + + yEd -+ + + + + + aiSee -+ -Chisio -+ + + -+ + T able 2.2: Chisio la y ou t compared to p opu lar commercial to ols’ la y out
2.2
Non-Commercial Tools
In non-commercial arena, compound graph capability is rarely supported. Main motivation of Chisio is already this gap in this area. On the other hand, limited number of layout styles are implemented in non-commercial tools (Table 2.3). Generally, graph layout is done by using one of the well known graph layout algorithms.
Table 2.3 shows that, most of non-commercial tools do not support compound graphs, highlighting and clustering while basic operations are available.
Table 2.4 shows that, generally hierarchical layout is supported by non-commercial tools. Radial layout, spring embedded layout, orthogonal layout and circular layout are rarely supported. Compound layout and cluster layout are not addressed in the popular non-commercial tools that we compared Chisio to.
CHAPTER 2. RELATED WORK 14 Mo v e/Re siz e/ Zo om/ Comp ound Highligh ting Sa v e/ Clustering Ob ject Create/Delete Scale Supp ort Load Grouping Insp ector Graph viz + + -+ + -Prefuse + + ± -+ -Gra visto + + -+ -+ JGraphEd + + -+ -+ V GJ + + -+ + + GDT o olkit + + -+ -+ uDra w + + -+ -+ V CG -+ -+ -Chisio + + + + + + + T able 2.3: Chisio compared to p opular non-commercial to ols
Radial Circular Hierarc hical Spring Em b edder Orthogonal Comp ound Cluster Graph viz + -+ + -Prefuse + + + + -Gra visto + + + + + -JGraphEd -V GJ -+ -GDT o o lkit -+ -+ -uDra w -+ -V CG -+ -+ -Chisio -+ + + -+ + T able 2.4: Chisio la y ou t compared to p opu lar commercial to ols’ la y out
Chapter 3
Chisio Architecture
Chisio graph model is based on a simple graph definition as described in Sec-tion 3.2. It is designed neatly to make model structure understandable and cus-tomizable when necessary. One can easily extend these basic classes to create specialized node and edge types.
Figures have child-parent relation between them. This relation is specifically designed for easily customization of node UIs for various shape types. To cus-tomize a figure, just add new figures into it. Node shapes’ figures are created inside NodeFigure. For new shapes, create a new figure similar to implemented shapes’ figures and simply use it as a shape figure described in Section 5.1.1.1.
Menu items, pop-up menu items and toolbar items are all connected with an Action class. To customize the UI of Chisio, simply create new actions similar to already implemented ones and add them to top menubar, toolbar or pop-up menu as described in Section 5.1.3. Top menubar, pop-up menu and toolbar are packed into specific classes to easily understand what is going on in them.
Inspector windows for changing graph objects’ UI properties are also designed carefully and packed into a basic abstract inspector class. Node, edge, compound and graph inspectors are extended from this basic class and make possible to simply create new items and add them to table. Height of the inspector window,
size of table, location of it, locations of buttons are all calculated automatically to make customization simple. New items are added easily as described in Sec-tion 5.1.1.3.
File loading and saving operations are also redesigned for easy customiza-tion. Abstract file reader and writer classes are implemented and all operations are packed into GraphMLWriter and GraphMLReader classes which are extended from these abstract classes. For example, SaveAction just creates an instance of GraphMLWriter class and calls overridden method to write the graph to xml file. These generic approaches simplify the customization of file operations as described in Section 5.1.2.
The l-structure described in layout architecture (Section 5.2.1) is another generic solution that is developed in Chisio to make it more customizable. Chi-sio graph model and l-structure are separated completely and l-structure is devel-oped in a generic manner as it can be easily used in another application with an-other graph model. The connection between Chisio graph model and l-structure is established by AbstractLayout class. This class behaves like a bridge between them.
All layout algorithms in Chisio are developed for the l-structure and they all run on LGraph’s. Therefore, Chisio Layout Architecture can be decoupled from Chisio easily. This is an important point to emphasize the customization ability of Chisio layout.
Layout developers do not need to know Chisio graph model to develop new layout algorithms. They can implement their own algorithms by using generic l-structure which is a very basic implementation of compound graph data l-structure. Independent development of layout algorithms from Chisio model makes easier to implement new algorithms and they can be added to Chisio as described in Section 5.2.2 in a few steps.
CHAPTER 3. CHISIO ARCHITECTURE 18
3.1
The Model-View-Controller (MVC)
Archi-tecture
Chisio is based on GEF which is built on the MVC architecture (Section 1.2.3). MVC is used to separate the user interface from functional part of the system. So that changes to the user interface do not affect data handling, and that the data can be reorganized without changing the user interface.
In MVC, business logic is the model, data representation is the view. Decou-pling of them is done by using the controller concept.
• Model: The model object knows about all the data that need to be dis-played. It represents enterprise data of an application and the business rules that govern access to and updates of this data. Model is not aware about the presentation of data and how that data will be displayed.
• View : The view represents the presentation of the application. The view object refers to the model. It is not dependent on the application logic. It remains same if there is any modification in the business logic.
• Controller: Whenever the user sends a request for something, it always goes through the controller. The controller is responsible for intercepting the requests from the view and passes it to the model for the appropriate action. After the action has been taken on the data, the controller is re-sponsible for directing the appropriate view to the user. In GUIs, the views and the controllers often work very closely.
As Chisio is an easily customizable tool, the MVC architecture is the right choice as an architectural pattern. For example, we can easily add new user interface properties like new shapes for nodes without changing the model part.
3.2
Chisio Models
In graphs, all the nodes, edges and compound nodes are graph objects. In com-pound graphs, a comcom-pound node is also a simple node. These simple facts have yielded the design in Figure 3.1 for our model structure.
Figure 3.1: A UML Class Diagram illustrating the compound graph model used in Chisio
A compound node manages a list of child graph objects. A dedicated one is set as the root of the nesting hierarchy. Through recursive use of compound nodes as child objects, an arbitrary level of nesting can be created.
Each edge has a source node and a target node, while each node has lists of source and target connections which are the incoming and outgoing edges of the
CHAPTER 3. CHISIO ARCHITECTURE 20
node.
Chisio has bendpoint support for flexible edge routing. An edge has a list of EdgeBendpoint’s to implement this feature.
3.3
Chisio Figures
In figure hierarchy, EdgeFigure and NodeFigure are separated. Because, EdgeFigure is extended from PolylineConnection while NodeFigure is just a Figure. So they are not connected unlike the way they are in the model.
CompoundFigure is extended from NodeFigure to save the relational informa-tion between them as done in model. It just overrides some methods to disable the abilities that are inherited from NodeFigure like updateShape method.
For available shape types for a node like rectangle, circle and triangle, there exist Figure classes to draw these shapes. In Chisio, they were implemented as inner classes of NodeFigure class but they could be implemented separately as well (Figure 3.2).
There is a hierarchical structure of figure classes in GEF. A figure has a list of child figures. By adding a figure into the children list of another figure, they can be merged. For example, NodeFigure should normally have two children. One of them is for the text and the other for the shape. To draw a node with rectangular shape, we create a Label and a RectangleFigure then add them to children list of NodeFigure.
To easily add new shapes, new figure classes which draw those shapes must be created and added to the node figure.
The above structure is similar for edges. To add new properties to edge UI, child-parent relation is used.
CHAPTER 3. CHISIO ARCHITECTURE 22
3.4
Chisio Editparts
Editparts are the controllers and they behave as a bridge between nodes and figures. When a new object is created, first, corresponding editpart is created by the editpart factory. Then, newly created editpart creates the related figure for this object (Figure 3.3).
The sequence diagram for creating a new node with default values is explained in Figure 3.4. In this scenario, “Create Simple Node” menu item is selected and mouse is clicked on the editor to create a new node at specified location. Default shape is rectangle so RectangleFigure is created for new node.
Editparts process and respond to events, typically user actions, and may in-voke changes on the model. For example, when user interacts with the user interface in some way (e.g., resizes a node), corresponding editpart for that node handles the input event from the user interface, via its registered listeners. Then, interacted node’s model is updated in a way appropriate to the user’s action.
Figure 3.4: A UML Sequence Diagram illustrating creation of a no de with rectan gle shap e in Chisio
CHAPTER 3. CHISIO ARCHITECTURE 24
3.5
Chisio Actions and Commands
The editor UI of Chisio has a top menubar, toolbar and pop-up menus. All the items in these menus are connected with an Action to do the related operations.
Figure 3.5: A UML Sequence Diagram for running CoSE layout in Chisio
Generally an action creates and executes a corresponding Command to do the operation. For example, when CoSE layout is run by pressing the “CoSE Lay-out” button on toolbar, CoSELayoutAction is called. This action executes the LayoutCommand to run the CoSE layout algorithm. Corresponding scenario’s sequence diagram is in Figure 3.5
3.6
Inspector Windows
There are many properties dialogs in Chisio like “Node Properties”, “Edge Prop-erties”, “Compound PropProp-erties”, “Graph Properties” and “Layout Properties”. All these dialogs, except “Layout Properties” have similar interface. There is a table that can include items like text, combo, numeric text, font and color.
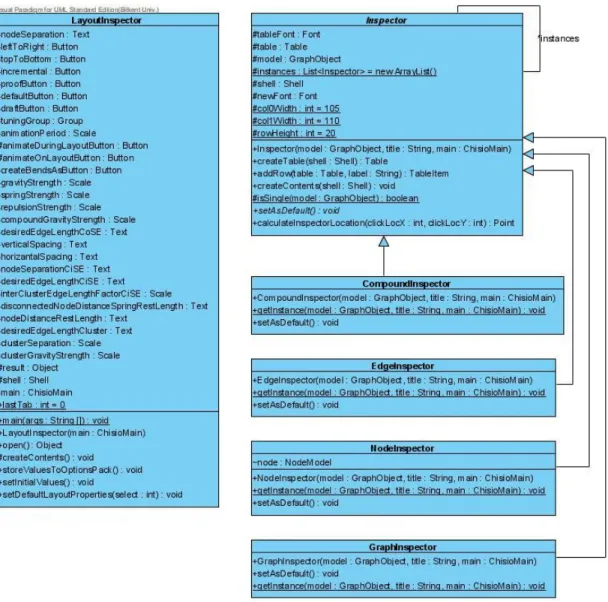
possible to insert new items easily. Graph objects’ inspectors are extended from this basic class (Figure 3.6). The height of the dialog, locations of the table and buttons are all calculated in the basic inspector class according to the number of items in the table. Detailed information can be found in Section 5.1.1.3.
Figure 3.6: A UML Class Diagram illustrating the inspector dialogs in Chisio
Each graph object can have only one inspector dialog. So we have used Singleton [8] design pattern in inspector dialogs. All instance are kept in a static list in the basic inspector class to track the inspector dialogs’ lifetimes.
CHAPTER 3. CHISIO ARCHITECTURE 26
3.7
Highlight Mechanism
Several layers have been defined in GEF. The structure of layers (top-to-bottom) for root is shown in Figure 3.7.
Highlight mechanism in Chisio to emphasize the user’s subgraph of interest is added by creating our own highlight layer. Our new layer is extended from the basic class Layer. Layers are just a transparent figure intended to be added exclusively to a LayeredPane, who has the responsibility of managing its layers.
Figure 3.7: Layers in GEF
Scalable layers has the scaling ability. Because of the zooming and scaling support in Chisio we have inserted our new highlight layer under Scalable Layers. When zoom level is changed, highlight layer is automatically scaled according to the new scale.
Also, we have added the highlight layer before all the other Scalable Layers. Because other layers may require user interaction (e.g connection layer which draws the edges), which highlight layer does not require. It will just draw a highlight effect around the highlighted graph object.
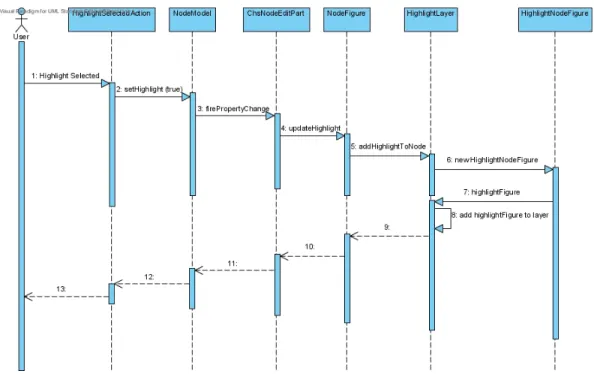
For both of the nodes, compound nodes and edges, there are two highlight figures to draw the highlighting effect around the objects. They are defined as a subclass in HighlightLayer. For example, when a node is highlighted, a new HighlightNodeFigure is created for highlighted node and added into the HighlightLayer (Figure 3.8).
Figure 3.8: A UML Sequence Diagram for highlighting a node in Chisio
3.8
Animation in Layout
In layout operations, animation feature is supported at all. Nodes and edges “smoothly” slide to their new locations with this support. This feature is basically achieved by a step-by-step updating of the view.
When animation is enabled, locations of objects before and after layout are kept. At the end of layout, while updating the view according to model, update process is done step-by-step with some time delays to give an animation effect to the view.
Also there is an extended version of animation which makes possible to track the nodes’ moves in layout steps, called “Animation during layout”. It is useful for tuning and debugging iterative layout algorithms such as spring embedders.
Animation during layout is achieved by creating a new method, animate, and calling it from the layout steps that we wish to track. animate method simply updates the view by using animation period parameter. Until the period time is
CHAPTER 3. CHISIO ARCHITECTURE 28
not completed, view does not updated. By changing the period parameter, the time delay can be decreased to track layout steps more detailed.
3.9
Use Cases
Chisio is a graph editor for end-users with many features. Zooming, highlighting, clustering, GraphML file loading and saving, basic operations like create, delete and move are some of them. All capabilities of Chisio are shown in the Use Case Diagram in Figure 3.9.
Figure 3.9: A UML Use Case Diagram for Chisio as an editor
Flexible object UI is another important feature of Chisio. UI properties of nodes, edges, compound nodes can be easily changed by using inspector di-alogs. The abilities of inspector dialogs are shown in the Use Case Diagram in Figure 3.10.
Chapter 4
Chisio as an Editor
Chisio is a graph visualization tool for creating, editing and layout of compound or hierarchically structured graphs. The tool features user-friendly, interactive creation and manipulation of compound graphs. In addition, a number of pop-ular graph layout algorithms, including ones designed by our group, have been implemented.
4.1
Drawings
Nodes, edges and compound nodes in Chisio all have distinct properties and UIs, which can be changed by its graphical user interface or through programming. Each node is drawn as a rectangle, ellipse or triangle. Edges can be drawn in a variety of styles. Compound nodes are always drawn with a rectangle, where the name text is displayed on its bottom margin and its geometry is auto-calculated using the geometry of its contents to tightly bound its contents plus user-defined child graph margins. Figure 4.1 shows the basics of drawing compound graphs in Chisio.
Figure 4.1: Basics of drawing in Chisio
4.1.1
Nodes
Nodes are represented by a rectangle shape as default. But there are other pre-determined shapes that can be added to the graph by user interaction. These are ellipse and triangle. If you would like to add more types of shapes, you can easily add them by following the instructions in the Chisio Programmer’s Guide [4].
Figure 4.2 shows a sample “Node Properties” window. By using this window, you can change your node’s appearance. This window can be opened up by either double clicking the node or by using the node’s pop-up menu.
Figure 4.2: A node and its properties window or inspector
You can also change the label (font type, size, and color), color, border color, shape and cluster ID of a node by using its “Properties” window. “Set As Default” button is used for setting this node’s properties as the default for the nodes that are to be created later on.
CHAPTER 4. CHISIO AS AN EDITOR 32
4.1.2
Compound Nodes
Similar to a simple node, a compound node’s properties may be changed via the “Compound Properties” window (Figure 4.3). This window may also be opened up similar to the “Node Properties” window by double-clicking on it or through its pop-up menu.
Figure 4.3: A compound node (right) and its properties window
You can change the label, color and border color of a compound node through this window. The size of a compound node is auto-calculated by the geometry of its contents, and the compound node is always just large enough to tightly bound its contents plus some user-defined margins. “Set As Default” button is used for setting this compound’s properties as the default for the compounds that are to be created later on.
4.1.3
Edges
Both directed and undirected graphs can be visualized in Chisio. Edges are assumed to be connected to the center of their source and target nodes. An edge is drawn clipped, according to the specific shape and position of its source and target nodes (Figure 4.4).
The appearance of edges can be changed by using the “Edge Properties” window. This window can be opened up by double clicking the edge or by the pop-up menu (Figure 4.5). You can change the label, color, style (Solid, Dashed), arrow type (None, Source, Target, Both) and width (thickness) through this
Figure 4.4: Examples of edges with different styles (left) and available edge types (right)
window. “Set As Default” button is used for setting this edge’s properties as default for the edges that are to be created later on.
Figure 4.5: Edge properties window or edge inspector
Graphs
There are certain general properties independent of specific graph objects. These can be adjusted through the “Graph Properties” window (Figure 4.6).
Figure 4.6: Graph properties window
Specifically, margins and highlight color (Section 4.5) can be customized through this window. Graph margins are used to separate graph objects from
CHAPTER 4. CHISIO AS AN EDITOR 34
their bounding boxes (such as nodes in a compound graph). Change of this value affects the margins around Chisio drawings when you fit them into the window.
4.2
Chisio Tools
There are several tools to interact with the graphs; namely: Select Tools, Zoom Tools and Create Tools. Create Tools will be explained in Changing Topology (Section 4.3).
4.2.1
Select Tools
The “Select Tool” can be chosen from the top menubar using “Edit — Select Tool” or from the toolbar menu. This tool is used to select nodes, edges and compound nodes. Multiple selections are supported. When you select an object, handle points are drawn around the object. Handle points for nodes are filled. This means that, node can be resized. Handle points for compound nodes are empty as they can not be resized (Figure 4.7).
Figure 4.7: Example selection handles for all types of graph objects
When you press the left mouse button on the drawing canvas outside the boundaries of any graph objects, and drag your mouse, the “Select Tool” is automatically switched to the “Marquee Selection Tool”. When you release the mouse button, all simple and compound nodes and edges that are completely included in the marquee selection area is selected (Figure 4.8).
Figure 4.8: Example use of the Marquee Selection Tool
4.2.2
Zoom Tools
Chisio has several zooming facilities: marquee zoom, zoom-in, zoom-out, zoom to specified level, and fit-in-window.
The “Marquee Zoom Tool” can be chosen from the top menubar using “Edit — Marquee Zoom Tool” or from the toolbar menu. This tool is used to zoom into a specified rectangular area of the graph (Figure 4.9 and Figure 4.10).
Other zoom operations like zoom-in, zoom-out and zoom to specified level are also supported. These operations can be found in the top menubar under “View — Zoom” and in the toolbar menu. In addition, graph pop-up menu provides zoom-in and zoom-out capabilities (Figure 4.11).
Fit-in-window operation is another useful zoom operation, which shows the whole graph in the window by properly scaling it. You can fit your graph in window from the top menubar using “View — Fit in window” or from the toolbar menu.
4.3
Changing Topology
You can interactively change the topological information of your graphs. You can create and delete graph objects easily. In addition, nodes and compounds can be transferred from one graph (root or child) to another (root or child). Finally
CHAPTER 4. CHISIO AS AN EDITOR 36
Figure 4.9: Before marquee zoom to the area specified by the red rectangle
Figure 4.11: Graph pop-up menu includes zoom-in and zoom-out operations
edges can be reconnected by changing their source and/or target nodes.
4.3.1
Creating Graph Objects
Creating a new node or a new compound can be done from the top menubar under the “Edit” menu or by using the toolbar menu. When you select creation tools, the cursor is changed to emphasize the create operation. When you click any place on the drawing canvas, the creation is performed (Figure 4.12).
Figure 4.12: Create a node by simply clicking on the drawing canvas, where you would like your new node to be placed; before the creation (left) and after the creation (right)
Creating a new edge can be done from the top menubar under the “Edit — Create Edge” menu or by using the toolbar menu. When you select the edge creation tool, the cursor is changed to emphasize the edge creation. You must click first on the source node for this new edge. Your second click must be on to the target node for this edge to complete the creation of the new edge (Figure 4.13).
CHAPTER 4. CHISIO AS AN EDITOR 38
Figure 4.13: Create an edge by first clicking on the source node and then on the target node
4.3.2
Deleting Graph Objects
To delete nodes, compound nodes or edges, you must select them first. Then you can delete them in one of the following ways:
• Pressing “DEL” button on your keyboard;
• Using the toolbar menu item ;
• Using “Edit — Delete Selected” in the top menubar;
• Using “Delete” item under the node pop-up menu.
Multiple graph objects may be deleted at once using selection of these objects together. One may also remove existing compound nodes while keeping their child nodes and edges at their current locations. This can be done from the top menubar using “Edit — Remove Compound” or by using the toolbar menu after selecting the compound node(s) to be removed (Figure 4.14).
4.3.3
Transferring Graph Objects
Another way to change the topology is to move a node from one compound node (or root graph) to another compound node (or root graph). In other words, you can change the parent of a node.
This can only be done when the mode of the selection tool is “Transfer Mode”. You can change the mode to “Transfer Mode” from the toolbar menu (Figure 4.15) or from the top menubar using “Edit — Transfer Mode”.
Figure 4.15: Move/Transfer Mode combo
When in the “Transfer Mode”, drag operations might mean change of own-ership or transfer. So you can transfer a node/compound node A into another compound node B by dragging and dropping A onto (within the bounds of) the compound node B. When you select a node and move it on to a compound node, compound nodes change background color to cyan to indicate that you will be transferring the selected node into the highlighted compound node should you release it at this location (Figure 4.16).
Figure 4.16: When transferring a node into a compound node, the compound node’s background color changes to indicate the transfer; initially (left), when the transfer of the selected node is about to be performed
Also when you are in the “Transfer Mode”, you can clone the selected graph objects by pressing the CTRL key while dragging them. When you press the
CHAPTER 4. CHISIO AS AN EDITOR 40
CTRL key, the cursor changes to indicate the cloning operation (Figure 4.17). Cloning is not possible in the “Move Mode”.
Figure 4.17: Clone operation; drag selected nodes pressing the CTRL key in the transfer mode and click to clone
Another transfer operation is via the “Create Compound from Selected” op-eration in the node pop-up menu. You can create a compound node from a set of selected nodes and compounds easily. This operation is also available through the top menubar using “Edit — Create Compound from Selected” (Figure 4.18).
Figure 4.18: Create compound (right) from selected nodes (left)
4.3.4
Reconnecting an Edge
You can change the source or target of an edge after creation of it. When an edge is selected, its handle points become visible. When you move your mouse to the handle point associated with the target or source node, the cursor is changed
into a plus icon. You can click, drag and drop this point onto its new target or source. While dragging, the cursor indicates potential new target or source for this edge (Figure 4.19).
Figure 4.19: Edge reconnection; after selection of the edge (left), during dragging (middle) and after reconnection (right)
4.4
Changing Geometry
You can change the geometry of nodes by moving or resizing them. The geometry of the edges, on the other hand, can be changed by re-routing them by creating new bendpoints, by moving or deleting existing ones. The layout operation also changes the geometry of graph objects as will be explained later on.
To move a node, first you must select it. Then click anywhere on the node and start dragging; you will see a “ghost shape” of your node as you drag it. You can drop it to the location you like. Upon release of the mouse the operation is completed (Figure 4.20). We assume the “Move Mode” here; during “Transfer Mode” this might mean a transfer operation as explained earlier in Section 4.3 in Transferring Graph Objects.
Figure 4.20: Move a node by selecting and dragging it
To resize a node, first you must select it upon which its handle points will be visible. By using these points, you can resize the node. Just select a handle point and move it; a ghost shape will appear indicating the new size of the node upon release of the mouse (Figure 4.21).
CHAPTER 4. CHISIO AS AN EDITOR 42
Figure 4.21: Resize a node; before (left) and after (right)
You can not resize compound nodes as their geometry is auto-calculated by the geometry of its contents as explained earlier. This is indicated by empty handles upon selection of compound nodes (Figure 4.22).
Figure 4.22: Compound nodes are automatically resized
Both move and resize operations may be applied to multiple objects simulta-neously for convenience.
Chisio supports bendpoints to freely route edges around other graph objects. You can create, delete and relocate bendpoints. When an edge is selected two handles of two different sizes becomes visible. The large ones (except for the end points of the edge used for reconnecting edges) correspond to the bends of the edge. The smaller ones, on the other hand, can be clicked on and dragged to create new bendpoints (Figure 4.23). Initial position of the newly created bendpoint will be right in between the two nearest existing bends on the edge but it will move with the mouse.
Figure 4.23: Bendpoint creation; after selection (left), during drag of the small handle (middle), and upon completion with the release of the mouse (right)
You can relocate existing bendpoints by dragging them to new locations as you like. If the final location of a bendpoint upon release of the mouse is to be aligned with its current neighbors of the bendpoint to make a straight line (or very near such a position), then the bendpoint is automatically deleted (Figure 4.24).
Figure 4.24: Bendpoint deletion; initially the edge has two bends (left); upon drag and release of the left bend, it is deleted to leave the edge with only one bend (right)
4.5
Highlighting
Graph objects may be highlighted using the highlight facility to differentiate them from others (e.g. a path, a cycle or a particular subgraph of interest). Selected objects may be highlighted through the “Highlight Selected” item under the node pop-up menu or using “View — Highlight Selected” in the top menubar. Multiple objects may be highlighted together (Figure 4.25).
Figure 4.25: Highlighting objects
You can change the highlight color from the graph pop-up menu (Figure 4.11). Thus different objects may be highlighted with different colors if desired.
You can remove highlights of all objects by selecting “Unhighlight All” item in the top menubar or from the graph pop-up menu. Alternatively, a subset of currently highlighted objects may be unhighlighted by first selecting them and then choosing “View — Unhighlight Selected” in the top menubar or “Unhighlight Selected” in the node pop-up window.
CHAPTER 4. CHISIO AS AN EDITOR 44
4.6
Cluster IDs
You can group or cluster a set of nodes in a Chisio graph. To do that, simply select the nodes you would like to assign a new cluster to, and then select “Cluster — Assign Selected to New Cluster” from the top menubar (Figure 4.26). This operation gives a new, unused cluster ID to selected nodes.
Figure 4.26: Creating a new cluster
You can find out about the new cluster IDs of these nodes through the node inspector (Figure 4.27). You may change the cluster ID of a node as needed from this window as well.
Figure 4.27: New cluster ID of the node as confirmed by the node properties window
You can also color-code the nodes in your Chisio graph according to their cluster IDs. Nodes in the same cluster are colored with the same, unique color. Simply select “Cluster — Color using ClusterIDs” from the top menubar (Fig-ure 4.28).
Figure 4.28: Coloring with cluster IDs results in three clusters, each with a unique color
You can reset the cluster information of selected nodes. If ClusterID of a node is “0”, this means that node does not belong to any cluster. Select the nodes you want to reset their cluster information, and then select “Cluster — Reset Clusters of Selected”.
4.7
Persistent Storage
You can save your graphs into a file for later use. Graphs are saved in GraphML file format [3], which is an XML-based graph format. In addition, your own files in GraphML format, possibly created by other programs may be loaded up into Chisio. Drag and drop is supported for convenient file loading as well.
Every property of a graph object is written into the file in a regular format. Below you can find parts of a GraphML file for specific examples.
Example 1: A highlighted node (Figure 4.29)
...
CHAPTER 4. CHISIO AS AN EDITOR 46
<data key="x">108</data> <data key="y">90</data> <data key="height">40</data> <data key="width">40</data>
<data key="color">14 112 130</data> <data key="borderColor">14 112 130</data> <data key="text">Node</data>
<data key="textFont">1|Arial|8|0|WINDOWS|1|-11|0|0|0|0|0|0|0|1|0|0|0|0|Arial</data> <data key="textColor">0 0 0</data>
<data key="clusterID">0</data>
<data key="highlightColor">255 255 0</data> <data key="shape">Rectangle</data>
</node> ...
Figure 4.29: A Highlighted node for example GraphML format
Example 2: A dashed edge (Figure 4.30)
...
<edge id="e0" source="n0" target="n1"> <data key="color">255 128 192</data> <data key="text">edge</data>
<data key="textFont">1|Comic Sans MS|12|2|WINDOWS|1|-16|0|0|0|400|1|0|0|0|3|2|1|66| Comic Sans MS</data>
<data key="textColor">0 0 255</data> <data key="style">Dashed</data> <data key="arrow">Target</data> <data key="width">2</data> </edge>
Figure 4.30: An edge for example GraphML format
4.8
Static Images and Printing
You may save the current drawings of your graphs as static images as well. Sup-ported image formats are BMP and JPEG. You have the option of recoding the entire drawing or only the currently viewable part of the drawing (Figure 4.31).
Figure 4.31: Save as image menu item
In addition, you can print your graphs from the top menubar “File — Print” or the toolbar menu. Print operation prints the whole graph in regardless of the currently viewable part of the drawing.
Chapter 5
Chisio Customization
5.1
Customize Editor
One can customize Chisio for their specific needs by adding new node/edge types or by modifying existing nodes/edges (UI and attributes) [4]. In addition, you may customize the menus to add new functionality as well as modifying node and edge menus and property inspectors.
5.1.1
Customizing User Interface
5.1.1.1 Adding New Shapes
There are several shapes available for nodes in Chisio: Rectangle, Circle and Triangle. These shapes may be sufficient for some applications but many appli-cations will require different types of shapes for drawing graphs of your own. In this part, we provide an example on how you can add a new shape to Chisio nodes.
If you want to put an image as a figure, then you should create a figure which draws an image file. For example suppose there is an image file node.bmp in C:
drive. We use it as a node shape in the following figure class.
import org.eclipse.draw2d.*;
import org.eclipse.draw2d.geometry.*; import org.eclipse.swt.graphics.Image; public class ImageFigure extends Figure {
public ImageFigure() {
super(); }
public ImageFigure(Rectangle rect) {
setBounds(rect); }
protected void paintFigure(Graphics g) {
Rectangle r = getParent().getBounds().getCopy(); setBounds(r);
Image image = new Image(null, "C:\node.bmp"); g.drawImage(image, r.getLocation());
} }
But if we want to draw our own shape, then we must create our own figure by providing the code for painting it. Our example shape is a diamond.
First, we need to write a figure class for the new diamond shape, which extends from the existing class Figure. Then we need to override the paintFigure method as shown below:
public class DiamondFigure extends Figure {
public DiamondFigure(Rectangle rect) {
setBounds(rect); }
protected void paintFigure(Graphics g) {
CHAPTER 5. CHISIO CUSTOMIZATION 50
setBounds(r);
PointList points = new PointList();
points.addPoint(new Point(r.x + r.width / 2, r.y));
points.addPoint(new Point(r.x + r.width, r.y + r.height / 2)); points.addPoint(new Point(r.x + r.width / 2, r.y + r.height)); points.addPoint(new Point(r.x, r.y + r.height / 2));
g.fillPolygon(points); g.drawPolygon(points); }
}
Above code segment implements a figure that draws a diamond. You can add this code into NodeFigure class as other figure classes for different shapes do (RectangleFigure, EllipseFigure and TriangleFigure classes).
Now we need to assign a name string to our new shape by adding it into the static array in NodeModel as shown below:
public static String[] shapes = { "Rectangle",
"Ellipse", "Triangle", "Diamond"};
NodeFigure class has an updateShape method. This method decides which figure will be drawn. So we need to add our diamond figure into this method. In addition, we must associate our newly added name string to our new diamond figure.
public void updateShape(String s) { this.shape = s; this.removeAll(); if (shape.equals(NodeModel.shapes[0])) { add(new RectangleFigure(getBounds())); } else if (shape.equals(NodeModel.shapes[1])) {
add(new EllipseFigure(getBounds())); } else if (shape.equals(NodeModel.shapes[2])) { add(new TriangleFigure(getBounds())); } else if (shape.equals(NodeModel.shapes[3])) { add(new DiamondFigure(getBounds())); } add(label); }
Here, we must be careful about the index of the newly added shape name “Diamond”. It is in the 4th place of the static array, so if shape’s type is the same with the element in the 4th place of static array (NodeModel.shapes[3]), this means that shape is a diamond and we create our new diamond figure.
By updating this method, we have completed addition of a new shape to Chisio nodes. See Figure 5.1 for examples of the new node shape.
Figure 5.1: Sample UIs for two diamond shaped nodes
5.1.1.2 Adding New Attributes
Each graph object (simple node, compound node or edge) in Chisio has several attributes. Existing attributes may be sufficient for drawings of many types of graphs. However specific applications are most likely to have other attributes. For example, one may want to maintain a dynamic size for the arrow heads of directed edges.
We first need to update the EdgeModel class to handle such a new attribute for edges. Specifically we need to add a field named arrowSize (say, with type int).
CHAPTER 5. CHISIO CUSTOMIZATION 52
In addition, a default value for this new field is needed (DEFAULT_ARROW_SIZE). Default values are defined in the “Class Variables” section of each class.
Furthermore, a constant variable is needed for firing the property change. When we change the arrow size, this change is to be propagated to the cor-responding edit-part. So, an identifier is defined in “Class Constants” section (P_ARROW_SIZE).
As usual, operation setter and getter methods are written for the newly cre-ated field. But in here, setter method fires the property change mentioned earlier.
public class EdgeModel extends GraphObject {
private NodeModel sourceNode; private NodeModel targetNode; protected String style; protected String arrow; protected int width; protected List bendpoints; protected int arrowSize; /** * Constructor */ public EdgeModel() { super(); this.text = DEFAULT_TEXT; this.textFont = DEFAULT_TEXT_FONT; this.textColor = DEFAULT_TEXT_COLOR; this.color = DEFAULT_COLOR; this.style = DEFAULT_STYLE; this.arrow = DEFAULT_ARROW; this.width = DEFAULT_WIDTH; this.bendpoints = new ArrayList(); this.arrowSize = DEFAULT_ARROW_SIZE; }
...
public int getArrowSize() {
return arrowSize; }
{
this.arrowSize = arrowSize;
firePropertyChange(P_ARROW_SIZE, null, arrow_size); }
...
// ---// Section: Class Variables
// ---public static String DEFAULT_TEXT = "";
public static Font DEFAULT_TEXT_FONT =
new Font(null, new FontData("Arial", 8, SWT.NORMAL)); ...
public static int DEFAULT_WIDTH = 1; public static int DEFAULT_ARROW_SIZE = 1;
// ---// Section: Class Constants
// ---public static final String P_STYLE = "_style";
public static final String P_ARROW = "_arrow"; public static final String P_WIDTH = "_width";
public static final String P_BENDPOINT = "_bendpoint"; public static final String P_ARROW_SIZE = "_arrowSize"; }
The model including the new attribute is now ready. Let’s modify the figure part accordingly now. For this, we must add a new field and an update method to set this field and change the UI. We might also need to update the paintFigure method, which draws the UI.
public class EdgeFigure extends PolylineConnection { ... boolean highlight; Color highlightColor; int arrowSize; /** * Constructor */
CHAPTER 5. CHISIO CUSTOMIZATION 54
public EdgeFigure(String text, Font textFont, Color textColor, Color color, String style, String arrow, int width, Color highlightColor, boolean highlight, int arrowSize) { super(); ... updateWidth(width); updateHighlightColor(highlightColor); updateArrowSize(arrowSize); } ...
public void updateArrowSize(int newArrowSize) {
// Do the operations for setting the arrow size }
... }
Now that we have updated the model and figure parts, we must connect them to each other. We need to update the edit-part for propagating the changes in the model to the figure (UI). The edit-part of an edge is implemented in class ChsEdgeEditPart. We must update createFigure and propertyChange methods in this class.
protected IFigure createFigure() {
EdgeModel model = getEdgeModel();
EdgeFigure eFigure = new EdgeFigure(model.getText(), model.getTextFont(), model.getTextColor(), model.getColor(), model.getStyle(), model.getArrow(), model.getWidth(),
model.getHighlightColor(), model.isHighlight(), model.getArrowSize()); eFigure.updateHighlight( (HighlightLayer) getLayer(HighlightLayer.HIGHLIGHT_LAYER), getEdgeModel().isHighlight()); ... }
public void propertyChange(PropertyChangeEvent evt) { if (evt.getPropertyName().equals(EdgeModel.P_TEXT)) { ((EdgeFigure)figure).updateText((String) evt.getNewValue()); } ... else if (evt.getPropertyName().equals(EdgeModel.P_HIGHLIGHT)) { ((EdgeFigure)figure).updateHighlight( (Layer) getLayer(HighlightLayer.HIGHLIGHT_LAYER)); } else if (evt.getPropertyName().equals(EdgeModel.P_HIGHLIGHTCOLOR)) { ((EdgeFigure)figure). updateHighlightColor((Color) evt.getNewValue()); } else if (evt.getPropertyName().equals(EdgeModel.P_ARROW_SIZE)) { ((EdgeFigure)figure).updateArrowSize((Integer) evt.getNewValue()); } }
Thus we have completed adding a new attribute into Chisio edges. In the next part, we will make the necessary changes to expose this new attribute to the users through the edge inspector window.
5.1.1.3 Modifying Inspector Windows
The implementation of object property inspector windows in Chisio are based on a class named Inspector and specific inspectors extend this class (e.g.
CHAPTER 5. CHISIO CUSTOMIZATION 56
EdgeInspector). If you want to add a new item to the edge inspector, first you must add it into EdgeInspector class as follows. We will just change the constructor of the class.
private EdgeInspector(GraphObject model, String title, ChisioMain main) {
super(model, title, main);
TableItem item = addRow(table, "Name"); item.setText(1, model.getText()); ...
item = addRow(table, "Width");
item.setText(1, "" + ((EdgeModel) model).getWidth()); item = addRow(table, "Arrow Size");
item.setText(1, "" + ((EdgeModel) model).getArrowSize()); createContents(shell);
... }
Here we add a new row with attribute name “Arrow Size”, whose value is taken from the corresponding model object. Now, we need to update createContents method of Inspector class to add interactivity to our newly added attribute. We already had five types of objects in our edge inspector tables: Combo, Text, Number, Color and Font. Our new attribute’s value is a number. So we need to add it into the if-statement, which is tagged with NUMBER.
public void createContents(final Shell shell) {
// Create an editor object to use for text editing final TableEditor editor = new TableEditor(table); editor.horizontalAlignment = SWT.LEFT;
editor.grabHorizontal = true;
// Use a selection listener to get seleceted row table.addSelectionListener(new SelectionAdapter() {
public void widgetSelected(SelectionEvent event) {