T.C.
ISTANBUL AYDIN UNIVERSITY INSTITUTE OF SOCIAL SCIENCES
EFFECTS OF FOREIGN DIRECT INVESTMENT AND FINANCIAL DEVELOPMENT ON THE ECONOMIC GROWTH IN THE EAST
AFRICAN COMMUNITY.
THESIS
Joyce NIYIMPA
Department of Business Administration Business Administration Program
T.C.
ISTANBUL AYDIN UNIVERSITY INSTITUTE OF SOCIAL SCIENCES
EFFECTS OF FOREIGN DIRECT INVESTMENT AND FINANCIAL DEVELOPMENT ON THE ECONOMIC GROWTH IN THE EAST
AFRICAN COMMUNITY.
M. Sc. THESIS
Joyce NIYIMPA (Y1612.130071)
Department of Business Administration Business Administration Program
Thesis Instructor: Prof.Dr. Ahmet Sedat AYBAR
DECLARATION
I hereby declare that all information in this thesis document has been obtained and presented in accordance with academic rules and ethical conduct. I also declare that, as required by these rules and conduct, I have fully cited and referenced all material and results, which are not original to this thesis.
DEDICATION
I dedicate this work to my parents especially my dad (Mr. Bararusesa) for his moral support and encouragement during the program.
FOREWORD
My profound gratitude goes to God for His mercy and unconditional protection. I also appreciate my supervisor Prof. Dr. Ahmet Sedat AYBAR for the advice and academic support during the course of the prograsm.
More so,special thanks to my family, especially my parents who provided me with unlimited support for the success of this project.
TABLE OF CONTENTS Page FOREWORD ... v TABLE OF CONTENTS ... vi ABBREVIATIONS ... viii LIST OF TABLES ... ix ABSTRACT ... x ÖZET ... 11 1. INTRODUCTION ... 1 1.1 Study Overview ... 1 1.2 Problem Identified ... 3 1.3 Study Objectives ... 3 1.4 Study Hypotheses ... 4
1.5 Operational Definition of Terms ... 4
2.1LITERATURE REVIEW ... 6
2.2 Empirical Literature ... 6
2.2.1 FDI, Financial Advancement and Economic Growth ... 6
2.2.2 Economic Growth and Trade Openness ... 8
2.2.3 Credit to Private Sector and Economic Growth ... 10
2.2.4 Inflation and Economic Growth ... 12
2.2.5 Gap in Literature ... 13
3.1TRENDS OF FDI INFLOWS IN EAC ... 14
3.2 Overview of FDI in Burundi ... 14
3.3 Overview of FDI in Kenya ... 15
3.4 Overview of FDI in Rwanda ... 17
Table 3.3 Overview of FDI in Rwanda (1995-2016) ... 17
3.5 Overview of FDI (Tanzania) ... 18
3.6 Overview of FDI in Uganda ... 19
4. METHOD AND DATA PRESENTATION ... 21
4.1. Data Description ... 21
4.2. The model of the study ... 22
4.3. Methods of analysis ... 22
4.3.1 Descriptive Analysis ... 23
4.3.2 Unit Root test ... 23
4.3.2.1Augmented Dickey-Fuller ... 23
4.3.3 Co-integration analysis ... 24
4.3.4 Diagnostic tests ... 24
4.3.4.1 Serial-Correlation Analysis... 24
4.3.4.2 Heteroskedasticity: white test ... 24
5. RESULT AND FINDINGS ... 26
5.1 Introduction ... 26
5.4 Co-integration Analysis. ... 33
5.5 Regression analysis ... 35
5.6 Means of Achieving the Stated Objectives ... 38
5.7 Diagnostic tests Results ... 40
6. CONCLUSION AND STUDY SUGGESTION ... 42
6.1 Conclusion ... 42
6.2 Policy Recommendations ... 43
6.3 Areas of Further Study ... 44
REFERENCES ... 45
ABBREVIATIONS
ADF : The Augmented Dickey-Fuller ANOVA : Analysis of Variance
BG : Breusch – Godfrey BoP : Balance of Payments BoT : Balance of Trade
BPM6 : Balance of Payments and international investment Position Manual CEIC : Census and Economic Information Center
DW : Durbin-Watson
EAC : East African Community
EG : Economic Growth
EU : European Union
FD : Financial Development FDI : Foreign Direct Investment G7 : Group of seven
GDP : Gross Domestic Product
GMM : Generalized Method of Moments
ICT : Information and Communications Technology IMF : International Monetary Fund
JB :Jarque-Bera
MαAs : Mergers and Acquisitions
MINICOM : The Ministry of Trade and industry
MINECOF : The Ministry of Finance and Economic Planning MININFRA : The Ministry of Infrastructure
MNE :Mutli-national Enterprises
MS : Member States
MTN : Mobile Telecommunications Network NISR : National Institute of Statistics of Rwanda NPP : Normal Probability Plot
OECD : Organization of Economic Commission for Development OLS : Ordinary Least Squares
PP : Philip-Perron
PDI : Private Domestic Investments RαD : Research and Development SSA : Sub Saharan African TSLS : Two-Stage Least Squares UN : United Nations
UNCTAD : United Nations Conference on Trade and Development UNDP : United Nations Development Programme
USD :United States Dollar VAR : Vector Autoregression
VECMs : Vector Error Corrections Models
LIST OF TABLES
Page
Table 3.1: Overview of FDI of BURUNDI (1995-2016)... 15
Table 3.2: Overview of FDI inflows Kenya (1995-2016) ... 16
Table 3.3 Overview of FDI in Rwanda (1995-2016) ... 17
Table 3.4 Overview of FDI Tanzania (1995-2016) ... 19
Table 3.5 Overview of FDI Uganda (1995-2016) ... 20
Table 4.1: Variables and their proxies ... 21
Table 5.1: Descriptive Analysis for Burundi ... 26
Table 5.2: Descriptive Analysis for Kenya ... 27
Table 5.3: Descriptive Analysis for Rwanda ... 28
Table 5.4: Descriptive Analysis for Tanzania ... 28
Table 5.5: Descriptive Analysis for Uganda ... 29
Table 5.6: ADF Tests result for Burundi ... 29
Table 5.7: Unit Root Break Test for Burundi ... 30
Table 5.8: ADF Tests result for Kenya ... 30
Table 5.9: Unit Root Break Test for Kenya ... 31
Table 5.10: ADF Tests result for Rwanda... 31
Table 5.11: Unit Root Break Test for Rwanda ... 32
Table 5.12: ADF Tests result for Tanzania ... 32
Table 5.13: Unit Root Break Test for Tanzania ... 32
Table 5.14: ADF Tests result for Uganda ... 33
Table 5.16: Johansen Co-Integration Test Results for Variables ... 34
Table 5.17: Estimated results for Burundi ... 35
Table 5.18: Estimated results for Rwanda ... 36
Table 5.19: Estimated results for Kenya ... 37
Table 5.20: Estimated results for Tanzania ... 37
Table 5.21: Estimated results for Uganda ... 38
Table 5.22: Breusch-Godfrey Serial Correlation LM Test ... 40
Table 5.23: Heteroscedasticity test: White ... 40
EFFECT OF FOREIGN DIRECT INVESTMENT AND FINANCIAL DEVELOPMENT ON THE ECONOMIC GROWTH IN THE EAST
AFRICAN COMMUNITY
ABSTRACT
This study aimed to investigate the effect of foreign direct investment and financial development on economic growth in the East African Community (EAC) using panel cross-sectional time-series data collected separately from 5 countries during the period from 1996 to 2015. The role of foreign direct investment(FDI) and financial development (FD) on the growth of an economy has been a topic of study for many researchers in several countries. A positive and negative impact of FDI and financial development has been found depending on countries or regions. A cross-sectional time-series regression analysis was used to measure the degree to which foreign direct investment, financial development, and economic growth are related to each other. The study investigated furthermore the relationship between trade openness, inflation and economic growth in the EAC. Using the Johansen cointegration model, we found between variables a long-run relationship. The study also found that all the variables are non-stationary at the level (0) form but have a unit root and are integrated at first difference I(1) by using the Augmented Dickey-Fuller unit root test for examining the stationarity of variables. The results of regression reveal that FDI has a negative effect on economic growth, it is found also that an increase or decrease in FDI doesn‟t generate economic growth in the countries of the EAC. Findings expose that economic growth is highly determined by domestic credit to the private sector, that the improvement of financial development can transform and generate economic growth in the countries of the EAC. The thesis finally revealed a positive and insignificant effect of trade openness on economic development in the countries of the EAC. It was concluded that inflation has a positive and significant effect on economic growth in EAC‟s countries.
Keywords: Foreign direct investment, economic growth, financial development, inflation, trade openness, East African Community
DOĞU AFRİKA TOPLULUĞUNDAKİ DOĞRUDAN YABANCI YATIRIMLARIN VE FİNANSAL GELİŞMENİN EKONOMİK BÜYÜME
ÜZERİNDEKİ ETKİSİ
ÖZET
Bu çalışmada, 1996'dan 2015'e kadar 5 ülkeden ayrı toplanan panel kesitsel zaman serisi verilerini kullanarak Doğu Afrika Topluluğu'ndaki (EAC) doğrudan yabancı yatırımların ve finansal gelişmenin ekonomik büyüme üzerindeki etkisini araştırmayı amaçlamıştır. Doğrudan yabancı yatırım (DYY) ve finansal kalkınmanın (DY) bir ekonominin büyümesindeki rolü, birçok ülkede birçok araştırmacı için bir çalışma konusu olmuştur.Ülkelere veya bölgelere bağlı olarak DYY ve finansal kalkınmanın olumlu ve olumsuz etkileri tespit edilmiştir. Doğrudan yabancı yatırım, finansal gelişme ve ekonomik büyümenin her biri ile ne ölçüde ilişkili olduğunu ölçmek için kesitsel bir zaman serisi regresyon analizi kullanılmıştır. Çalışma ayrıca, AÇA'da ticari açıklık, enflasyon ve ekonomik büyüme arasındaki ilişkiyi araştırmıştır. Johansen eşbütünleşme modelini kullanarak, sonuçlar değişkenler arasında uzun süreli bir ilişki olduğunu ortaya çıkardı. Çalışma ayrıca tüm değişkenlerin seviye (0) formunda durağan olmadığını, ancak bir birim kökü olduğunu ve değişkenlerin durağanlığını incelemek için Artırılmış Dickey-Fuller birim kök testini kullanarak ilk fark I (1) 'de entegre olduğunu buldu. Regresyon sonuçları, doğrudan yabancı yatırımın ekonomik büyüme üzerinde olumsuz bir etkisi olduğunu ortaya koymakta, doğrudan yabancı yatırımdaki artış ya da azalmanın AÇA ülkelerinde ekonomik büyüme yaratmadığı ortaya çıkmaktadır. Bulunan bulgular, ekonomik büyümenin iç krediyle özel sektöre yüksek oranda belirlendiğini, finansal kalkınmanın iyileştirilmesinin AAK ülkelerinde ekonomik büyümeyi dönüştürebileceğini ve üretebileceğini ortaya koymaktadır. Çalışma aynı zamanda, AAC ülkelerinde dış ticarete açıklığın ekonomik büyüme üzerinde olumlu ve önemsiz bir etkisinin olduğunu ve son olarak, enflasyonun AAK ülkelerinde ekonomik büyüme üzerinde olumlu ve önemli bir etkiye sahip olduğu sonucuna varılmıştır.
Anahtar kelimeler: Doğrudan yabancı yatırım, ekonomik büyüme, finansal gelişme, enflasyon, dışa açıklık, Doğu Afrika Topluluğu.
1. INTRODUCTION
This par twill cover the background, problem identified, objectives, research hypothesis, and study organization.
1.1 Study Overview
A country economy‟s health is usually measured by an overview of its economic growth and development. East African community as an area study of this research, it has been chosen because of its limited studies relating to the subject regardless of the countries that belong to EAC are the poorest countries in the world and their economy, over decades has been growing mostly because of the foreign aid received by those countries.
EAC is an intergovernmental organization located in the African great Lakers region formed by 5 countries which include Kenya, Burundi, Rwanda, Tanzania, and Uganda. All these countries are among the least developed countries with the lowest income per capita except Kenya that is among states that are in the process of developing their economy. South Sudan is excluded in this research for the reason of its missing data.
Historically, foreign companies across the globe tend to start divisions in nations that ingress their goods or services to get away with tax importation, they create their companies to take benefit of the internal subsidies particularly when goods or services are on a target between the European Union countries. For instance, products importation and exportation were subsidized for member countries in the European Union (Alfaro,2003). Due to the insufficient resources to finance long term development among countries and reducing poverty that is increasing in a harsh way, it was presumed that the attractiveness of foreign investor has a vital part in the growth of any economy. A small number of East Asian industrialized countrıes have experıenced a fast-growing economy, they stated that attracting FDI could fill the resource gap of low-income countries and avoid high debt while directly addressing the causes of poverty (Prasad et al., 2003).
In Africa, a number of scholars such as Akinlo (2004) examined the importance of FDI and financial development as fundamental tools for growth for several periods and the channel through which it boosts the export growth since it also improves on the exchange rate in most African countries. Literature had shown that direct positive exist between FDI and export growth. Since the trend in export can further be traced down to the level of investment which in most cases can be domestic or foreign investment in those countries. Uganda is among East African countries that attract the highest FDI. FDI stocks have increased steadily since 2000. However, after attaining a high-level recording 2012 with$1.2billion, foreign investment flows fall in 2016 to $541 million, according to UNCTAD. Nevertheless, thanks to the disclosure of oil saves, new financial specialists may be keen on the nation later on. Uganda is ranked by the World Bank 115th out of 190 in the 2017 Doing Business report, gaining one place compared to the previous year, after having already gained 27 places between 2015 and 2016. The most important advances have been made in terms of electricity connection and cross-border trade (Kiiza, 2007).
East Africa has seen the level of FDI fall considerably over recent years. The region attracts the lowest FDI compared to other sub-regions in Africa. In Kenya, a study by (Ngugi and Nyangoro, 2005) indicated that market size and low economic growth are the main factors that should be cited to better understand the entry of horizontal FDI in the market. By taking in consideration the GDP growth level and investment rates, Kenya has a poor and low GDP in the EAC. The growth of Gross Domestic Product rate is much higher in Uganda and Tanzania comparing those two countries with Kenya and they are performing better than South Africa in terms of GDP growth too. The fact that Kenya has a low GDP growth may occur as a discouragement of market-seeking FDI in the country. Regarding the population size, Kenya has a big market and the GDP per capita specify that the demand for electric power is also great in Kenya. In its attempt to increase the growth rate and development, the country has presented some incentives policies and transparency in the economy to attract more FDI (Tshipo S.M.,2018). As indicated by Organization of Economic Commission for Development (OECD), outside direct venture inspires innovation overflows, makes a progressively aggressive business condition, improve business advancement and lead to global exchange incorporation all of which add to development.
1.2 Problem Identified
The role of foreign investment to macroeconomic indicators has been hotly debated universally where Burundi and other Eastern Africa countries are not let out. Many of the previous researchers have concentrated on the effect foreign investment has on economic performance while some studied the nexus between foreign investment and its growth on the economy. Meanwhile, these studies outcome have not been consistent. More so, some countries in Africa such as Nigeria, Burundi, Ghana, Tanzania, Uganda, Kenya, to mention a few are aiming to attract FDI to spur their economic condition. Some developed countries opined that economic growth spur or stimulate foreign direct investment while some view that foreign direct investment stimulates growth, some also opined that a bi-directional association-ship exists between FDI and growth.
Furthermore, foreign investment and financial development in the growing development of any nation is a topical analysis in many nations(Obwona, 1999). These analyses provided a massive investigation between foreign direct investment, financial development, and economic development. Some studies have been conducted on foreign investment, financial development, economic growth in the East Africa Community, given the low trend of economic growth and that is occasioned by low foreign direct investment and financial development. The economic performance for the East African community countries is presently growing fast for some countries as Kenya, Rwanda, and Tanzania. There is therefore not much research conducted on the region of EAC in analyzing the results for each country, hence, the need for analyzing the impact of FDI, financial advancement on economic development in Eastern Africa Community is essential to examine in the empirical literature.
1.3 Study Objectives
• To determine the effect of FDI on economic growth of East African Community nations economy
• To determine the impact of trade openness and growth in the East Africa Community nations
• To ascertain the impact of financial development and growth of the Eastern African Community nations
• To ascertain the inflation effect on the economic growth of the Eastern African Community nations
1.4 Study Hypotheses
• H0: foreign direct investment has no significant impact on the economic
growth of the EAC nations
• H1: foreign direct investment has a significant impact on the economic
growth of the EAC nations
• H0: financial development has no significant impact on the economic growth
of the EAC nations
• H1: financial development has a significant impact on the economic growth of
the EAC nations
• H0: trade openness does not have a significant impact on the economic
growth of the EAC nations
• H3: trade openness have a significant impact on the economic growth of the
EAC nations
• H0: inflation does not have a significant impact on the economic growth of
the EAC nations
• H4: inflation has a significant impact of inflation on economic growth in the
EAC nations
1.5 Operational Definition of Terms
Foreign direct investment is defined as an investment made by a firm or an individual investor in one country into business interests located in another country. Normally, FDI is the sum of the capital equity, re-investment of earning and other short term and long-term capital. It provides facilities of technology, employment, and innovations which is the best forecaster for the economic growth of the country. Economic growth (EG) is usually indicated by an increase in the gross domestic product “GDP”. GDP defined as the total monetary value of all the final goods and
services produced by a country over a period of time. It represents the volume of a country„s economy.
Financial development (FD) is defined as a part of the secluded sector of markets, organizations, and instruments that encourage the growth of an economy and reduce poverty.
Domestic Credit to the private sector (DCPS) plays a vital part in reducing unemployment by creating jobs, efficiency, and productivity and inducing the development of any nation.
Inflation is known as a rise in the price index, it reflects the annual percentage changes of the cost of living to the average price of getting a basket of goods and services in a country‟ economy. It is studied by retail in price or consumer price index.
2.1LITERATURE REVIEW
A literature review involves an important aspect in so far as it is a contribution to the reader to understand clearly on which topic the study is conducted on. This section is considered as a crucial part in a research for the reason that it reviews work did by others previous researchers in order to obtain an understanding of the degree on which information is available and ready to be used and give a value to the study.
2.2 Empirical Literature
2.2.1 FDI, Financial Advancement and Economic Growth
Dhakalet al (2007), air a very costly omission, thereby posing reason for revalidation of country dummies which was not reported in the work. The analysis was mainly on the region where foreign direct investment has been most pronounced, namely the South and South-East Asia. The analysis engaged was the causality test, it was found that considerable deviation in the growth of foreign direct investment across studied nations. The study used nine Asian countries and the period reviewed was (1980-2001). The results obtained from the tests are that; concisely, the role of FDI on the growth of any economy is insignificant; conversely, the impact of economic growth on FDI inflows is both positive and significant.
Similarly, Asiedu and Lien (2011) endeavored to discover the impact that democracy has on FDI. The linear dynamic panel data model was utilized with a panel form of data. The method of analysis used was GMM estimator; and regression analysis. However, the number of years and countries under observation are sufficient, but the method of analysis can be upgraded to obtain a more precise result and therefore better application of policies.
The study by Ojo and Alege (2010) aimed to a study during recent global financial turmoil, policy implications with the effect of the sudden rise on FDI flows, as well as the consequent financial and economic development for the selected countries. It was based on International Trade, New Growth and Financial Theories and stated an
expanded Solow-type model in the determination of the endogenous growth model. The method of panel Vector Autoregression was also used, this was done principally to measure the active impact of FDI inflows for policy examination utilizing the role of stimulus reaction. The countries included and accessed were 27 and the period of estimation, 1987-2007. From the regression result, there is a significant positive value for GDP implying that the inflow of foreign capital will rise as there is an increasing economic activity within Africa.
Ayanwale (2007) studied the connection between foreign capital and Nigeria economic growth, thereby focusing on the country‟s definite focus on the foreign capital growth argument from 1970-2002. The study used OLS and 2SLS as estimation techniques. The empirical association-ship between non-extractive foreign capital and economic growth, investigating factors of foreign capital in the Nigerian economy.
In the study of Ayadi, Ajibolade, William, and Hyman (2014), unlike previous research which focused on examining, the connection between corruption and FDI flows in SSA countries. Panel data analysis was used along with the Fernandez Arias and the Montiel framework. The two variables as a result of this move together without drifting apart. Therefore, for SSA countries to attract FDI, it is expedient to transform their political and economic environment. However, to have more robust results in the study, the number of years and countries observed could be extended. Kohler (2010) in his study, intended to analyze the behavior of multinational enterprises (MNE) experiencing a fragile institutional setting in domestic economies. The correlation analysis method of estimation was employed with the revelation principle and the Cournot Nash equilibrium framework. It was discovered from the results that; the weak institution is an impediment to FDI. Also, an insecure environment, local bureaucracy, and corruption are all hindrances and affect FDI flows to host countries with weak institutions. However, the analysis did not consider that indigenous authorities stimulate competitiveness; within investors from the external context to take full advantage of the degree of corruption. The kind of data used was also not specified in the study.
The research of Obstfeld (2012) took a step further in establishing the association linking financial system development and the growth of an economy. Unlike a study
done by Ploeg and Poelhekke (2007), who stated in their study, that there was proof for a tangible undeviating effect of financial system development in relation to economic growth, and that the effect was negative. They found a positive and significant connection between the level of financial advancement and economic growth. There as well exists a minute logical proof that openness financially increases wellbeing in some way by enhancing security modifications of economic establishments or strategies. Also, there exists a no direct connection between the flow of foreign investment and macroeconomic stability. The conscious release of the financial account most likely will increase the incidence, and gravity of economic distresses. However, developing countries persistently follow the route of more openness financially.
Kose, Prasad, Rogoff, and Shang-Jin (2009) as they also stated that there is no systematic association linking trade openness and economic growth. There‟s an insubstantial positive relationship, linking the GDP average growth and variation in financial openness. There also is a positive impact of financial integration, on economic growth. There exists a positive correlation between financial openness, financial development, and institutional quality. There is a negative correlation with the logarithm of inflation and government deficit essentially zero. There exists a positive relationship linking the degree of financial integration and growth of productivity. However, no systemic significant association exists linking financial openness and output volatility. There exists an association linking growth and current account, utilizing averaged data for a long period, for either country is positive. The study aimed at solving the inadequacies of the previous approaches used, their focuses on the only direct effect of financial globalization, coupled with scant empirical support, about the association between growth and financial openness.
2.2.2 Economic Growth and Trade Openness
A work of Levine and Renelt (1992) insisted that receptiveness to exchange would support remote direct venture because of decreased assessments, accordingly raising up long haul development. In their ongoing investigation, a study cited that to decrease duties would emphatically affect the assets designated to research and development. Lopez (2005) viewed a microeconomic structure, sending out firms are more experienced and innovation situated than non-trading firms for the reason that
trading firms are increasingly opened to the escalated level of rivalry when contrasted with those organizations that attention just on the local market.
A survey of the cross-sectional writing uncovered that past scholarly work utilized various techniques and information from different nations to observe the causality among transparency and financial development. Notwithstanding, a few investigations understood that there was no causality by any stretch of the imagination. Among the analysts tending to the connection among receptiveness and monetary development are Zeren and Ari (2013), they investigated transparency and development among the G7 nations, for example, Germany, France, Canada, Japan, Italy, the United States, and the United Kingdom from 1970 to 2011 utilized the Granger non-causality test so far the discoveries revealed a bidirectional causal connection among transparency and financial development.
Gries and Redlin (2012) uncovered a long-run positive causal connection among receptiveness and development. They included that a bidirectional connection between receptiveness to exchange and development is uncovered for the most part for industrialized nations just when the nations are ordered by to their degree of salary gatherings. Albeit, few investigations in created nations have exhibited a negative causality between exchange transparency and GDP development create. An examination done by Akilou (2013) explored the relationship of exchange transparency and financial improvement the West African Economic and Monetary Union countrıes. The outcomes expressed that monetary development did not cause exchange receptiveness Ivory Coast at the 10% degree of noteworthiness.
Rodriguez and Rodrik (1999) cited in their examination that exchange receptiveness can prompt an expansion in salary however it isn't the wellspring of monetary improvement over the long haul. A similar theory has been upheld by Brunner (2003). He showed that exchange transparency exhibited a critical positive impact on pay anyway it doesn't influence the developing of the financial institutions. Indeed, even Rigobon and Rodrik (2004) in their examination, subsequent to considering endogeneity and a nation heterogeneity institutions exploring the connection between exchange receptiveness and monetary improvement, the after effects of their
exploration expressed that exchange transparency estimated as exchange share GDP negatively affects financial development.
Rodrik (2001) advanced development rates appear to be decidedly connected with higher duty rates during the 1990s as per the graphical introduction of information on 66 nations. Exchange volume and exchange power control as intermediaries for exchange receptiveness can prompt the off-base aftereffects of research. Aside from dissimilarities in size of the economies and the degree of advancement proxied by GDP per capita, capacity of enterprises and the ability of innovation on a nations might be reflected by of higher fare and import offers to GDP support the development of an economy through fares as well as imports of innovation, creation of related material and middle person items. This certifies expanding exchange joining all around exhaustive fares may not really be related to the administration's activity of exchange-related unbiasedness 'guideline'. This contention is in accordance with crafted by Busse and Koniger (2012) who demonstrated that the connection between exchange receptiveness and advancement present a solid reliance on exchange particulars. Also, they suggested the significance of researching the relationship in a dynamic system.
2.2.3 Credit to Private Sector and Economic Growth
Levine (1992) stated that an economy where capital is efficiently allocated help economy to grow and he found also that in the years from 1990, there has been observed a strong impact of financial development on the economy. Several empirical studies have utilized different analytical approaches to examine the connection between private sector credit and development in many countries.
At the same time, the results of a few studies have failed in a positive way to confirm if private sector credit and economic development are related to each other. Akpansung and Babalola (2012) in their study they investigated how banking sector credit and economic growth are related to each other in Nigeria from 1970-2008 by using the two-stage least squares estimation technique. Their results showed that private sector credit is impacted by economic growth over a period of time, while the lending rate interferes in the growth of an economy. In a similar study, Anthony (2012) concluded that there was a powerful connection between slacked estimations
of all-out private reserve funds, private area credit, open part credit, loan cost spread, trade rates, and financial development.
Backé and Zumer (2005) did a research on the factors that are behind the great improvement of local credit to the private segment in the new member states of the EuropeanUnion (EU) as of late. They uncovered that the development in the private division credit was higher in Baltic nations and Hungary than in the eurozone. They pointed out that in an environment where there is a presence of low inflation, Baltic countries are experiencing a high rate of growth in private sector credit. They proclaimed that high excessive loans to the private segment influenced decidedly a blend of macroeconomic and microeconomic pointers, which impact both free market activity part.
Krugman (1994) opined that productivity isn‟t everything, but in the long run, it is almost everything”. Fawehinmi (2013) empirically investigated the significance of economy to the interest rate policy on private domestic investments in Nigeria using time series data from 1980 to 2010. An error correction mechanism used in this study anticipated that the results are in the same with the results stated in other existing literature that private investments have a stronger and more positive effect on growth than public investments. The findings of Fawehinmi‟s study affirm that the government to boost its private sector for participating in domestic investments decrease the interest rate within the economy. Rama (1990) cited in Fawehinmi (2013) carried out an empirical investigation of the theoretical and empirical determinants of private investments in developing countries.
Tan and Tang (2011) analyzed how private domestic investments (PDI), the user cost of capital, and economic growth in Malaysia have a strong connection with one and each other between the time from1970 and 2009. Their results showed the existence of a bidirectional causal association between economic development and the user cost of capital in the long run as well as is strong evidence of bidirectional causality among the variables of interest. In the end, the impulse response function demonstrated that a malfunction in the user cost capital can indicate a bleak effect on PDI and growth in Malaysia.
2.2.4 Inflation and Economic Growth
Frimpong et al. (2010) in their research to analyze the intensity reaction that inflation may have on economic growth in Ghana during the period of 1960-2008, they discovered that inflation has a capacity to influence growth by 11 percent even if the test of significance has failed at a certain level. After dropping the money supply and the rate of the aggregate labor growth when they become insignificant. It further showed a strong relation of 11% between inflation and its close coefficients. Furthermore, they showed that small threshold levels, CPI is still significant on the growth of Ghana economy within the period studied. However, they didn‟t succeed to test the sensitivity of the estimated coefficients at a large sample to show if there was a new threshold impact. The work then clinched that the requırement of expanding the research on how to deal with the lower threshold by disputing that inflation has a significant connection with growth.
Espinoza et Prazad (2010) in their research, they investigated a probability of the level of inflation to affect GDP in Azerbaijan and others 165 countries including countries that are exporting oil by using a panel data of 165 countries between 1960-2007, they stated that for all country groups, a massive association between inflation and GDP growth was about 10% ( industrialized countries were excluded because of their threshold level is too much low). Estimated results indicated that inflation was higher than 13% and declined real non-oil GDP by 207 % per year.
Hasanov, (2010) utilized yearly information to examine the limit of how development rate of genuine GDP, CPI, and development rate of gross fixed capital formation are related to the financial development of Azerbaijan between 2000-2009. Hasanov expressed in his decisions, that the expansion rate to not affect decidedly GDP it must have a lower percent which will be under 13 %, on the contrary case, the positive association will change to negative when the swelling will have a rate that is in excess of 13 percent.
Mallik and Chowdhury (2011) found that in any case, the connection between inflation and economic development for Bangladesh, Pakistan, India, and Sri Lanka was statically and totally significant between those two indicators. Also, the responsiveness of development to variations in inflation rates was exceptionally low than the affectability of swelling to changes in development rates. The ramifications
of these outcomes were that regardless of whether swelling assumes a job in advancing monetary development, an economy that is developing quick ingests into expansion by overheating its gross national item.
Quartey, (2010) utilized the Johansen procedure to examine whether the income augmenting rate of inflation sway economic development in Ghana from 1970-2006. The aftereffects of the investigation demonstrated that there was a negative effect of expansion on development in Ghana during the time of the example contemplate. Also, by utilizing the Laffer bend, Quartey found that an income amplifying rate of expansion was at 9.14 % over the time of the study. He at long last expressed that the rate of expansion that expanding the development of an economy is certainly not a solitary digit one.
2.2.5 Gap in Literature
The empirical review above has shown the association between foreign direct investment, financial development and the growth of the economy in a country. But these studies were done in different environments and hence the results may not be generalized to East Africa specifically. Therefore, a gap to fill in the literature which concerns the nexus between foreign direct investment, financial development, and economic growth strongly exist. The chapter is taken an important part of the study as far as findings revealed by past different researchers were a valuable asset to understand the degree of available information on the topic. Therefore, this part provides a summary of academic works made by other researchers that will be crucial to back up the results of our work.
3.1TRENDS OF FDI INFLOWS IN EAC
This section offers a review which empirically based on the trends of FDI in different countries. The overview determinations are done based on the determination of the FDI trends in 5 East African countries.
3.2 Overview of FDI in Burundi
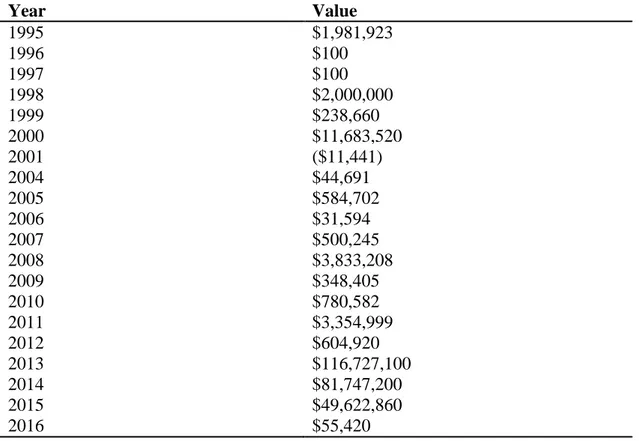
Burundi is facing many challenges to attract foreign investors. It has a weak political and security position and besides that, its public institutions have an absence of human and financial capital and its prıvate sector and domestic market need to be developed and more diversification are requıred for the country market. Regarding foreign investment, FDI in Burundi increased from a middling of $0,5 million in 1999 to $10 million in 2009 (UNCTAD, 2010), it showed that the amount of FDI has increased twenty times in 10 years.
The country owed this rising in FDI attaractiveness to political stabilization situation and some actions that have been put on the ground by the government in recent. In 2016, Burundi the value of Foreign direct investment, net inflows was $ 55,420. Over the last few decades, the value of FDI has been varying between $1167,727,100 in 2013 and ($11,441) in 2001 (Index Mundi)
Burundi‟s official outlook about FDI is reviewed in the new Investment Code, which was officially approved on September 2008 and it has an aim of attracting and motivating foreign investors by opening the doors for new acquisitions, transformation, distribution of goods and services and production. The investment code describes the need that the government has to encourage foreign investment but unfortunately, the investment code must be improved because it outlines a lack of transparency, specific adjustments that may drive to a high-level foreign investment (Martin,2017).
Table 3.1: Overview of FDI of BURUNDI (1995-2016) Year Value 1995 $1,981,923 1996 $100 1997 $100 1998 $2,000,000 1999 $238,660 2000 $11,683,520 2001 ($11,441) 2004 $44,691 2005 $584,702 2006 $31,594 2007 $500,245 2008 $3,833,208 2009 $348,405 2010 $780,582 2011 $3,354,999 2012 $604,920 2013 $116,727,100 2014 $81,747,200 2015 $49,622,860 2016 $55,420 Source: INDEXMUNDI, 2017
3.3 Overview of FDI in Kenya
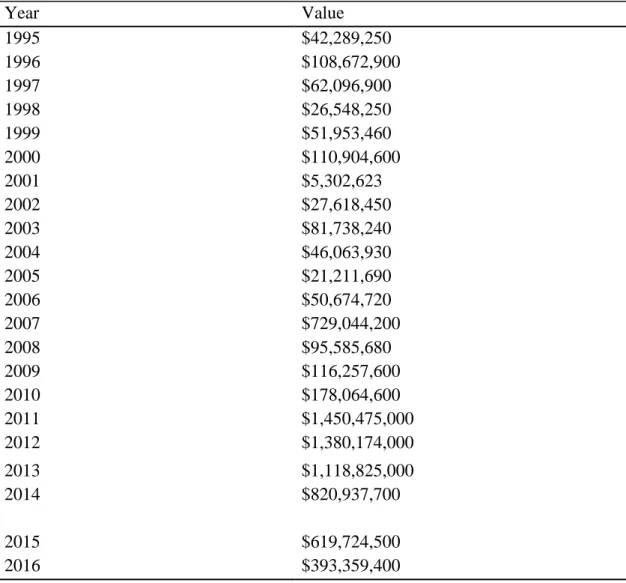
Kenya's FDI raised by $671.5million in Dec 2017, related to an increase of $393.4million in the previous year. The highest FDI registered in Kenya was 1.45 USD billion in 2011 and the lowest was $0.4million in Dec 1988. Kenya lately reports a deficit of $317.4million 2018. Kenya's FDI rises up by $257.1million and it's Foreign Investment decreased by $ 109.8million. The Nominal GDP was recorded as $23.0billion in 2018 (CEIC, 2018).
Kenya‟s FDI inflow showed a spectacular increase by hitting a massive grow in FDI of $0.67billion in 2017. Nevertheless, the growth did not give to Kenya a compelling volume of FDI, and it revealed that it was depending on other keys to grow eastern Africa economies. Kenya has been ranked by the United Nations Conference on Trade and Development (UNCTAD) as the fourth country that received the highest FDI in East Africa after Ethiopia, Tanzania, and Uganda in 2018. In spite of depending on other East Africa‟s key economies, Kenya recorded a grow of FDI inflow from $0.39 billion (Sh39 billion) in 2016 to $0.67 billion in 2017, disregarded
both to globally and Africa trend where the rising of inflows is caused by a declıne in commodity earnings and value of cross-border mergers and acquisitions (M&As)(Trademarkea,2018)
Kenya attracts investments more likely from US companies mostly prominent tech-oriented companies, Microsoft, Oracle, and Boeing. The United Kingdom entreprises of beer and pharmaceuticals companies as Johnson and Johnson in the United States also contribute to the replenishment of Kenya‟s FDI pipe. Infrastructure projects financed by foreign companies like the Mombasa–Nairobi railway have helped to raise economic performance and to create FDI inflows into the country.
Table 3.2: Overview of FDI inflows Kenya (1995-2016)
Year Value 1995 $42,289,250 1996 1997 1998 1999 2000 2001 2002 2003 2004 $108,672,900 $62,096,900 $26,548,250 $51,953,460 $110,904,600 $5,302,623 $27,618,450 $81,738,240 $46,063,930 2005 $21,211,690 2006 $50,674,720 2007 2008 $729,044,200 $95,585,680 2009 $116,257,600 2010 $178,064,600 2011 $1,450,475,000 2012 $1,380,174,000 2013 $1,118,825,000 2014 $820,937,700 2015 $619,724,500 2016 $393,359,400 Source: INDEXMUNDI,2017
3.4 Overview of FDI in Rwanda
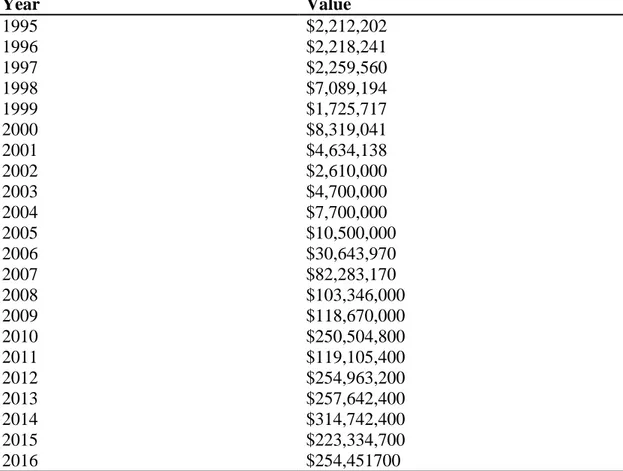
In the year of 2005 and 2009, the inflow increased at an average of 70.0 % every year by reaching a high amount of $119million of investments before it decreased to $42 million in 2010. The government aimed to attract foreign investors into the Rwandan economy as a priority factor. The 2009 boom reflects significantly on the investment of $117million in telecommunications by Millicom. The average of Rwanda FDI inflows was $ 232 million between 2009 and 2017. FDI reached the hıghest amount of investment in 2014 with $ 315 million and its lowest investment was recorded in 2009 with $ 118.67 million (Trading economics,2019). Rwanda FDI has been fluctuating between $314,742,700 in 2014 and $1,000 in 1994 (UNİCTAD, 2012)
Table 3.3 Overview of FDI in Rwanda (1995-2016)
Year Value 1995 $2,212,202 1996 $2,218,241 1997 $2,259,560 1998 $7,089,194 1999 $1,725,717 2000 $8,319,041 2001 2002 2003 $4,634,138 $2,610,000 $4,700,000 2004 $7,700,000 2005 $10,500,000 2006 $30,643,970 2007 $82,283,170 2008 $103,346,000 2009 $118,670,000 2010 $250,504,800 2011 $119,105,400 2012 $254,963,200 2013 $257,642,400 2014 $314,742,400 2015 $223,334,700 2016 $254,451700 Source: INDEXMUNDI,2017
3.5 Overview of FDI in Tanzania
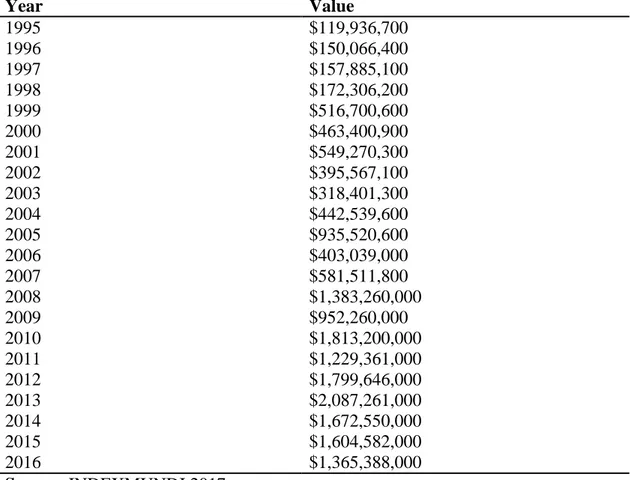
Tanzania is becoming a state that is bringing a high amount of foreign investments in Africa. Tanzania has attracted massively FDI inflows between 1995 and 2000 which lead to market reform and create more competitiveness and evolution of the new area of investments, it received a billion dollars of investment inflows in that period compared with only $90 million during the preceding six years (Lindhal et al.,2010).
Tanzania recently joined the FDI field. For that reason, the institutions that are related to the FDI development has to be improved in a long way as the new investment strategies are implemented. The FDI so far has only touched the mining sector. Other indicators such as agro-business are the potential sectors that need further investment for the reason that they are unexploited. The challenge now is to push FDI to new frontiers, achieving higher levels of investment inflows and increasing the scale and scope of benefits from FDI. (Lindahl and Yvonne, 2010). Tanzania has recently performed high progress towards implanting a legal structure for FDI which is open and highly transparent. The 1997 Investment Act has been showing imperfections and a replacement is needed by introducing a new, modern act that is reflecting the current situations of the entire Tanzania. Other areas needing attention are commercial and contract, labor and competition law. The review and improvement of the incentives system must be equally considered. A plan of revising regulations fishing and tourism sectors could open new doors for Foreign investors (UNCTAD,2002)
Since 1985, at that time, Tanzania was starting the process of transiting from a centralized economy to market economy, the government put many efforts in its economic development by rising FDI role. More so, economic development was decreasing and inflation was excessive in the early 1990s but in the middle of 1990s, when the economic situation was improved, the country attracted many investors through the turning point of market-driven economies and a setting up of a favorable strategy that allows FDI to grow (UNCTAD,2002)
From 1995 to 2000 Tanzania obtained $1billion of FDI compared to $2million that it received from 1986 to 1991. Annually, from 1992 and years ahead, the FDI inflows climb to $12 million, after it raised fast, to $50 million in 1994 and
$150million in 1995. FDI inflows in 1996 were sustainable at a level of $150 million moreover the inflows continued to grow lower and it reached $193million in 2000. (UNCTAD, 2002).
Table 3.4 Overview of FDI Tanzania (1995-2016)
Year Value 1995 $119,936,700 1996 $150,066,400 1997 $157,885,100 1998 $172,306,200 1999 $516,700,600 2000 $463,400,900 2001 2002 2003 $549,270,300 $395,567,100 $318,401,300 2004 $442,539,600 2005 $935,520,600 2006 $403,039,000 2007 $581,511,800 2008 $1,383,260,000 2009 $952,260,000 2010 $1,813,200,000 2011 $1,229,361,000 2012 $1,799,646,000 2013 $2,087,261,000 2014 $1,672,550,000 2015 $1,604,582,000 2016 $1,365,388,000 Source: INDEXMUNDI,2017
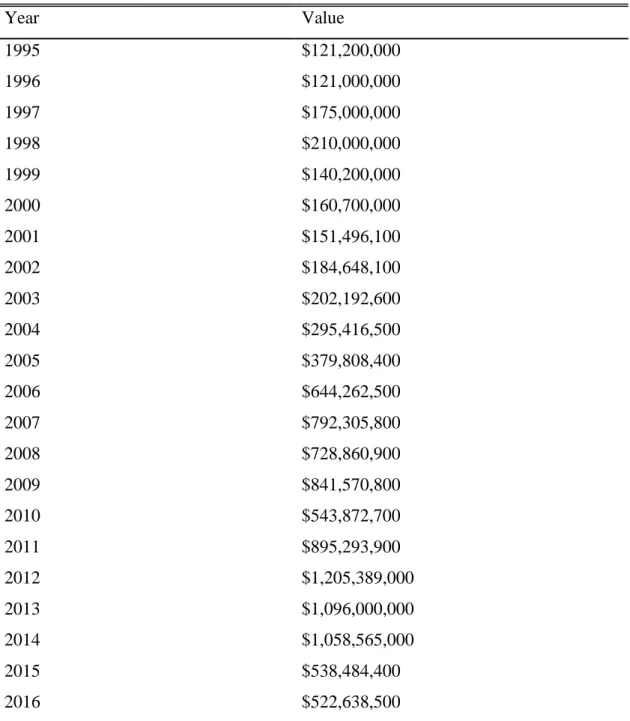
3.6 Overview of FDI in Uganda
Uganda‟s latest Foreign direct investment was $552,638,500 in 2016. During the past years, the value for this FDI has differed between $1,205,589,000 in 2012 and $11,900,000 in 1972. The Foreign Direct Investment inflows have an equıvalent value of $894,2in 2011. By 2012, FDI inflows raised by $ 311.2 million, from $ 894.2 million received in 2011 to $1,205.4million. The increased inflow was mainly accounted by direct equity capital and borrowings from affiliated companies. FDI transactions during 2013 declined by $109.3 million to $1,096.1 million from the amount of $1,205.4 million which had been registered in 2012. The reduction in FDI
companies, especially from foreign debt. (Private Sector Investment Survey report, 2014). FDI inflows levels were always elevated which was between $894.2 million in 2012 to $ 1.05 billion in 2014 and this was mainly due to mineral resources and oil sector.
Table 3.5 Overview of FDI Uganda (1995-2016)
Year Value 1995 $121,200,000 1996 1997 1998 1999 2000 2001 2002 2003 2004 $121,000,000 $175,000,000 $210,000,000 $140,200,000 $160,700,000 $151,496,100 $184,648,100 $202,192,600 $295,416,500 2005 $379,808,400 2006 $644,262,500 2007 2008 $792,305,800 $728,860,900 2009 $841,570,800 2010 $543,872,700 2011 $895,293,900 2012 $1,205,389,000 2013 $1,096,000,000 2014 $1,058,565,000 2015 $538,484,400 2016 $522,638,500 Source: INDEXMUNDI, 2019
4. METHOD AND DATA PRESENTATION
This section presents the data description and the methodology applied in this research with the purpose of examining the effect of FDI, financial and economic development in the East African community. The summarized model of the study and the presentation of the variables that have been used to test hypotheses are presented. Furthermore, the estimation and diagnostics tests used to study the goodness of the model are discussed.
4.1. Data Description
This research used quantitative and secondary data for the dependent and independent variables. The cross-sectional and time-series data of the responsive variable (economic growth) and the explanatory variables (FDI net inflows, trade openness, financial development, and inflation ) that covers the period from 1996 to 2015 were gathered from the World Development Indicator, African development indicator and the International world development Fund websites. The data available for the five countries are relevant and explicable to analyze the effect of foreign investment inflows and financial development on the economic growth in the East African Community.
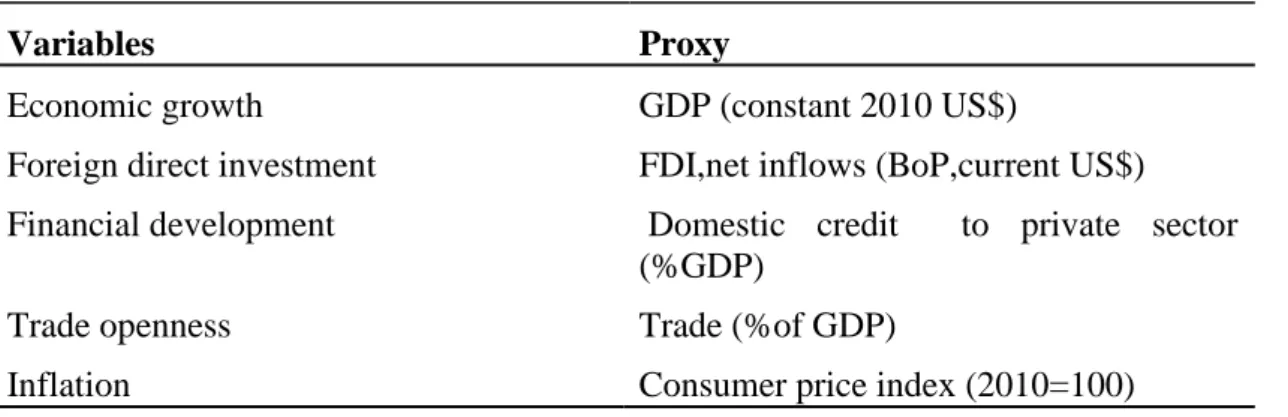
Table 4.1: Variables and their proxies
Variables Proxy
Economic growth GDP (constant 2010 US$)
Foreign direct investment FDI,net inflows (BoP,current US$) Financial development Domestic credit to private sector
(%GDP)
Trade openness Trade (%of GDP)
4.2. The model of the study
Therefore, descriptive statistics and t statistics are used to establish the distribution of the data. The regression analysis was employed to study the connection between FDI and financial development on economic growth.
The basic linear regression model for longitudinal data is specified below
Where
Y = dependent variable X = independent variable
To test FDI, financial development, trade openness, inflation on economic growth, the following model is built as the research model for this study:
Where
EG represents economic growth
FDI represents Foreign Direct Investment FD represents Financial Development TO represents Trade Openness
IN represents Inflation
β_(1 )-β 4 represents the elasticity of the coefficients t represents time
ε represent the error term
4.3. Methods of analysis
Cross-sectional and time-series data or balanced panel data analysis was employed to analyze the study. Balanced panel data has more advantages than cross-sectional or time-series data. This technique of analysis has a greater degree of freedom and is desirable to analyze the non-stationarity of the data (Hsiao,2003).
4.3.1 Descriptive Analysis
During data analysis, a discussion of descriptive analysis is presented on the way to measure the central tendency the mean, median, standard deviation, the variance, the maximum and minimum variables so that a brief summary of the sample data can be provided and allow a better explanation of the result.
This study presents the descriptive statistics that comprise five variables to summarize and describe our annual data collected from 1996 to 2015, where GDP per capita is the response variable and the independent variables are FDI net inflows, trade openness, domestic credit to the private sector and consumer price index.
4.3.2 Unit Root test
This study employed the stationarity analysis to test whether the mean and variance of the stochastic term were constant over time. The Augmented Dickey-Fuller (ADF) is appropriate for this work.
4.3.2.1Augmented Dickey-Fuller
The ADF test is used in this research toexamine the level on which variables are integrated.
With the ADF tests, the null hypothesis affirms that a unit root exists in the time series (non-stationary time series), which is
H0: the series has a unit root
the alternative hypothesis affirms that there is no unit root in the time series, that the time series is stationary (no unit root) which is
H1: the series has no unit root
If the rejection of the null hypothesis succeeded, we can conclude that a unit root doesn‟t exist in the series. A classical regression model requires that responsive and explanatory variables should be stationary and that the errors have to have a constant mean and finite variance. Non-stationary variables are observed in spurious regression and as Granger and New bold (1974) argued, they are indicated by a low Durbin-Watson (DW) statistic and a great R², t-and F-statistics appear to be
sufficiently great, but the results obtained come out to not have any economic sense (Verbeek,2000: 281). The results "look good" as the least-squares estimates are not consistent and the usual test of statistical inference does not hold.
4.3.3 Co-integration analysis
The notion that there is a long-run trend for the FDI, financial development to grow relative to GDP growth or vice-versa has been a matter in economics that is frequently questioned. Therefore, if the variables are identified as having a random pattern and at the same time they are following a common long-run equilibrium relationship, then these variables should be co-integrated. Engle and Granger (1987) stated that co-integrated variables must have a long-run relationship. The main reason that this test has been widely used that it provides an effective background for testing and estimating time-series data both short-run and long-run relationships the variables have to each other.
This study applies an alternative test Johansen cointegration test the existence of the integration order of the proxies and looks at the short and the long-run effects between the proxies of observation.
4.3.4 Diagnostic tests
4.3.4.1 Serial-Correlation Analysis
Serial correlation is a correlation among members of the series of error terms ordered in time. It is mainly caused by incorrect functional forms, autoregressions, manipulation of data, data transformation and non-stationarity of data. The serial correlation test can be detected using the graphical method, Grey test, Durbin-Watson test, and Breusch-Godfrey test. In this study, the BG test based on the Lagrange Multiplier is chosen since other tests have drawbacks that made the BG test favored.
4.3.4.2 Heteroskedasticity: white test
They are many tests that are used to test if the residuals are heteroskedastic or homoscedastic. The residuals to be homoscedastic is more desirable than when the residuals are heteroskedastic. If the rejection of the null hypothesis is not reached, the
conclusion will be that our residuals are homoscedastic (p-value > 5%). This study used a white test to test for the heteroskedasticity of the residuals.
5. RESULT AND FINDINGS 5.1 Introduction
This section presents a review of the data with an empirical analysis concentrating on the major variables that were stated in methodology. The study used a combination of graphical and empirical tools for carrying out the analysis in order to answer all the objectives that were inherently stated in the previous sections of the study. The analysis involves carrying out a comprehensive univariate analysis of each of the variables. This is intended to discover any forms and nature of trends in the data prior to carrying out an in-depth analysis. It involved the use of both the descriptive statistics and graphics for summarizing the data.
5.2 Descriptive Analysis
Table 5.1 presents a summary of descriptive statistic for the variables considered for analysis namely GDP growth, FDI, domestic credit to private sector, inflation and trade openness. It described the distribution of each variable with respect to mean, standard deviation, minimum and maximum values for the 20 observations.
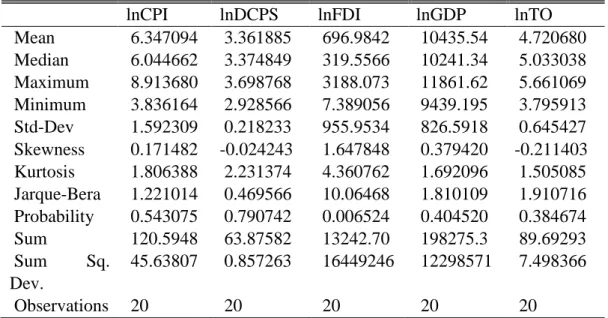
Table 5.1: Descriptive Analysis for Burundi
lnCPI lnDCPS lnFDI lnGDP lnTO
Mean 6.347094 3.361885 696.9842 10435.54 4.720680 Median 6.044662 3.374849 319.5566 10241.34 5.033038 Maximum 8.913680 3.698768 3188.073 11861.62 5.661069 Minimum 3.836164 2.928566 7.389056 9439.195 3.795913 Std-Dev 1.592309 0.218233 955.9534 826.5918 0.645427 Skewness 0.171482 -0.024243 1.647848 0.379420 -0.211403 Kurtosis 1.806388 2.231374 4.360762 1.692096 1.505085 Jarque-Bera 1.221014 0.469566 10.06468 1.810109 1.910716 Probability 0.543075 0.790742 0.006524 0.404520 0.384674 Sum 120.5948 63.87582 13242.70 198275.3 89.69293 Sum Sq. Dev. 45.63807 0.857263 16449246 12298571 7.498366 Observations 20 20 20 20 20
The descriptive report of the variables used in Burundi revealed the result of mean, median, maximum, minimum, Skewness, Kurtosis and Jarque-Bera statistics. The result of Skewness showed that CPI, FDI, and GDP are positively skewed while DCPS and TO are negatively skewed. Kurtosis result revealed that CPI, GDP, DCPS, and TO are platykurtic (thin tail that is less than 3) while FDI showed leptokurtic (fat-tail that is more than 3) in nature. More so, the Jarque-Bera statistic revealed that all the proxies are normally distributed except FDI which is not normally distributed using the probability of Jarque-Berastatictic as presented in the above table.
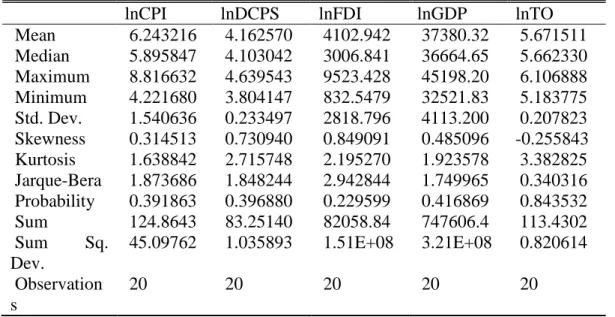
Table 5.2: Descriptive Analysis for Kenya
lnCPI lnDCPS lnFDI lnGDP lnTO
Mean 6.243216 4.162570 4102.942 37380.32 5.671511 Median 5.895847 4.103042 3006.841 36664.65 5.662330 Maximum 8.816632 4.639543 9523.428 45198.20 6.106888 Minimum 4.221680 3.804147 832.5479 32521.83 5.183775 Std. Dev. 1.540636 0.233497 2818.796 4113.200 0.207823 Skewness 0.314513 0.730940 0.849091 0.485096 -0.255843 Kurtosis 1.638842 2.715748 2.195270 1.923578 3.382825 Jarque-Bera 1.873686 1.848244 2.942844 1.749965 0.340316 Probability 0.391863 0.396880 0.229599 0.416869 0.843532 Sum 124.8643 83.25140 82058.84 747606.4 113.4302 Sum Sq. Dev. 45.09762 1.035893 1.51E+08 3.21E+08 0.820614 Observation s 20 20 20 20 20
Source: Author‟s computation (2019)
The report of the descriptive analysis used in Kenya depicted the result of Skewness which shows that CPI, FDI, DCPS, and GDP are positively skewed while TO is the only variable that is negatively skewed. The Kurtosis result revealed that CPI, GDP, DCPS, and FDI are platykurtic while TO showed leptokurtic in nature. More so, the Jarque-Bera statistic revealed that all the variables are normally distributed.
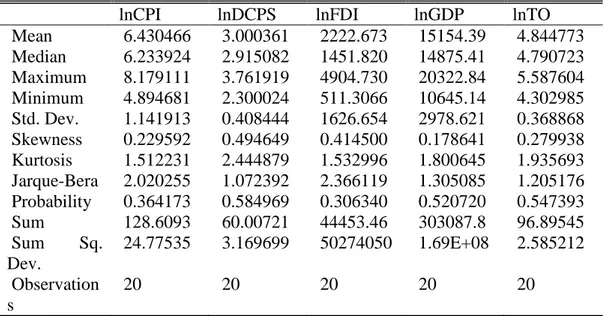
Table 5.3: Descriptive Analysis for Rwanda
lnCPI lnDCPS lnFDI lnGDP lnTO
Mean 6.430466 3.000361 2222.673 15154.39 4.844773 Median 6.233924 2.915082 1451.820 14875.41 4.790723 Maximum 8.179111 3.761919 4904.730 20322.84 5.587604 Minimum 4.894681 2.300024 511.3066 10645.14 4.302985 Std. Dev. 1.141913 0.408444 1626.654 2978.621 0.368868 Skewness 0.229592 0.494649 0.414500 0.178641 0.279938 Kurtosis 1.512231 2.444879 1.532996 1.800645 1.935693 Jarque-Bera 2.020255 1.072392 2.366119 1.305085 1.205176 Probability 0.364173 0.584969 0.306340 0.520720 0.547393 Sum 128.6093 60.00721 44453.46 303087.8 96.89545 Sum Sq. Dev. 24.77535 3.169699 50274050 1.69E+08 2.585212 Observation s 20 20 20 20 20
Source: Author‟s computation (2019)
The result in Table 5.3 of the descriptive analysis in Rwanda depicted the result of Skewness which shows that CPI, FDI, DCPS, FDI, and GDP are positively skewed. The Kurtosis result revealed that CPI, GDP, DCPS, FDI, and TO are platykurtic. However, the Jarque-Bera statistic revealed that all the variables are normally distributed.
Table 5.4: Descriptive Analysis for Tanzania
lnCPI lnDCPS lnFDI lnGDP lnTO
Mean 6.615634 2.537212 7159.024 32542.66 5.188126 Median 6.277946 2.661222 6324.897 32171.66 5.207453 Maximum 9.013422 3.258116 11154.26 41804.61 5.779466 Minimum 4.657472 1.633075 3555.615 25475.61 4.594805 Std. Dev. 1.322060 0.535132 2488.136 5218.280 0.333723 Skewness 0.451619 -0.437741 0.147469 0.243409 -0.045690 Kurtosis 2.028481 1.710816 1.696212 1.803855 1.995401 Jarque-Bera 1.466406 2.023720 1.489044 1.389796 0.847974 Probability 0.480368 0.363542 0.474961 0.499125 0.654432 Sum 132.3127 50.74425 143180.5 650853.1 103.7625 SumSq. Dev. 33.20903 5.440952 1.18E+08 5.17E+08 2.116056
Observations 20 20 20 20 20
Source: Author‟s computation (2019)
The report of the descriptive analysis in Tanzania showed the result of Skewness of CPI, DCPS, and GDP are positively skewed while FDI and TO are the variables that are negatively skewed. The Kurtosis result revealed that CPI, GDP, DCPS, FDI and TO are platykurtic in nature. More so, the Jarque-Bera statistic revealed that all the variables are normally distributed.
Table 5.5: Descriptive Analysis for Uganda
lnCPI lnDCPS lnFDI lnGDP lnTO
Mean 6.663878 2.682390 5751.756 26333.95 5.052414 Median 6.292935 2.639525 5770.807 25830.95 5.031445 Maximum 8.798849 3.316016 8787.865 33499.93 5.755675 Minimum 5.241923 1.981980 3238.240 20061.34 4.383102 Std. Dev. 1.200300 0.446021 1943.471 4473.871 0.409653 Skewness 0.558413 -0.009671 0.108862 0.151285 0.143210 Kurtosis 1.850758 1.612357 1.435721 1.621854 1.716831 Jarque-Bera 2.140049 1.604938 2.078644 1.659029 1.440465 Probability 0.343000 0.448221 0.353694 0.436261 0.486639 Sum 133.2776 53.64779 115035.1 526679.0 101.0483 Sum Sq. Dev. 27.37367 3.779763 71764481 3.80E+08 3.188490 Observation s 20 20 20 20 20
Source: Author‟s computation (2019)
The report of the descriptive analysis in Uganda showed the result of Skewness of CPI, DCPS, GDP, TO are positively skewed while FDI is the only variable that is negatively skewed. The Kurtosis result revealed that CPI, GDP, DCPS, FDI and TO are platykurtic in nature. More so, the Jarque-Bera statistic revealed that all the variables are normally distributed.
5.3 Augmented Dickey-Fuller
The results of ADF are shown in the table below. Both tests are tested at a 0.05 level of significance. The rejection criteria is that the null hypothesis is rejected if the test value is greater than its respective critical value of 5% alpha level and if otherwise, the null hypothesis is accepted.
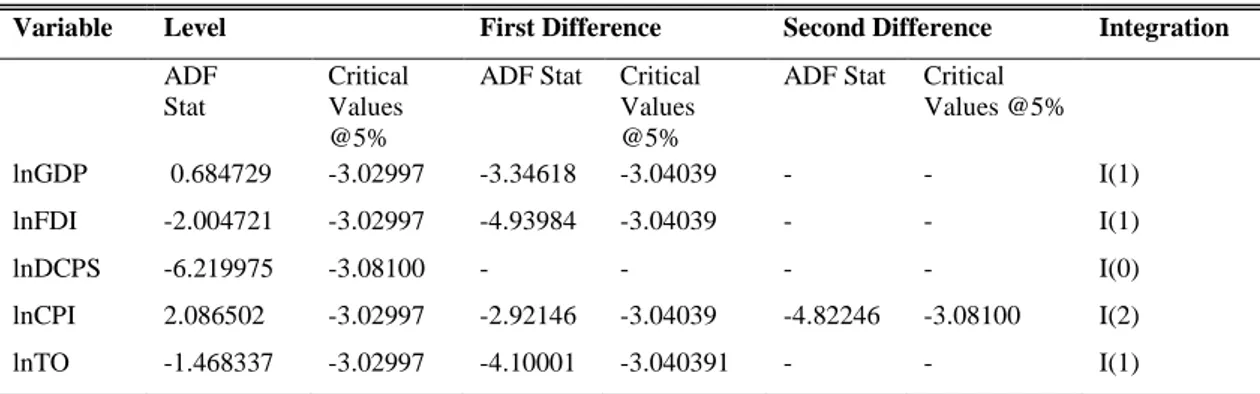
Table 5.6: ADF Tests result for Burundi
Variable Level First Difference Second Difference Integration
ADF
Stat
Critical Values @5%
ADF Stat Critical Values @5%
ADF Stat Critical Values @5% lnGDP 0.684729 -3.02997 -3.34618 -3.04039 - - I(1) lnFDI -2.004721 -3.02997 -4.93984 -3.04039 - - I(1) lnDCPS -6.219975 -3.08100 - - - - I(0) lnCPI 2.086502 -3.02997 -2.92146 -3.04039 -4.82246 -3.08100 I(2) lnTO -1.468337 -3.02997 -4.10001 -3.040391 - - I(1)
Table 5.6 shows that in Burundi, ln GDP and ln FDI, ln TO are stationary at first difference while ln DCPS is atationary at level and ln CPI is stationary at second difference
Table 5.7: Unit Root Break Test for Burundi
Variable Integration Order Break Test Break Period
Unit Root P-Value Date GDP I(1) 0.0436 2005 FDI I(1) 0.01 2014 DCPS I(0) 0.01 2007 CPI I(1) 0.01 2004 TO I(1) 0.01 2011
Source: Author‟s computation (2019)
The result of unit root break test in table 5.7 reveals that, in Burundi D(GDP) was stasitionary at first difference and it experienced a break in 2005, D(FDI) was stationary at first difference and its experienced break in 2014, DCPS was stationary at level and experienced break in 2007, DD(CPI) was stationary at first difference and it experienced break in 2004 and D(TO) was stationary at first level and it experienced break in 2011 respectively.
Table 5.8: ADF Tests result for Kenya
Variable Level First Difference Second Difference Integration
ADF Stat Critical Values @5% ADF Stat Critical Values @5%
ADF Stat Critical Values @5% lnGDP 4.67828 -3.02997 -2.05482 -3.04039 -3.79400 -3.11991 I(2) lnFDI -1.758147 -3.02997 -4.13338 -3.06559 - - I(1) lnDCPS -0.548144 -3.02997 -4.60543 -3.04039 - - I(1) lnCPI 2.933479 -3.02997 -2.66388 -3.04039 -6.40446 -3.06559 I(2) lnTO -1.998628 -3.02997 -3.81342 -3.04039 - - I(1)
Source: Author‟s computation (2019)
Table 5.8 shows that in Kenya ln GDP and ln CPI are stationary at second difference while ln FDI, ln DCPS and ln To are stationary at difference
Table 5.9: Unit Root Break Test for Kenya
Variable Integration Order Break Test Break Period
Unit Root P-Value Date GDP I(I) 0.0436 2009 FDI I(1) 0.0159 2006 DCPS I(0) 0.01 2012 CPI I(1) 0.01 2006 TO I(1) 0.01 2006
Source: Author‟s computation (2019)
In Kenya, the results in table 5.9 shows that DD(GDP) was stasitionary at first difference and it experienced a break in 2009, D(FDI) was stationary at first difference and its experienced break in 2006, D(DCPS) was stationary at level and experienced break in 2012, DD(CPI) was stationary at first difference and it experienced break in 2006 and D(TO) was stationary at first level and it experienced break in 2006 respectively.
Table 5.10: ADF Tests result for Rwanda
Variable Level First Difference Second Difference Integration
ADF Stat Critical Values @5% ADF Stat Critical Values @5% ADF Stat Critical Values @5% lnGDP 5.409226 -3.02997 0.151248 -3.08100 -5.55136 -3.08100 I(2) lnFDI -0.324919 -3.081002 -6.69978 -3.08100 -6.69978 -3.95915 I(2) lnDCPS 0.144364 -3.02997 -3.55248 -3.04039 - - I(1) lnCPI -0.336073 -3.065585 -1.52899 -3.06559 -6.80500 -3.06559 I(2) lnTO 0.939059 -3.02997 -4.09489 -3.04039 - - I(1)
Source: Author‟s computation (2019)
Table 5.10 shows that in Rwanda, ln GDP and ln FDI, ln CPI are stationary at second difference while ln DCPS and ln TO are stationary at first difference