IZMIR KATIP CELEBI UNIVERSITY GRADUATE SCHOOL OF SCIENCE ENGINEERING AND TECHNOLOGY
Ph.D. THESIS
JANUARY 2018
NANOCOMPOSITES WITH GRAPHENE
Thesis Advisor: Assoc. Prof. Dr. M. Özgür SEYDİBEYOĞLU Sibel DEMİROĞLU MUSTAFOV
Department of Nanoscience and Nanotechnology
JANUARY 2018
IZMIR KATIP CELEBI UNIVERSITY GRADUATE SCHOOL OF SCIENCE ENGINEERING AND TECHNOLOGY
NANOCOMPOSITES WITH GRAPHENE
Ph.D. THESIS
Sibel DEMİROĞLU MUSTAFOV (606113003)
Nanobilim ve Nanoteknoloji Anabilim Dalı
OCAK 2018
İZMİR KÂTİP ÇELEBİ ÜNİVERSİTESİ FEN BİLİMLERİ ENSTİTÜSÜ
GRAFEN ESASLI NANOKOMPOZİTLER
DOKTORA TEZİ
Sibel DEMİROĞLU MUSTAFOV (606113003)
iii
Thesis Advisor: Assoc. Prof. M. Özgür SEYDİBEYOĞLU ... İzmir Kâtip Çelebi University
Jury Members: Prof. Dr. M. Mustafa DEMIR ... Izmir Institute of Technology
Assoc. Prof. Dr. Aylin ALBAYRAK ... Dokuz Eylul University
Assist. Prof. Dr. Mustafa EROL
İzmir Kâtip Çelebi University ...
Assist. Prof. Dr. Nesrin HORZUM POLAT ... İzmir Kâtip Çelebi University
Sibel Demiroğlu Mustafov, a Ph.D. student of IKCU Graduate School of Science Engineering and Technology student 606113003, successfully defended the thesis entitled “NANOCOMPOSITES WITH GRAPHENE”, which she prepared after fulfilling the requirements specified in the associated legislations, before the jury whose signatures are below.
Date of Submission : 05 December 2018 Date of Defense : 05 January 2018
v
To my father who taught me the significance of education and supported me even after he passed away
vii FOREWORD
An advisor plays a considerable role in a PhD thesis. No thesis can be finished without guidance, inspiration and surely motivation. I would like to express my heartfelt gratitude to Assoc. Prof. Dr. M. Özgür Seydibeyoğlu who has continuously been by my side giving me his broad knowledge, experience and kind support.
I would like to acknowledge Assist. Prof. Dr. Nesrin Horzum Polat for her mentorship. Her able guidance and opinions had encouraged me to conclude this thesis productively.
I would like to extend my gratitude to Assist. Prof. Dr. Mustafa Erol who helped me by presenting me to different executives and provided time and support for finishing my thesis.
This study has taken its present form also owing to some people who have been particularly supportive and helpful in the completion of this work. I express my honest gratitude to Dr. Amar Mohanty, Prof. Dr. Manju Misra and BDDC team (Guelph University, Canada) for giving me encourage to accomplish my research work. I deeply thank all my friends (Merve Kaplan, Metehan Atagür, Ecem Akın, Tuğba Kılıç, Fatma Erdoğan, Tuğçe Uysalman, Saadet Güler) who took time off to understand my research problem and answer my queries.
Special thanks to my husband Kenan Mustafov who have been so understanding all through the days of my research and thesis writing. This thesis is the result of his enormous support.
I would like to gratefully thank to the İzmir Kâtip Çelebi University Scientific Research Projects Coordinatorship for providing me financial support by BAP-2015-TDR-FEBE-0011 project during my thesis.
I would like to acknowledge to Industrial Thesis Supporting Program (SAN-TEZ) project which was worked with the cooperation of İzmir Kâtip Çelebi University for financial support ensured in the course of this thesis.
ix TABLE OF CONTENTS Page FOREWORD………... ix TABLE OF CONTENTS ... xi ABBREVIATIONS ... xiii SYMBOLS. ... xv
LIST OF TABLES ... xvii
LIST OF FIGURES ...xix
SUMMARY ...xxi
ÖZET... ... xxv
1. INTRODUCTION ...1
1.1 Literature Review ... 1
1.1.1 Nanotechnology and nanomaterials ... 1
1.1.2 Carbon fiber ... 2
1.1.3 Lignin ...4
1.1.4 Electrospinning... 8
1.1.5 Lignin/PAN nanofibers ... 9
1.1.6 Thermal stabilization and Carbonization ...10
1.1.7 Using nanomaterials in lignin-based carbon fibers ...11
1.2 Hypothesis ...12
2. EXPERIMENTAL ... 15
2.1 Materials ...15
2.2 Extraction procedures of lignins from different resources ...15
2.3 Characterization of lignins ...18 2.3.1 SEM ... .18 2.3.2 Contact angle ...18 2.3.3 FTIR...18 2.3.4 TGA ...19 2.3.5 DSC ...19 2.3.6 Elemental analysis ...19 2.3.7 XPS ...19
2.4 Fabrication of PAN, PAN/lignin, and PAN/lignin/graphene nanofibers and characterization of them...19
2.4.1 Solution preparation ...19
2.4.2 Electrospinning of nanofibers ...21
2.4.3 Rheological characterization of electrospinning solutions ...23
2.4.4 Nanofiber characterization ...23
2.4.4.1 Morphological and structural analysis ...23
2.4.4.2 XRD ...24
2.4.4.3 FTIR ...24
2.4.4.4 Electrical conductivity……. ... 24
2.4.4.5 Statistical analysis ...25
2.4.4.6 TGA……….26
2.4.4.7 Atomic force microscopy (AFM)………26
2.5 Thermal Stabilization and Carbonization ...26
2.5.1 SEM of carbon nanofibers ...27
x
2.6 Electrochemical Sensor Analysis………. 27
2.6.1 Preparation of CNF/SPE (Carbon nanofiber modified screen printed electrode) and CNF-G/SPE (Graphene reinforced carbon nanofiber modified screen printed electrode) ………27
2.6.2 Characterization of CNF/SPE and CNF-G/SPE………28
3. RESULTS and DISCUSSION ... 29
3.1 Extraction and Characterization of Lignins ... 29
3.1.1 SEM ... 30
3.1.2 Contact angle ... 31
3.1.3 FTIR of lignins... 32
3.1.4 Elemental analysis of lignins ... 33
3.1.5 TGA of lignins ... 34
3.1.6 DSC of lignins ... 36
3.1.7 XPS of lignins ... 37
3.2 Fabrication and Characterization of Nanofibers ... 40
3.2.1 Effect of polymer concentration and environmental parameters on electrospinning process ... 40
3.2.2 Effect of graphene on electrospinning process ... 46
3.2.3 Experimental design ... 49
3.2.4 Electrical conductivity analysis ... 50
3.2.5 FTIR of nanofibers ... 51
3.2.6 XRD of nanofibers ... 54
3.2.7 TGA of nanofibers………..56
3.2.8 AFM of nanofibers……….58
3.3 Thermal Stabilization and Carbonization ... 58
3.3.1 SEM of carbon nanofibers ... 59
3.3.2 RAMAN of carbon nanofibers ... 64
3.4 Characterization of CNF/SPE and CNF-G/SPE……….66
4. CONCLUSIONS ... 71
5. REFERENCES ... 73
xi ABBREVIATIONS
ABS : Acetate buffer solution
AFM : Atomic force microscopy
-CH2- : Methylene C=O : Carbonyl group -CN : Nitrile groups
CNF : Carbon nanofiber
CNF-G : Graphene reinforced carbon nanofiber CNTs : Carbon nanotubes
CV : Cyclic Voltammetry
DPV : Differential Pulse Voltammetry
DMF : N, N-dimethylformamide
DSC : Differential Scanning Calorimetry EDS : Energy-dispersive X-ray spectroscopy EDTA : Ethylenediamine tetra-acetic acid
EIS : Electrochemical impedance spectroscopy FESEM : Field emission scanning electron microscope FTIR : Fourier Transform Infrared Spectroscopy GRP : Graphene
GRPs : Graphenes
HCl : Hydrochloric acid H2SO4 : Sulfuric acid
K3Fe(CN)6/K4Fe(CN)6 : Potassium ferricyanide
KCl : Potassium chloride
NaCl : Sodium chloride
PAN : Polyacrylonitrile
PBS : Phosphate buffer solution
PEO : Poly (ethylene oxide)
SEM : Scanning Electron Microscope
SPE : Screen-printed electrode
Tg : Glass Transition Temperature TGA : Thermogravimetric Analysis T1 : First degradation temp.
T50% : Temperature for 50% of weight loss XPS : X-ray Photoelectron Spectroscopy XRD : X-ray Diffraction
xiii LIST OF TABLES
Page
Table 1.1: General properties of different types of lignins. ...6
Table 1.2: The costs of CFs from different precursor. ...7
Table 2.1: Numerous concentration of Electrospinning solutions ... 20
Table 2.2: Heating conditions of nanofibers ... 27
Table 3.1: The composition of different lignocellulosic materials ... 29
Table 3.2: Elemental analysis of lignin samples ... 33
Table 3.3: Thermal properties of lignins studied by TGA ... 34
Table 3.4: Glass Transition Temperatures Tg for Different Lignin Samples ... 37
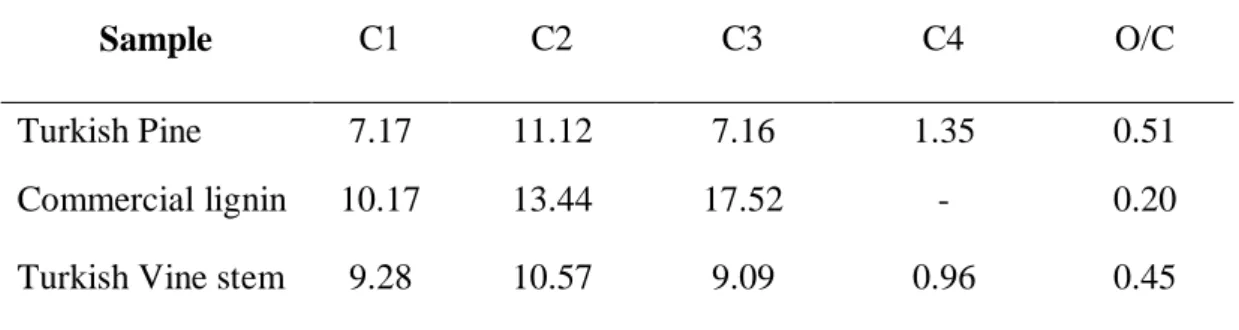
Table 3.5: Elemental composition of the lignin samples as calculated by XPS ... 38
Table 3.6: Experimental design results ... 50
Table 3.7: Conductivity results of nanofibers ... 51
xv LIST OF FIGURES
Page
Figure 1.1: Manufacturing process of carbon fiber from PAN ...3
Figure 1.2: Manufacturing costs of conventional PAN-based CFs ...4
Figure 1.3: Representative schema of A) lignin precursors and B) lignin structure ...5
Figure 2.1: ‘Chinese Textile Industry’ standard method ... 16
Figure 2.2: Schematic diagram of the lignin extraction for Turkish pine ... 17
Figure 2.3: Schematic illustration of the production of with and without graphene-polymer nanofiber by electrospinning. ... 22
Figure 2.4: A) The electrospinning system with dehumidifier/AC, B) Dehumidifier and AC system equipment for electrospinning system. ... 23
Figure 2.5: Electrical conductivity set up consists of A) hollow cylinder and B) Potentiostat/Galvanostat ... 25
Figure 3.1: SEM images of lignin samples from A) Turkish Vine stem, B) commercial lignin, and C) Turkish pine. ... 31
Figure 3.2: Contact angle images of the extracted lignin from a) vine stem b) commercial lignin and c) the extracted lignin from Turkish pine ... 31
Figure 3.3: FTIR spectra of three different lignins ...……….32
Figure 3.4: Thermogravimetric analysis of three different lignins………35
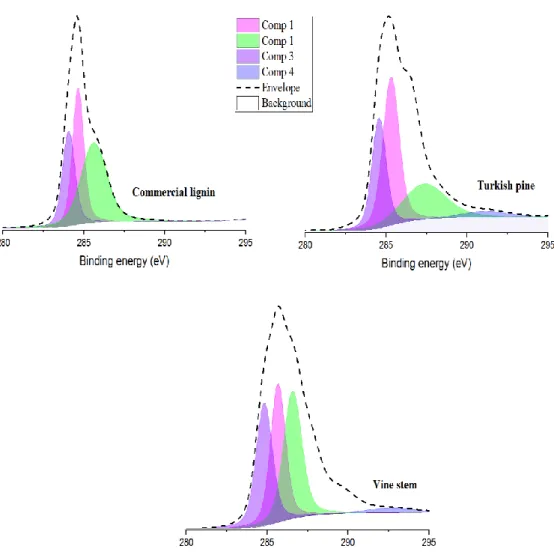
Figure 3.5: High-resolution C 1s spectra of three different types of lignin. The explanation of the components Comp 1–4 is mentioned in the text. …….. ... 39
Figure 3.6: High-resolution O 1s spectra of three different types of lignin. A) O1 peaks, and B) O2 peaks ... 40
Figure 3.7: Viscosity and lignin concentration relationship for the PAN and PAN/Lignin solutions with 10 and 20% wt. of total polymer concentration ... 41
Figure 3.8: SEM images of nanofibers of 10 PAN (left) and 10C1 (right)………... 42
Figure 3.9: SEM images of nanofibers of 10C3 (left) and 10C5 (right). ... 43
Figure 3.10: SEM images of nanofibers of 20PAN (left) and 20C1 (right) ... 44
Figure 3.11: SEM image of nanofibers of 20C3 (left) and 20C5 (right) ... 44
Figure 3.12: PAN/Lignin nanofibers of 20C1 without and with dehumidifier system during electrospinning ... 45
Figure 3.13: SEM image of nanofibers 20C1-1G (left) and 20C3-1G (right) ... 46
Figure 3.14: SEM image of nanofibers 20C5-1G... 47
Figure 3.15: SEM image of nanofibers 20C1-5G (left) and 20C3-5G (right). ... 47
Figure 3.16: SEM image of nanofibers 20C5-5G... 48
Figure 3.17: Shear rate and shear stress relationship for the 20C5 (1% and 5% wt.) solutions. ... 49
Figure 3.18: FTIR multilayer spectra of the PAN nanofiber and PAN/lignin nanofibers with different lignin content. ... 52
xvi
Figure 3.19: FTIR spectra of the PAN/lignin and PAN/Lignin/GRP nanofibers with
different lignin content ... 53
Figure 3.20: XRD spectrum of PAN/Lignin nanofibers at different concentrations. 54 Figure 3.21: XRD pattern of PAN/Lignin nanofibers with and without graphene at several concentrations ... 55
Figure 3.22: TGA analyses of three types of nanofibers………...57
Figure 3.23: AFM analyses of a) PAN/lignin/graphene and b) PAN/lignin of nanofibers………58
Figure 3.24: Sample preparation for thermal processing, (a) lignin powder, (b) electrospun PAN/Lignin nanofibers, (c) horizontal tube furnace (d) placement of carbon nanofibers in the ceramic boat after carbonization, (e) carbonized nanofibers. ... 59
Figure 3.25: 900 0C – 2 0C/min – 1 h, 20C1-1G (left) and 20C3-1G (right). ... 60
Figure 3.26: 900 0C – 2 0C/min – 1 h, 20C5-1G. ... 60
Figure 3.27: 800 0C – 2 0C/min – 2 h, 20C3 (left) and 20C3-5G (right). ... 61
Figure 3.28: EDS of PAN/Lignin nanofibers. ... 62
Figure 3.29: EDS of PAN/Lignin/Graphene carbon nanofibers. ... 62
Figure 3.30: 900 0C – 1 0C/min – 1h -20C1-1G. ... 63
Figure 3.31: Raman spectrum of graphene. ... 64
Figure 3.32: Raman spectra of the carbonized nanofibers at different temperatures. ... 65
Figure 3.33: Nyquist plots of SPE, CNF/SPE and CNF-G/SPE………66
Figure 3.34:Cyclic voltamograms of three screen printed electrodes………… ... 67
Figure 3.35: DPV voltammograms of the acetaminophen for three screen-printed electrodes……….68
xviii
NANOCOMPOSITES WITH GRAPHENE SUMMARY
The carbon fiber used in the manufacturing of advanced composites has various applications in the automotive, aerospace, and electronics industry because of their comprehensive properties such as lightweight, flexibility, high strength to weight ratio, excellent chemical resistance, superior electrical conductivity and thermal conductivity.
Different kinds of carbon fiber precursors have been used and polyacrylonitrile (PAN) is the mostly utilized polymer type which is a petroleum-based, expensive and unsustainable. Remarkably, lignin is a highly accessible, low-cost, and renewable resource. Also, lignin is a byproduct of pulp and paper industry as well as cellulosic ethanol fuel production. So, the reuse of this byproduct is very significant for the bioeconomy. Accordingly, understanding the structure, types, and extraction methods of lignin are of great importance for transferring these biomass residues from a low-value material to a higher low-value product.
This work started with the extracted lignin from Turkish resources (Turkish Pine and Turkish Vine stem) by sulfuric acid treatment and to compare with commercial lignin. Additionally, we investigated lignin to identify its suitability as a carbon fiber precursor and to use for reducing the processing cost of carbon fiber production compared to other precursors.
In this thesis, sub-micron lignin-based nanofibers were produced by electrospinning of solutions obtained by dispersing lignin, polyacrylonitrile (PAN) and then graphene (GRP) in N, N-dimethylformamide (DMF). Lignin-based carbon nanofibers were investigated by focusing on the steps of manufacture. Resource types and corresponding pretreatments improve the processability of spinning and thermal treatments. Defect-free nanofibers with up to 5 wt. % lignin/PAN and 1% graphene were fabricated successfully. The succeeding step is the most significant process of stabilization, where nanofibers are oxidized, crosslinked, and thermally stabilized for the following step. After carbonization, lignin-based carbon nanofibers are obtained. When carbonized at 900 °C, PAN/Lignin/GRP carbon nanofiber presents carbon content of 94.3% and with average diameter ~ 100 nm. Effects of every single step on the lignin-based carbon nanofibers have been discussed comprehensively.
To sum up, the low cost of carbon nanofibers and graphene reinforced carbon nanofibers can be used in numerous fields, mainly for electronic devices containing biosensors and supercapacitors. In this thesis, the characterization of carbon nanofiber (CNF) and graphene reinforced carbon nanofiber (CNF-G) modification onto the screen printed electrode (SPE) has been verified via Electrochemical Impedance Spectroscopy (EIS) and Cyclic Voltammetry (CV). The charge transfer resistance, Rct values obtained by electrochemical circle fit option of EIS have been utilized for
xix
conductivity detection of modified electrodes. In the last part of this thesis, CNF and CNF-G modified electrodes were performed for an effective biosensor to detect acetaminophen.
xx
GRAFEN ESASLI NANOKOMPOZİTLER ÖZET
İleri kompozitlerin üretiminde kullanılan karbon elyaf, hafiflik, esneklik, ağırlık oranına karşın yüksek mukavemet, yüksek kimyasal direnç, üstün elektrik ve ısı iletkenliği gibi özelliklerinden ötürü otomotiv, havacılık ve elektronik sektöründe çeşitli uygulamalara sahiptir.
Farklı karbon elyaf hammaddelerinden en çok kullanılan ise petrol esaslı, pahalı ve sürdürülemez olan poliakrilonitril (PAN) dir. Dikkat çekici bir şekilde, lignin erişilebilir, düşük maliyetli ve yenilenebilir bir kaynaktır. Ayrıca, lignin selülozik etanol yakıt üretiminin yanı sıra hamur ve kâğıt sanayiinin bir yan ürünüdür. Dolayısıyla, bu yanürün yeniden kullanımı biyo-ekonomi için çok önemlidir. Ligninin yapısını, tiplerini ve ekstraksiyon yöntemlerini anlamak, bu biyolojik atığı düşük değerli bir materyalden yüksek değerli bir ürüne dönüştürmek büyük önem taşır. Bu çalışma, sülfürik asit ile Türkiye’deki bitki kaynaklarından (kızılçam ve asma kökü) ligninin elde edilmesi ve ticari lignin ile karşılaştırılmasıyla başlamıştır. Ek olarak da, ligninin diğer öncü malzemelerle kıyaslayarak üretim maliyetini düşürmek için karbon elyaf öncü malzemesi olarak uygunluğunu belirlemek için araştırma yapılmıştır.
Bu tezde, mikron altı lignin esaslı nanoelyaf, lignin, poliakrilonitril (PAN) ve daha sonra grafenin (GRP) N, N-dimetilformamid (DMF) içinde disperse edilmesiyle elde edilen çözeltilerin elektroeğirmesiyle üretilmiştir. Lignin esaslı karbon nanoelyaf, üretim aşamalarına odaklanarak araştırılmıştır. Kaynak türleri ve bunlara karşılık gelen ön işlemler, eğirme ve ısıl işlemlerin işlenebilirliğini geliştirmektedir. Ağırlıkça % 5 lignin/PAN oranında ve % 1 grafene sahip olan düzgün nanoelyaf başarıyla üretilmiştir. Sonraki adım, nanoelyafın oksitlendiği, çapraz bağlandığı ve bir sonraki adım için termal olarak stabilize edildiği en önemli adım olan termal stabilizasyon sürecidir. Karbonlaşmadan sonra, lignin esaslı karbon nanoelyaf elde edilir. 900 0C'de
karbonize edildiğinde, PAN / Lignin / Grafen karbon nanoelyaf, % 94.3'lük bir karbon içeriğine sahiptir ve ortalama çapı ~ 100 nm'dir. Lignin bazlı karbon nanoelyafı etkileyebilecek her bir basamak kapsamlı olarak ele alınmıştır.
Sonuç olarak, düşük maliyetli karbon nanoelyaf ve grafen takviyeli karbon nanoelyaf, biyolojik sensörler ve süperkapasitörleri içeren başta elektronik cihazlar olmak üzere birçok alanda kullanılabilirler. Bu tezde, karbon nanoelyaf (CNF) ve grafen esaslı karbon nanoelyaf (CNF-G)’ın perde baskılı elektrot (SPE) üzerine modifikasyonu, Elektrokimyasal Empedans Spektroskopisi (EIS) ve Döngüsel Voltametri (CV) ile doğrulanmıştır. Modifiye elektrotların iletkenlik tespiti için, EIS'in elektrokimyasal daire uyumu seçeneği ile elde edilen yük transfer direnci, Rct değerleri kullanılmıştır. Bu tezin son bölümünde, asetaminofen tespit etmek için etkili bir biyosensör olarak CNF ve CNF-G modifiye elektrotlar kullanılmıştır.
1 1. INTRODUCTION
1.1 Literature Review
1.1.1 Nanotechnology and nanomaterials
Nanotechnology concerns to the science and technology regarding structures and materials which as a minimum one of the sizes is l00 nm or lower. Over several decades, researchers have improved instruments and techniques that assist better comprehension the significant prospects of the universe [1, 2]. Nanotechnology contains manipulating materials in nanometer range to get the advantage of their unique properties and to develop products in several industrial sectors such as biotechnology, defense, aerospace, and electronics [3, 4]. Furthermore, these nanomaterials with high surface-to-volume ratio can be utilized in drug delivery, composites, and energy storage [5].
While the scientists have to some degree agreed to the <100 nm standard for describing as a nanomaterial, the people worked in the industrial sector has accepted the dimension ranges from 300 nm up to 500 nm. However, the scope of the nanotechnology is wide and affects many various industrial sectors, an understanding of the related materials and methods is vital to make sure responsible industry improvement in some respects that both advances economic development and preserve the environment [6].
Nanomaterials, are an essential subclass of nanotechnology, have numerous specific characteristics such as incomparable chemical and physical properties. For example, melting of crystals in the nanoscale happens a lower temperature than that at the bulk. Thus, scholars produce valuable materials and instruments by ensuring of substance in the nanoscale and research new properties and phenomena acquired at that size [7]. Nanomaterials can be classified as zero dimension (i.e. nanoparticles), one dimension (i.e. nanotubes), two dimensions (i.e. nanoplatelets), or three dimensions (i.e.
2
particles). Besides, common kinds of nanomaterials contain quantum dots, nanotubes, nanowires, and fullerenes.
Decades of research have been performed on several novel nanomaterials. Carbon-based nanomaterials consist of fullerenes, carbon black, and carbon nanotubes (CNTs). Adding small amounts of nanomaterials such as carbon nanotubes may significantly develop functional properties of composites like their electrical conductivity. On the other hand, the addition of nanomaterials was informed to increase the productivity of numerous analytical techniques [6, 8].
1.1.2 Carbon fiber
Carbon fibers are carbon materials which consist of carbon allotrope or polymeric precursors with tremendous mechanical performance and electrical conductivity properties. They are made of a process that contains the preparation of precursor solutions, spinning (wet spinning, electrospinning etc.), thermal stabilization, carbonization, and then added of graphitization in some applications [9, 10].
Presently, more than 90 % of the commercial carbon fibers are manufactured from polyacrylonitrile (PAN), pitch and rayon. Figure 1.1 shows the manufacturing process of carbon fiber by using PAN [11]. The rate of growth in the carbon fiber-developed industry is too low to satisfy the fast arising requirement, largely as the primary precursor for carbon fibers, PAN, is costly and as a fossil fuel derivate not sustainable [10, 12]. That’s why the high price of them limit their consumption for profitable applications such as aerospace and automotive although the commercial demand of carbon fibers increases continuously.
In carbon fiber generation, the issue part is spinning of the precursor material. Electrospinning has been utilized as a straightforward innovation to develop consistent submicron diameter fibers (termed as carbon nanofibers) from an extensive variety of materials. Arranged or adjusted fiber mats can be improved at random by this technique [13]. The developing technique of electrospinning provides a way to make continuous carbon fibers at sub-micrometer scale (typically 100–1000 nm), called carbon nanofibers [14].
3
Figure 1.1: Manufacturing process of carbon fiber from PAN [11].
Carbon nanofibers were developed by means of nanofibers from the pitch and from polyacrylonitrile (PAN) with diameters of submicron and few hundreds of nanometer [15, 16]. PAN, is a petroleum-based polymer, is in need of a very slow heating process for carbonization which prolongs the processing time [13, 17]. Furthermore, the PAN is the largest part of the total manufacturing cost (Figure 1.2) [18].
4
Figure 1.2: Manufacturing costs of conventional PAN-based CFs [18].
Currently, ecological contamination and a petroleum derivative substances deficiency influence the advancement of the world economy and environment. These reasons are due to the motivations us to seek replacements such as a low-cost, earth-abundant and eco-friendly materials [19]. As of late, an extensive variety of renewable resource-based materials have been researched for the generation of carbon materials [4]. To replace the fossil-based precursors utilized for carbon fiber fabrication like polyacrylonitrile (PAN), lignin has been thought as a bio-based and cheaper alternate raw material [20-23].
1.1.3 Lignin
Lignin, is basically a by-product of biorefinery process, has been investigated as a precursor for bio-derived carbon fibers from the 1960s [24, 25]. The great quantity of aromatic components in the molecular configuration of lignin comes through an effective prospect for a carbon fiber precursor [23]. Lignin has a very complex three-dimensional structure because of the random polymerization of phenylpropane monomers and significant C-C links are b-5, 5-5, b-1, and b-b linkages, and C-O linkages are a-O-4, b-O-4, and 4-O-5 [26, 27]. Lignin consists of peroxidase-mediated
5
dehydrogenation of three types of phenylpropane monomer units and linked by carbon-carbon and aryl-ether linkages with random cross-linked polymerization from radical-coupling reactions between phenolic radicals [28-31] (Figure 1.3).
Figure 1.3: Representative schema of A) lignin precursors and B) lignin structure [31]. Not only chemical and physical properties but also the low cost and renewability of lignin have made it excellent precursor material for numerous applications. Lignin is utilized to make surfactants, emulsifiers, binder, paints, and polymeric materials [32-35]. However, there are some complications in conversion lignin to carbon fibers. One of them is its immense classification resulting from plant sources and extracting methods. There is a variety of lignin source present including pine straw, hemp, fiber flax, and wood pulp. Hence, their physical and chemical behavior is different with respect to the original source. Also, the chemical structure of lignin can be changed depending on extraction method.
Numerous processes have been developed over the course of many years to extract lignin such as kraft lignin, lignosulfonates, and organosolv lignins, which modify
6
chemical structure and facilitates based on the extraction circumstances. Although Kraft process is commercially common, the amount of extracted kraft lignin is very low [36]. A few different strategies for lignin processing also have vital applications in the potential of renewable fuel uses. While organosolv pulps are to some degree reduce the quality of Kraft pulps, modifications can enhance organosolv pulp facilities [37]. That’s why, organosolv pulping has taken significant attention because of its potential use in the generation of biofuel such as biodiesel, cellulosic ethanol [38-40]. Table 1 indicated that the general properties such as molecular weight or Tg of lignins
based on the source of biomass and processing circumstances [41, 42]. In any case, the high cost of the solvents when compared with Kraft lignin prevented those procedures to excite industrially appealing for pulp development.
Nonetheless, a few of them have found a restored enthusiasm for the most recent couple of years, essentially on the premise of second generation biorefineries, going for delivering fuels as well as chemicals from lignocellulosic biomass. Since original biorefineries, for the most part, centered around starch for the creation of bioethanol, the opposition with human nutrient has driven the exploration and industry to rather concentrate on non-sustenance lignocellulosic residues.
Table 1.1: General properties of different types of lignins [41,42]. Types of lignin Molecular
weight, Mw (g/mol)
Sulfur (%)
Chemicals used for lignin isolation
Tg (0C)
Kraft lignin 1000 – 3000 1-3 NaOH and Na2S 140-150
Organosolv lignin
500 – 5000 0 acetic acid/formic acid, ethanol and water
90-110
Soda lignin 800 – 3000 0 Soda-anthraquinone, NaOH
140
Lignosulfonate lignin
15000-50000 4-6 HSO3- 130
Another difficulty is that its complex and disordered structure, as well as impurities in the final product, can affect low the thermal behavior and mechanical properties of carbon fibers. Especially, the thermal behavior is of vital importance when compared
7
with the mechanical properties of lignin. For instance, the glass transition temperature (Tg) plays a role in melt spinning and carbonization process.
Considering all the difficulties mentioned before, lignins have their advantages. It is clear that lignin has a cost advantage for the production of carbon fibers. As the aromatic structure of lignin (Figure 1.3) is similar to the structure in PAN-based carbon fibers (Figure 1.1). They can produce by means of same methods. Additionally, the thermoplastic character of lignin lets to fabricate precursor fibers through melt-spinning. To sum up, several investigators have entered the lignin research area to drive by the aim of lowering the cost of carbon fibers in the past many decades. Table 1.1 showed that the differences in cost for carbon fiber production depend on several precursors.
Table 1.2: The costs of CFs from different precursor [18, 43, 44]. Precursor Precursor Cost
(USD$ kg-1)
Production Cost (USD$ kg-1)
Total Cost (USD$ kg-1)
Textile Grade PAN 4.4-13.2 12.2-25.4 16.6-38.6
Conventional PAN 10.2 24.4 34.6
Melt-spun PAN 6.3 17.4 23.7
Polyolefin 1.57-2.36 - -
Lignin 1.1 (cover spinning) 5.2 6.3
As said by the literature, more than a few low-cost precursors have been stated to be effectively fabricated to carbon fibers [43]. The lignin-based carbon fiber was shown to be produced by Otani et al in early studies. Carbon fibers have however low modulus and low tensile due to micro voids [45]. The Oak Ridge National Laboratory (ORNL) in the United States developed lignin-based carbon fibers which have the average strength of 1.07 GPa and Young's modulus of 82.7 GPa. Nevertheless, the tensile strength of lignin carbon fibers is low compared to commercial PAN-based carbon fiber (3-7 GPa) [17, 46]. Such strength of carbon fibers can be improved by reducing the carbon fiber diameter. Much as there are a few serving difficulties in developing fibers of lignin, a few investigators get combined lignin with another
8
polymer to ease the fiber production method. Numerous ways of spinning, containing wet spinning, melt spinning, and electrospinning, have been explored to develop carbon fibers based on lignin/polymer [17, 23, 24, 47]. However, the product carbon fibers fabricated by melt spinning are moderately weak in comparison with those obtained from petroleum-based precursors [30].
Especially, utilizing PAN for an additive in electrospinning would, in theory, improve the mechanical functioning of lignin-based CFs (carbon fibers) since PAN is already called the most in effect precursor to develop CFs with high carbon yield and superior attributes [49]. Furthermore, after electrospinning method, the electrospun mats display high porosity and precise surface area, which cause them properly as the manufacture of superior materials such as sensors, medical materials, conductive materials [50, 51].
Nevertheless, it is hard to acquire continuous smooth fibers during electrospinning process as a result of its low molecular weight and chain entanglements. Developing the network of chain entanglements could be supplied for electrospinning progress by blending of lignin with another polymer which has high molecular weight [13, 17, 28]. In this way, the nanofibers of kraft, alkali kraft, and organosolv lignin could be fabricated after blending with numerous polymers such as polyvinyl alcohol (PVA) [52, 53], polyethylene oxide (PEO) [47, 54], polyhydroxybutyrate [55], PAN [51, 56-59], and polypropylene [60].
1.1.4 Electrospinning
Electrospinning states to a method of manufacturing fibers via electrostatic forces to method materials into fibers from blends or solutions and a comparatively low-cost process for fabrication of continuous fibers. The main setup for electrospinning consists of three basic parts: a high voltage power supply, a needle (spinneret), and a conductive collector. The needle is connected to a syringe to which the polymer blends are fed and is located on the top or beside of a collector which is the conductive plane. The conductive collector located at a constant distance from the needle, and a power supply which is used to exert a potential among the needle and collector [46, 61].
9
Applied to an electric field developed by means of high voltage, the droplet of polymer solution/blend at the tip of the needle is formed into a conical object, generally known as Taylor cone. Once the electrostatic force gets over the surface tension of the drop, a charged jet of solution throws out of the tip of the Taylor cone, and the electrospinning begins. So, the jet carries out an elongating and whipping technique shaping a thin and loop-shaped fiber [62]. Owing to the elongation and solvent evaporation, diameters of the fibers can be significantly diminished from micrometers to nanometers during the short period of time. The randomly oriented microfiber/ nanofiber is deposited onto the plate collector or the rotating drum collector [63]. Depends on the electrospinning parameters, the morphology and diameter of the electrospun fiber can be changed. On the other hand, the fiber morphology based on processing parameters which contain: (a) solution properties such as viscosity, surface tension, electrical conductivity; b) operational conditions such as solution flow rate, the distance between needle and collector, applied an electric field, and ambient factors such as humidity and temperature. The importance of numerous parameters on the electrospinning technique has been examined in more than a few studies [64-69]. 1.1.5 Lignin/PAN nanofibers
Blends of lignin with PAN as nanofiber precursors have been informed before. Basically dissolving PAN and lignin into blends with a consequent wet-spinning was possible to shape chemical crosslinking among two compounds [70]. These interactions were accomplished by other particular methods such as electrospinning and melt spinning.
Seo et al. reported the fabrication of PAN/lignin alkali nanofibers mats with the electrospinning technique. They cured the electrospun PAN/lignin nanofibers mats by E-beam irradiation. Although they produced PAN/lignin nanofiber of 300 nm diameter, the lignin content was 50 wt. % for better spinnability [57].
Liu et al. reported a work, in which carbon fibers were fabricated by gel-spinning the soda lignin/PAN blend. With this work, the interaction between PAN and lignin was given by the N-O bonds between two polymers. As indicated by Liu et al., with the expansion of lignin content, the activation energy of crosslinking responses was
10
diminished and mechanical properties of carbon fibers were improved, but the integration of lignins might give rise to imperfect structures of carbon fibers [72]. Dong et al. informed the PAN/lignin sulfonate (PAN/LS) fibers with the wet spinning process. The PAN contents altered from 0 to 100 wt. %. However, they reported the PAN/lignin fibers by wet spinning weren’t obtained the chemical crosslinking between PAN and LS [57]. Bissett et al. reported two patents related to the method of manufacturing carbon fibers from lignin and PAN. They indicated that the blends were prepared by dissolving the polymers in which the lignin fractions provide 10 to 45% of the total polymer weight. The PAN/lignin-having dopes were wet-spun after thermal stabilized and carbonized into carbon fibers through tensile strengths of 0.552 to 2.758 GPa [72, 73].
In another PAN/lignin nanofiber study, hardwood organosolv lignin was used with PAN as a precursor for producing carbon nanofibers. Yet, the organosolv lignin is relatively expensive in comparison with other processes for obtaining lignin since a large amount of organic solvent is used to remove impurities [56, 74].
1.1.6 Thermal stabilization and Carbonization
On the way to achievement materials with high carbon content, precursor fibers are subjected to thermal stabilization and carbonization. In the course of the stabilization process, precursor fibers are regularly heated to 200 - 300 0C in air. The main purpose of stabilization is to crosslink and prepares lignin structure that can prevent fiber melting during carbonization process at higher temperatures such as 900 or 1100 0C. According to several groups which worked on the thermal stabilization of lignins, in the start of a process, hemolysis of C-O and C-C bonds, hydrogen abstraction, and reorganization take place as formaldehyde and then water are vaporized. The mechanism of leaving formaldehyde can happen the ways which are excited by hemolysis of C-O bonds or by hydrogen separation. By means of air in this process, oxygen may induce other readjustments and oxidizes lignin configurations [75, 76]. After the thermal stabilization, the stabilized fibers with the capability to tolerate high temperature are carbonized at 800-1200 0C in a stream of nitrogen or argon. During the carbonization process of lignin fiber, while the possible degradation products are
11
carbon monoxide, carbon dioxide, water vapor and maybe methane, the amounts of hydrogen and oxygen reduction. After carbonization process, the carbon content is likely excess of 92 % and this value can be increased based on carbonization temperature [77, 78, 79]. Because of the high temperature in the course of carbonization, the chemical structures of lignins alter considerably. The structure of carbonized fibers was commonly displayed through Raman spectra. In RAMAN, when the carbonization temperature enhances, the R-value (demonstrating the degree of disorder) reduced. Furthermore, fiber diameters diminished after carbonization [78, 80].
1.1.7 Using nanomaterials in lignin-based carbon fibers
The electrochemical functioning of the polymer-based carbon fibers could be increased along comprising the nanomaterials such as carbon nanotubes [59], graphene [81] or graphene oxide [82] in order to enhance mechanical and electrical properties. For instance, lignin-based carbon nanofibers reinforced with CNTs were fabricated by gel spinning. Interestingly, the tensile strength of these carbon nanofibers was 1.72 GPa with the adding of CNTs, while they improved the ordered size of carbon nanofibers [71].
There are also several studies using nanomaterials except for carbon nanotubes, graphene or graphene oxide to improve lignin-based carbon fibers. Novel lignin-based nanofibers decorated with monometallic and bimetallic nanoparticles, including Pt, Au, Pd, and their bimetallic conjugates were synthesized by Gao et al. The metallic nanoparticle deposited lignin-based nanofibers were then carbonized into lignin-based carbon nanofibers. This study indicated that the Pd nanoparticle immobilized lignin-based nanofibers and carbon nanofibers displayed catalytic activity concerning the NaBH4 reduction of p-nitrophenol [83].
Particularly, graphene, an individual layer of aromatic carbon, has one of the powerful in-plane bonds among whole materials, in addition to as greater electrical and thermal conductivity.
12
Graphene, is the sp2 hybridized forms of carbon, is considered to be the thinnest material-one atom thick. In spite of being the thinnest material identified to be present, graphene sheets also are independently very strong [84].
A single 2D sheet of graphene is a hexagonal structure with each atom modeling three bonds through each of its closest neighbors. These are called the σ bonds arranged towards these neighboring atoms and composed of three of the valence electrons. These covalent carbon-carbon bonds are almost equivalent to the bonds holding diamond along giving graphene similar thermal and mechanical properties like the diamond.
Graphene sheets can be arranged and functionalized to provide various sorts of graphene-based nanoscale materials. Due to having different structures, spectroscopic techniques such as Raman, Scanning Electron Microscope (SEM), and X-ray Photoelectron Spectroscopy (XPS) are being used to detect the surface and chemical properties of graphene.
To sum up, the cost advantages and performance of graphene are greater than carbon nanotubes in sensors, nanocomposites, and energy storage devices although carbon nanotubes have structural flexibility [85]. Thus, graphene reinforced-lignin based nanofibers are promising candidates as efficient biosensor materials for the increase of electrical conductivity in nanofibers.
1.2 Hypothesis
The main hypotheses of this work are:
Extracted lignins from different Turkish resources and compared with commercial lignin which has distinct thermal properties and chemical properties.
Lignin has the potential to obtain nanofibers through electrospinning technique if it can be solubilized in proper polymer and organic solvents such as dimethylformamide. The cost advantages of lignin challenge CNFs in nanocomposites sensors, tissue scaffolds, energy transformation, and storage device applications.
13
Graphene filled-lignin based nanofibers are promising candidates as efficient biosensor materials for the increase of electrical conductivity in nanofibers. The selection of suitable thermal conditions for carbonization of lignin
nanofibers with and without graphene helps to transform them into carbon nanofibers.
The modified electrodes with lignin-based carbon nanofibers and graphene filled-lignin based carbon nanofibers are using in the biosensor to detect biomolecules.
15 2. EXPERIMENTAL
This study has three main parts. The first part is the extraction and comparison of extracted lignins with commercial lignin. The second part is the fabrication of PAN/Lignin and PAN/Lignin/Graphene nanofibers. The last part is the thermal stabilization and carbonization of these nanofibers for obtaining the electrode materials.
2.1 Materials
Protobind 2400 lignin was obtained from ALM Private Limited, Punjab, India. Biomass resources for Turkish pine and Turkish vine stem were collected from local fields near the Aegean region, Turkey. Chemicals used for extraction of lignin such as EDTA (Ethylenediamine tetra-acetic acid), acetone, alcohol ethanol, HCl (hydrochloric acid), and H2SO4 (sulfuric acid) were obtained from Sigma–Aldrich
Inc., USA. Polyacrylonitrile (80 000 g/mol) was received from Dow Aksa Pvt. Ltd (Turkey), and graphene (GRP) with an average thickness of 12 nm were purchased from Graphene Supermarket. N, N-dimethylformamide (DMF) was obtained from Sigma-Aldrich Co. and used as the solvent for the electrospinning. Screen printed electrode (SPE) was obtained DropSens, S. L., Spain. 5 mM of potassium ferricyanide (K3Fe(CN)6/K4Fe(CN)6) with 0.1 M KCl (Potassium chloride), Acetaminophen,
Acetate buffer solution (ABS) (pH: 4.80) containing 20 mM NaCl (Sodium chloride), 20 mM phosphate buffer solution (PBS, pH: 7.4) were prepared by dissolving chemicals purchased from Merck (Germany). Also, ethanol was obtained from Sigma– Aldrich Inc., USA, and de-ionized water were used for preparing solutions.
2.2 Extraction procedures of lignins from different resources
The process of lignin extraction from different biomass resources was carried out through "Chinese Textile Industry" standard method [86]. Herein, experimental process was explained for Turkish pine but afterward, the same method was used to extract lignin from Turkish vine stem. This standard process is shown in Figure 2.1.
16
Figure 2.1: ‘Chinese Textile Industry’ standard method [86].
Extraction process started first by pulping, where the biomass was cut and grind into small pieces in a blade mill to around 200 meshes and the powder was placed in the 70 0C oven, drying to constant weight (W0). The dried powder was washed with 70 %
alcohol and added EDTA solution to extract the pectin from biomass, filtered via sintered glass crucible and washed after drying to constant weight (W1). Using acetone to wash the residue (W1) and dried. Later, it was added hydrochloric acid to hydrolyze and then filtered to separate hemicellulose from the mixture, washed and dried to constant weight (W2). The residue (W2) was washed with acetone, dried, treated with
17
sulfuric acid, afterward filtered mixture, washed with distilled water to remove residual lignin and dried to constant weight (W3) (see Figure 2.2)
Figure 2.2: Schematic diagram of the lignin extraction for Turkish pine. The ratios of the cellulose, hemicellulose, lignin, and pectin content were calculated by the equation 1-4 [87].
𝑃𝑒𝑐𝑡𝑖𝑛 (%) =W0−W1
W0 𝑋100 (1)
𝐻𝑒𝑚𝑖𝑐𝑒𝑙𝑙𝑢𝑙𝑜𝑠𝑒 (%) =W1−W2
18 𝐿𝑖𝑔𝑛𝑖𝑛 (%) = W3 W0𝑋 100 (3) 𝐶𝑒𝑙𝑙𝑢𝑙𝑜𝑠𝑒 (%) =W2−W3 W0 𝑋100 (4) 2.3 Characterization of lignins
The structural, chemical and thermal characterization of lignins were examined by Scanning electron microscopy (SEM), Fourier transform infrared spectroscopy (FTIR), Water Contact Angle measurements, Thermogravimetric analysis (TGA), Elemental analysis CHNS, X-ray Photoelectron Spectroscopy(XPS) and Differential scanning calorimetry (DSC).
2.3.1 SEM
SEM images were recorded by Phenom proX desktop scanning electron microscope using gold-coated samples and were analyzed the surface structure of lignins.
2.3.2 Contact angle
Contact angle measurements were carried out using an easy drop instrument (ThetaLite101, Biolin Scientific). A water drop (~3 µl) was added to each sample surface using a Hamilton syringe at room temperature and obtained the changes in hydrophobicity of the surfaces.
2.3.3 FTIR
The FTIR measurements of extracted lignin patterns are taken using Thermo Scientific Nicolet 6700 equipped with an ATR mode. The FTIR spectra were noted in the wavenumber range of 4000 to 400 cm−1 in the absorbance mode. The materials were observed with a resolution of 4 cm−1 and each sample was recorded 64 scans.
2.3.4 TGA
Thermogravimetric analysis (TGA) was utilized to detect the thermal stability, decomposition temperature for each lignin. TGA analyses were measured using TA Instruments Q500 setup operating under nitrogen. Samples on a platinum pan for each measurement were maintained at ˷5 mg, and scans were applied from 25 to 800 0C at
19
10 0C/min. TGA was replicated three times, and the results of the analysis were reproducible.
2.3.5 DSC
Thermal properties of lignins were assigned with Differential Scanning Calorimetry (TA Instruments Q200) with 3,0 ± 0.50 mg of lignin samples were put in a hermetic pan and heated from 0 to 200 0C at 10 0C/min in the nitrogen environment. Lignin
samples were run in triplicate and the average deviation was defined. The glass transition temperature (Tg) of lignin-based on its resource and extraction method [88].
Consequently, three different lignins were applied to calculate Tg and to understand
the effect of temperature and time on the DSC results. The average moisture amount of lignin samples was measured before the experiments and was kept nearly amount for all of the lignin samples (Denver Instrument–IR 35 moisture analyzer).
2.3.6 Elemental analysis
The weight percentage of elements CHNS was obtained from an elemental analyzer (Thermo Scientific FLASH 2000 CHNS/O analyzer). Each sample of lignin was measured in three times by Elemental analyzer.
2.3.7 XPS
The composition of chemical elements on lignin has been examined by X-ray photoelectron spectroscopy. XPS measurements were performed with a Thermo Scientific K-Alpha electron spectrometer using a monochromated Al Kα X-ray source
run at 100 W.
2.4 Fabrication and characterization of PAN, PAN/lignin, and PAN/lignin/graphene nanofibers
2.4.1 Solution preparation
Three types of solutions (PAN, PAN/lignin, and PAN/lignin/GRP) were made ready for electrospinning process. Solutions of nanofibers with numerous concentrations (Experimental Design parts) were prepared by magnetic stirring at room temperature. Earliest experiments on electrospinnability of lignin/PAN in DMF solutions with different polymer concentrations ranging from 12 to 25 wt. % displayed that solutions
20
with the concentration of polymer play a significant role in the electrospinning parameters based on the viscosity of solutions [51, 56].
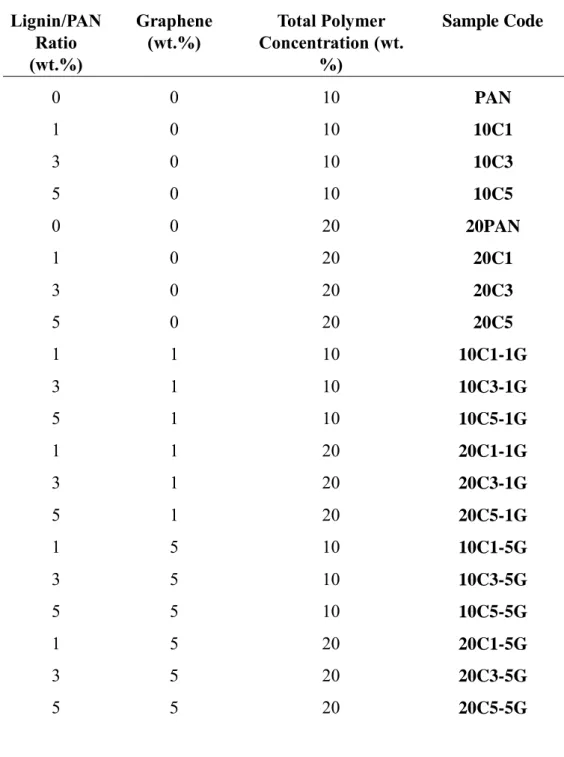
In this work, the certain amounts of lignin and PAN were weighed. Table 2.1 shows numerous concentrations of electrospinning solutions and their sample codes.
Table 2.1: Numerous concentrations of electrospinning solutions. Lignin/PAN Ratio (wt.%) Graphene (wt.%) Total Polymer Concentration (wt. %) Sample Code 0 0 10 PAN 1 0 10 10C1 3 0 10 10C3 5 0 10 10C5 0 0 20 20PAN 1 0 20 20C1 3 0 20 20C3 5 0 20 20C5 1 1 10 10C1-1G 3 1 10 10C3-1G 5 1 10 10C5-1G 1 1 20 20C1-1G 3 1 20 20C3-1G 5 1 20 20C5-1G 1 5 10 10C1-5G 3 5 10 10C3-5G 5 5 10 10C5-5G 1 5 20 20C1-5G 3 5 20 20C3-5G 5 5 20 20C5-5G
21
The powders were mixed by using a stirrer and the weight ratio of PAN to lignin in the solutions were 1:1, 1:3, and 1:5, respectively. The appropriate volume of Dimethylformamide (DMF) was added to the mixed powders to obtain the preferred total polymer concentration of 10 % and 20 wt./v %. The concentration of 10 and 20 wt.% was chosen to prepare PAN/lignin solutions throughout the electrospinning experiments to find a suitable concentration of PAN/lignin.
To prepare for the PAN/lignin/GRP solutions, the concentrations ranging from 1 to 5 wt. % of GRP were added separately to the PAN/lignin solutions. After adding of GRPs, GRPs were dissolved in PAN/lignin solutions under 30 min of sonication (Hielscher Ultrasonics) and then mixed by using a magnetic stirrer until homogeneous. 2.4.2 Electrospinning of nanofibers
The electrospun mats were produced in a NANON-01A (MECC Co. Ltd. Japan) in which electrospinning setup has a vertical orientation. A 10 ml plastic syringe (22-gauge needle) was used. The collector was covered with an aluminum foil in the course of the process.
The distance was 22 cm between the needle and the collector. A working voltage of 24 kV and a flow rate of 0.3 mL/h (by way of a computer-controlled syringe pump) were used in all electrospinning experiments (Figure 2.3). The electrospinning experiments were completed at 25–30 0C and the humidity was constant during the experiments (35–45%).
22
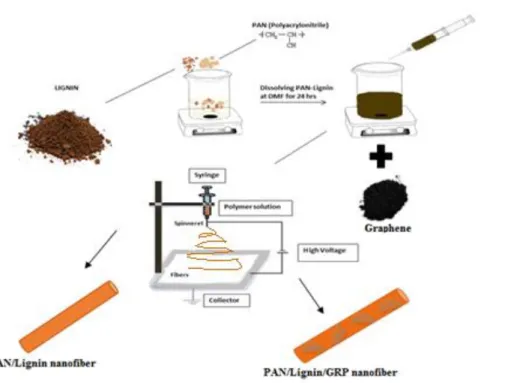
Figure 2.3: Schematic illustration of the production of with and without graphene-polymer nanofiber by electrospinning.
A wide variety of parameters impact the electrospinning process. Apart from processing parameters such as voltage, flow rate and ambient parameters such as humidity, temperature can play an important role in defining the electrospinnability of the environment. For this reason, this system used to reduce humidity and temperature in the electrospinning set up (NANON-01A).
23
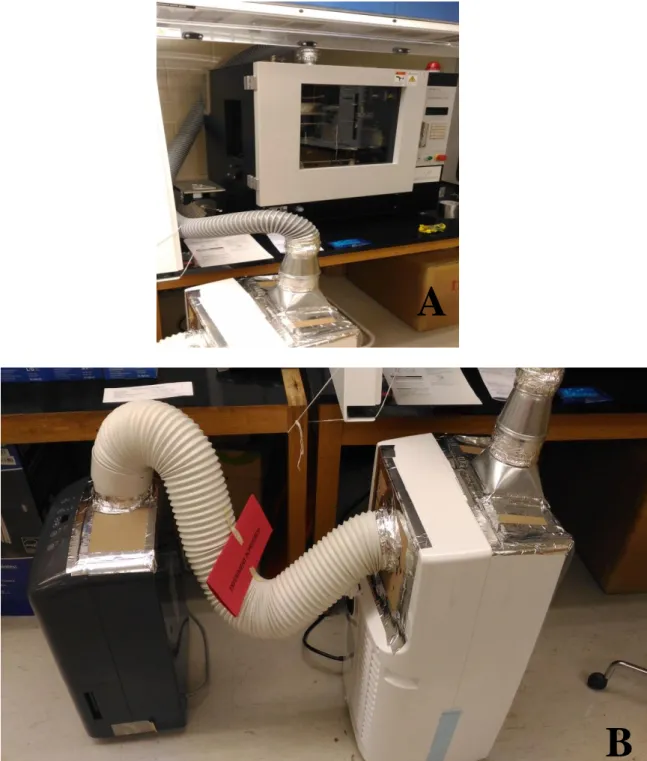
Figure 2.4: A) The electrospinning system with dehumidifier/AC, B) Dehumidifier and AC system equipment for electrospinning system
When the temperature and humidity increased inside the electrospinning system, this equipment was turned on to fix the temperature and humidity in the course of the whole electrospinning process (Figure 2.4).
A
24
2.4.3 Rheological characterization of electrospinning solutions
A rheometer (Anton Paar Modular Compact Rheometer MCR–302) was utilized to observe the rheological properties of PAN, PAN/Lignin, and PAN/Lignin/Graphene blends. The viscosity was calculated using a rheometer, as a function of the shear rate range of 0,1-100 s-1 in concentric cylinder configuration. The blended solutions were measured within 24 h later. The average values of three measurements are reported. 2.4.4 Nanofiber characterization
2.4.4.1 Morphological and structural analysis
The morphology and diameter of PAN, PAN/lignin, and PAN/lignin/GRP nanofibers were assessed by using Zeiss Gemini 300 VP field emission scanning electron microscope (FESEM) working at 5 kV. A few piece of the nanofiber was put on carbon tape and then covered with Au. The mean nanofiber diameter was surveyed using an image analyzer (Image J software). About 40 measurements in each sample were used for the calculation of the diameter distribution.
2.4.4.2 XRD
The structural characterization of PAN, PAN/lignin, and PAN/lignin/GRP nanofibers was achieved by X-ray diffraction (Panalytical Empyrean XRD System, Ni-filtered CuK𝛼, k:1.54 A0) in a 2θ angle range of 100 to 500, with a step size of 0.005. The
percentages of crystallinity were calculated with the Diffrac. Suite Eva software for each nanofiber samples.
2.4.4.3 FTIR
FTIR data were verified on a Thermo Scientific, model Nicolet IS5 with ATR mode. A total of 64 scans were recorded with a resolution of 4 cm-1. The FTIR was completed in the spectral range of 400-4000 cm−1 with absorbance mode. The characteristic absorbance bands for PAN, PAN/Lignin, and PAN/Lignin/GRP nanofibers were approved by FTIR.
2.4.4.4 Electrical conductivity
25
an Autolab PGSTAT302N equipped with a FRA32 M impedance analysis module from Metrohm Autolab B.V. Netherlands. Conductivity measurements were performed by means of a frequency response from 0.1 to 100 kHz under potentiostatic mode at 10 mV.
Nanofibers were vacuum oven-dried at 80 0C for 24 hours and placed in a hollow cylinder with an inner diameter of 10 mm, which was then pressed between two pistons that form the electrodes. Results were obtained with Nova 1.8.17 software. Figure 2.5 showed how the electrical conductivity of PAN, PAN/lignin, and PAN/lignin/GRP nanofiber were measured by using experimental setup.
Figure 2.5: Electrical conductivity set up consists of A) hollow cylinder and B) Potentiostat/Galvanostat.
2.4.4.5 Statistical analysis
In this work, PAN/Lignin/GRP nanofibers were prepared by electrospinning. So as to minimize the response, an experimental design was utilized. Statistical analysis of the electrospinning process was performed by ANOVA using Minitab VR 16.2.4. The factors studied were the ratio of lignin/ PAN (X1), percentage of graphene (X2), and polymer concentration (X3). All variables and their respective range were shown in the further section. A 23 resolution V fractional factorial design with 8 experimental runs in one block. The purpose of this factorial design was to examine the effects of the design variables on the response of conductivity and diameter of PAN/lignin/GRP nanofibers.
26
In order to evaluate the goodness of fit of the analysis, each term of the model is examined statistically which established the meaning of F-values with p≤0.05.
2.4.4.6 TGA
Thermogravimetric analyses (TGA, Q600, TA Instruments) were led to evaluate the thermal stability of the nanofiber mats. Approximately 10 mg samples in a pan and heated from room temperature to 900 0C at a rate of 10 0C/min under nitrogen
atmosphere. The thermal behavior for PAN/Lignin, and PAN/Lignin/GRP nanofibers were detected by TGA.
2.4.4.7 Atomic force microscopy (AFM)
Nanosurf Flex Axiom AFM was used to gather the surface data and phase separation properties of the electrospun nanofibers. Tapping mode AFM was utilized to determine the surface morphology and the cantilever is located at the sample surface within a selected area of interest.
The scan area of each image was chosen 10 µm with and three measurements on same nanofiber were done.
2.5 Thermal Stabilization and Carbonization
Carbonization of nanofibers was started with thermal stabilization step which nanofibers are heated in air and temperature is ramped from 25 0C to 225 0C at a
heating rate of 1 0C /min and held at 225 0C for 2 hours. Thermal stabilization prior to carbonization causes the nanofibers to have increased resistance to higher thermal treatment because of the formation of crosslinks.
In carbonization step, the nanofibers were heated in nitrogen to the different temperature to carbonize. Table 2.2 indicates the heating conditions utilized for nanofibers and the residence time at max temp. and heating rates used for each nanofiber. Thermal stabilization was performed in a Sentro Tech Corp furnace and carbonization was carried out in a Carbolite 1200 0C G-range horizontal tube furnace. The horizontal tube was constantly purged with a 3 L/min flow of nitrogen.
27 Table 2.2: Heating conditions of nanofibers.
2.5.1 SEM of carbon nanofibers
The morphology of the carbonized mats was examined by Scanning Electron Microscopy using Zeiss Gemini 300 VP field emission scanning electron microscope (FESEM) and carbonized mats were covered with gold. The elemental composition of these carbonized mats was examined with Energy Dispersive X-ray Spectroscopy (EDS) and analyzed using the Phenom ProX SEM. Carbonized mats were not coated gold.
2.5.2 RAMAN of carbon nanofibers
Raman measurements were conducted on the carbon nanofibers by using Renishaw. Raman spectrometer at room temperature with a laser diode emitting at 514 and 785 nm, operating in the confocal mode. It was used to detect the presence of graphene in the carbon nanofibers. In order to avoid the overheating of the surface of carbon nanofibers, the energy of the laser has been set at 0.1 mW.
2.6 Electrochemical Sensor Analysis
2.6.1 Preparation of CNF/SPE (Carbon nanofiber modified screen-printed electrode) and CNF-G/SPE (Graphene reinforced carbon nanofiber modified screen-printed electrode)
8 mg/mL of CNFs (20C5) and CNF-Gs (20C5-1G) were homogenized by sonication for 2 h in ethanol and then stirred by a magnetic stirrer for another 1 h until obtained solutions. These obtained solutions were used for modification of SPEs (Screen printed electrodes). 5 µL of the obtained CNFs and CNF-Gs were dropped on the SPEs separately. These electrodes were left for drying in the air. After 1.5 hours, CNFs/SPE
Temperature (0C) Heating rate (0C/min) Residence time at Max. T (h)
900 0C 2 0C/min 1 h
28
and CNF-Gs/SPE were washed with PBS (pH:7.4) and kept for a couple of minutes at room temperatures.
2.6.2 Characterization of CNF/SPE and CNF-G/SPE
The bare SPE, CNF/SPE, and CNF-G/SPE were activated in the acetate buffer solutions (ABS) by means of applying 0.8 V for 60s. AUTOLAB PGSTAT204 potentiostat/galvanostat system was used Electrochemical Impedance Spectroscopy (EIS) and Cyclic voltammetry (CV) measurements for characterization of modified electrodes. The three electrode system consisting of the working electrode, reference electrode, and counter electrode were connected with the Nova 1.10 software.
The EIS was performed in redox solution containing [Fe(CN)6]3−/4− with KCl between
the frequency range of 10−2 Hz to 105. The voltage of +0.24 V and the sinusoidal signal
of 10 mV was implemented in the course of the EIS measurements.
The CV was made in the potential range of 0 V to +1.2 V at a scan rate of 50 mV/s and used [Fe(CN)6]3−/4− with KCl as a redox solution. All measurements were
replicated three times and done at room temperature.
Differential Pulse Voltammetry (DPV) measurements were used to determine the commercial pharmaceutical drug containing acetaminophen. The A-ferin forte tablet (Bilim Pharmaceuticals, Turkey) was ground to powder and dissolved in PBS (pH:7.4). The final concentration of acetaminophen was detected in the working range. The DPV responses were recorded between the potentials + 0.20 V and + 1.20 V, the pulse amplitude 50 mV and pulse width 50 ms.
29 3. RESULTS AND DISCUSSION
3.1 Extraction and Characterization of Lignins
Wood fundamentally consists of cellulose, hemicelluloses, and lignin. Its types can be classified by two kinds: softwood and hardwood. Hardwoods are angiosperm plants although softwoods are gymnosperm plants. The chemical composition of these types differs significantly [89].
The results of Turkish pine and Turkish vine stem were compared to other lignocellulosic raw materials and wastes indicated in Table 3.1. According to Eq (3), Turkish pine and Turkish vine stem consist of 22,9 % and 30,2% lignin, respectively. Table 3.1: The composition of different lignocellulosic resources.
Hemicellulose (%) Cellulose (%) Lignin (%) Reference
Turkish pine 25,6 39,7 22,9
Turkish vine stem 27,3 32,4 30,2
Softwood stems 25-35 45-50 25-35 [90]
Rice straw 18-25 35-45 10-25 [91]
Hardwood stems 20-40 40-55 18-25 [90]
Bagasse 16.52 54.87 23.33 [92]
Wheat straw 20-32 38-45 7-10 [93]
The values reported in Table 3.1, the contents of cellulose are comparatively greater than that of lignin in each wood and non-wood species. Considering Table 3.1, the amount of lignin in softwood stems is higher than in hardwood stems while extracted
30
lignin from Turkish vine stem significantly upper than that of Turkish pine. It is reasonable to presume that Turkish vine stems can be taken either semi-hardwood or softwood because Turkish pine is softwood.
Lignin was extracted from various biomass in this study and compared with commercial lignin (Protobind 2400) as lignin includes different functional groups based on the biomass and the extraction method. For instance, the extracted lignin by using acid treatment has great amounts of carbonyl groups [94]. To study the effect of extraction method and biomass source on the structure and thermal properties of lignin, the characterization methods were used to determine the differences between the commercial lignin and the extracted lignin.
3.1.1 SEM of lignins
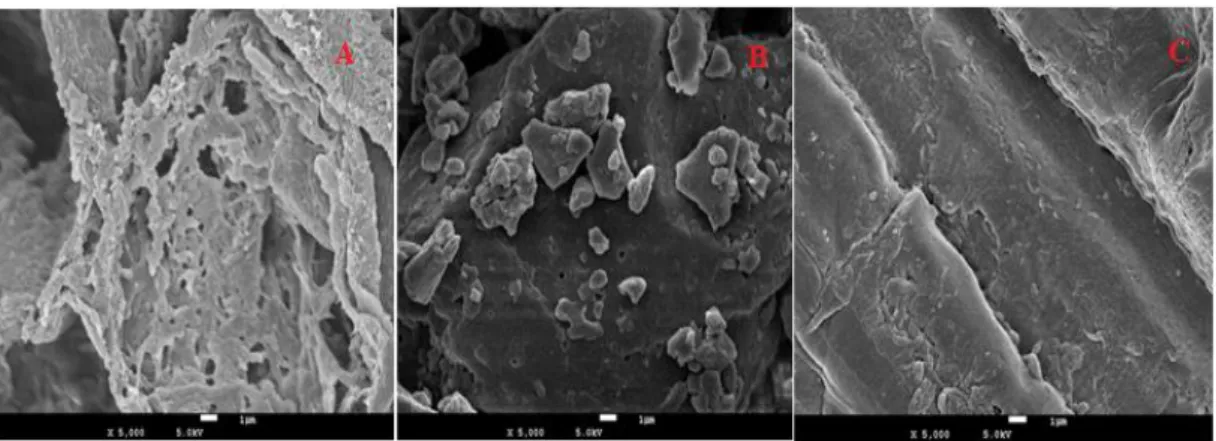
The structure of lignin has irregular shaped and small size particles. Industrial extraction procedures considerably change the chemical structure of lignin while the laboratory scale extraction procedures that give rise to lower alter the natural lignin structure. To figure out the structural differences between commercial and extracted lignin, we were examined the images obtained by SEM. However, Figure 3.1 indicates that the extracted lignins have damaged cell wall in comparison with commercial lignin. These results showed that the extraction method using acid treatment may also damage the morphology and the structure of lignin.
It is evident from Figure 3.1 that another important difference for commercial lignin is particle size. While the average size of commercial lignin (Protobind 2400) is about 10-15µ, the particle size of extracted lignins is much bigger than commercial lignin because of isolation method [28]. Also, these differences can be related to their origin, which influences functional groups.
31
Figure 3.1: SEM images of lignin samples from A) Turkish Vine stem, B) Commercial lignin, and C) Turkish Pine
3.1.2 Contact angle
Contact angle measurements of commercial lignin and extracted lignin were performed to understand the surface properties of them. Lignin consists of hydrophilic and hydrophobic groups. However, the extraction method can strengthen either characteristic for hydrophobicity and hydrophilicity. That’s why contact angle was carried out to understand the effects of acid treatment.
The results from contact angle measurements indicate that the extracted lignins from Turkish vine stem and Turkish pine are more hydrophilic than commercial lignin depending on the different sources and extraction methods (Figure 3.2). The increased hydrophilicity in the extracted lignins can be due to the display of OH groups from the lignin structure or the addition of polar sulfate groups from the extraction method [95, 96]. Also, the differences in contact angle for both type of extracted lignin may be owing to the enlarged roughness of the samples.
32
Figure 3.2: Contact angle images of a) the extracted lignin from Turkish vine stem b) commercial lignin, and c) the extracted lignin from Turkish pine.
3.1.3 FTIR of lignins
The chemical structure of the three lignin samples was performed by means of FTIR in Figure 3.3. As can be seen, the spectra of all lignin are very similar to each other. Every lignin has a strong broad absorption band among 3500 - 3100 cm−1 was because of the presence of hydroxyls. This band is due to the presence of alcoholic and phenolic hydroxyl groups concerned with hydrogen bonding [97]. The extracted lignin has a band at 2930 cm−1 with a shoulder at 2845 cm−1 while the commercial lignin has a sharp band at 2920 cm−1. The appearance of these bands is an indication of the existence of C-H stretching vibrations of aromatic methoxyl groups and methylene in lignin structure [98, 99].
![Figure 1.1: Manufacturing process of carbon fiber from PAN [11].](https://thumb-eu.123doks.com/thumbv2/9libnet/3708343.24891/29.892.207.774.228.771/figure-manufacturing-process-carbon-fiber-pan.webp)
![Figure 1.2: Manufacturing costs of conventional PAN-based CFs [18].](https://thumb-eu.123doks.com/thumbv2/9libnet/3708343.24891/30.892.194.612.180.544/figure-manufacturing-costs-conventional-pan-based-cfs.webp)
![Table 1.1: General properties of different types of lignins [41,42]. Types of lignin Molecular](https://thumb-eu.123doks.com/thumbv2/9libnet/3708343.24891/32.892.106.724.769.1047/table-general-properties-different-lignins-types-lignin-molecular.webp)