* email: [email protected]
Square-wave Voltammetric Determination of Ezetimibe
MEHMET LÜTFI YOLA, NURAN ÖZALTIN1*
Hacettepe University, Faculty of Pharmacy, Department of Analytical Chemistry, 06100 Ankara, Turkey
In this study, the electrochemical reduction of ezetimibe has been studied by means of square wave voltammetry (SWV) at a hanging mercury-drop electrode (HMDE) in electrolytes of different pH. Ezetimibe gave rise to a single voltammetric peak in the potential interval from -1290 to - 1322 mV depending on ezetimibe concentration within the entire pH range (4.0 – 10.0) in K2HPO4 – Na2B4O7 (25:25) (v/v) buffer. The well-defined peaks were observed at the frequency of 50 Hz, amplitude of 20 mV, potential increment of 3 mV. The developed method was validated according to the ICH guideline and found to be linear, sensitive, specific, precise, accurate, rugged and robust. Limit of detection (LOD) and limit of quantification (LOQ) were found 0.099 μg mL-1 and 0.30 μg mL-1 respectively. The linearity range of ezetimibe was 0.33 – 6.54 μg
mL-1 under the optimum conditions. The developed method was applied successfully for the determination
of ezetimibe in tablet dosage form. Also electrochemical behaviours of ezetimibe were investigated. As a results of cyclic voltammetry (CV) and SWV experiments, the reduction mechanism included 2 electrons and 2 protons, and further more, reduction current of ezetimibe was diffusion controlled and the electrode reaction was found to be irreversible by using CV, chronoamperometry (CA) and choronocoulometry (CC) methods. Using these electrochemical techniques diffusion coefficient (D), rate constant for electron transfer (kf) and rate constant of following chemical reaction (k) relating to ezetimibe’s reduction reaction was calculated. It was found out that the reduction reaction occured according to EC mechanism and possible reduction mechanism was proposed.
Keywords: Ezetimibe, square wave voltammetry, pharmaceutical formulation, cyclic voltammetry, chronoamperometry, choronocoulometry
Ezetimibe (EZE), (3R,4S) – 1 (4 fluorophenyl) – 3 -[(3S) – 3 - (4 - fluorophenyl) – 3 -hydroxypropyl] – 4 -(4-hydroxyphenyl) azetidin – 2 – one, is the first of the cholesterol absorption inhibitors, a novel class of lipid modifying, which potently inhibit the absorption of biliary and dietary cholesterol from the small intestine without affecting the absorption of fat-soluble vitamins, triglycerides or bile acids [1]. The potential roles for EZE include its concurrent use with a statin to further enhance the lowering of low-density lipoprotein cholesterol (LDL-C). Other possible roles for EZE monotherapy to treat hypercholesterolemia when statin use cannot be tolerated or its contraindicated [2].
Several methods have been reported for the determination of EZE alone or combination with statins in biological fluids and in pharmaceutical dosage forms including chromatography [3-20], spectrophotometry [21-31], micellar electrokinetic chromatography (MEKC) [32]. In the literature, no voltammetric methods were found for determination of EZE.
The aim of this study was to develop a new SWV method for determination of EZE in pharmaceutical preparation and to investigate electrochemical behaviours of EZE. The validation parameters of the method were evaluated. The developed method was applied to the analysis of a commercial pharmaceutical preparation. The results were compared with ones obtained from UV-spectrophoto-metric method given in the literature [29].
Materials and methods
Reagents
EZE was supplied from the Central Institude of Hygiene of Turkey. It was tested for purity by measuring its melting-point, UV and IR spectra and no impurities were found. All
other chemicals were of analytical reagent grade (Merck and Sigma). Triply distilled mercury was used throughout. EZE stock standard solution (1000 µg mL-1) was
prepared by dissolving 10 mg of EZE in 10 mL MeOH. Working standard solutions were prepared daily by appropriate dilution of the stock standard solution with MeOH. Supporting electrolyte was prepared by mixing the solutions of 0.1 M K2HPO4 and 0.1 M Na2B4O7.2H2O (25:25,v/ v).
Tablet solutions
Ten tablets were weighed and powdered. Equivalent amount to one tablet was accurately weighed and transferred to a 50 mL volumetric flask. MeOH (30 mL) was added and the flask was sonicated for 15 min. to complete dissolution and diluted to the mark with MeOH. A 5 mL portion was centrifuged for 10 min. Appropriate solutions were prepared from the supernatant by dilution with MeOH.
Synthetic tablet preparations
Synthetic tablets were prepared by mixing excipients (croscarmellose sodium, lactose monohydrate, magnesium stearate, microcrystalline cellulose, povidone, sodium lauryl sulfate) and labeled amount (10 mg) of EZE. Then mixture was tranferred 50 mL volumetric flask and appropriate solutions were prepared as explained in tablet solution.
Apparatus
BAS 100 B/W model electrochemical workstation was used. The reference electrode was Ag/AgCl and a platinum wire was used as the auxiliary electrode and a hanging mercury drop electrode (HMDE) was used as the working electrode.
Agilent 8453 single beam UV-visible spectrophotometer was used for spectrophotometric analysis.
All the pH measurements were made with Metler Toledo MA 235.
Procedure
A 3.0 mL volume of supporting electrolyte [K2HPO4 (0.1 M) - Na2B4O7 (0.1 M) (25:25, v/v) (pH 9.0)] was deoxy-genated with pre-purified nitrogen for 10 min. After the voltammogram of this solution had been recorded, EZE standard solution was added by micropipette. Nitrogen was passed through the solution for 1 min. to mix the solution. The voltammogram was recorded again. This procedure was repeated until the peak height no longer increased. Results and discussions
Effect of supporting electrolyte and pH
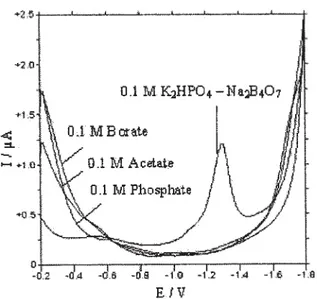
A series of supporting electrolytes [borate, acetate, phosphate and K2HPO4 (0.1 M) - Na2B4O7 (0.1 M) (25:25, v/ v) were tested in the presence of 1.64 μg mL-1 EZE by using
SWV method. The results showed that EZE in K2HPO4 (0.1 M) - Na2B4O7 (0.1 M) (25:25, v/v) mixture gave a signal response (fig. 1). The solution condition such as the pH and the concentration of EZE affect the peak current significantly.
Peak current increases gradually up to pH 9.0. Therefore, pH 9.0 was selected as optimum pH (fig. 2). As shown the equlibrium below, the concentration of the anion form increases by increasing pH. Increasing of peak current by increasing pH showed that anion form of EZE was reduced at HMDE. Observation of reduction peak only in K2HPO4 (0.1 M) - Na2B4O7 (0.1 M) (25:25, v/v) mixture showed that anion form of EZE was stable only in this supporting electrolyte.
Type of reduction current
The type of reduction current was investigated by CA and CV methods. In the CV technique, the effects of scan rate (v) on the peak current (Ip) of EZE were evaluated between 10 and 1000 mV s-1. A plot of log I
p vs log v gave a
straight line with a slope 0.45. A slope of < 0.50 shows that reduction current of EZE was diffusion controlled.
In the CA method, E1 and E2 potential is applied to the working electrode respectively. E1 is chosen such that no reduction reaction of EZE occured. Then the potential is suddenly changed to a new value E2, where the reduction of EZE is diffusion controlled. If Fick’s 2nd Law can be solved with the appropriate boundary conditions, the following equation which can be expressed as the Cottrell
equation:
That is, if the current is diffusion controlled, the current falls with t as logaritmic [33].
Chronoamperometric voltammogram of EZE is similar to diffusion controlled curve. So these results also confirmed that reduction current of EZE was diffusion controlled.
Reversibility
In SWV method, the peak potential shifted to negative values when the concentration of EZE was increased (fig. 6). It was thought that the reduction reaction was irreversible [34]. The reversibility of EZE reduction was also studied by CV method. The loss of the anodic peak on the reverse scan showed that the reduction reaction was not reversible. A plot of peak current vs square root of the scan rate gave a straight line whose slope was smaller than relating to reversible system. The peak potential shifted to negative values when the scan rate was increased (fig. 3) [35]. These results also confirmed that the reduction reaction was irreversible.
Number of protons (p)
In SWV method the peak potential was shifted to more negative values with increasing pH, as can be seen from figure 4. This behaviour indicates that hydrogen ion is participating in the electrode process [36].
The following equation which is related to irreversible systems was used to calculate the number of protons: Fig. 1. Square wave voltammograms of EZE in different
supporting electrolyte
The number of protons calculated from this equation was 2 protons.
Diffusion coefficient (D)
CV, CA and CC methods were used to calculate diffusion coefficient.
In CV method, the following equation which is expressed as the Randles – Sevcik equation was used to calculate the diffusion coefficient of EZE.
In CA method, the Cottrell equation was used to calculate the diffusion coefficient of EZE.
In CC method, integration of the Cottrell equation shows that Q varies with t1/2according to the expression:
So the value of diffusion coefficient was calculated by this equation. The mean of the diffusion coefficient calculated from these equations was 3.50 x 10⁻⁴ cm2 s-1
[33].
Rate constant for electron transfer (kf)
Rate constant for electron transfer (kf) was calculated by CA and CC methods [33].
In CA method, peak current (i) at short times is expressed to the equation:
As it can be seen from this equation, at short times a plot of i vs t1/2 is a straight line of intercept (i
t=0) given by
kf calculated from this equation was 4.0 x 10⁻⁶ cm s-1.
In CC method, Q is plotted as a function of t1/2 at long
times to the straight line defined by
where tL1/2 is the intercept on the x-axis. The value of k f is
obtained from the slope and the value of tL. The value of kf was calculated as 4.3x10⁻⁶ cm s-1.
The values of 4.0 x 10⁻⁶ and 4.3x10⁻⁶ cm s-1 show that the
reduction reaction was slow and irreversible. Proposed mechanism
According to SWV and CV methods; the peak potential was shifted to more negative values with increasing pH and the scan rate respectively. In addition the values of current density (Ipk/Cv1/2) decreased when the scan rate
was increased. So it was thought that the reduction reaction occured according to EC mechanism. In order to prove EC mechanism, the double potential chronoamperometry was applied. The potential E1 = -1070 mV was chosen that no reaction occured, then the potential was suddenly changed to a new value E2 = -1300 mV, where the reduction of EZE was diffusion controlled. In the end τ at this potential is stepped back to a value E1, where EZE was reoxidised. The values of ib / if, the currents on the forward and back pulses respectively, were determined for a range of values of t as shown in figure 5.a.
Fig.3. Cyclic voltammogram of EZE on HMDE. Supporting electrolyte : K2HPO4 (0.1 M) - Na2B4O7 (0.1 M) (25:25, v/v) (pH 9.0);
(a) 25 mV s-1; (b) 50 mV s-1; (c) 100 mV s-1; (d) 250 mV s-1;
(e) 500 mV s-1
Fig.4. Plot of peak potential vs pH for 4.76 μg mL-1 EZE in the
presence of K2HPO4 (0.1 M) - Na2B4O7 (0.1 M) (25:25, v/v)
Fig.5.(a). Double potential step chronoamperometry i – t data for EC mechanism (b). Double potential step chronoamperometry for EZE (t =10 ms, τ = 250 ms)
The value of ib / if is a rather complex function of k, t and τ. However, it is simple to obtain rate constant of chemical reaction (k) values by comparison of the experimentally determined value of ib / if (fig. 5.b) with working curves of this ratio plotted as a function of k τ . These curves are available for various values of the reduced time (t – τ ) / τ [33]. When the experimental value obtained from double potential step for EZE (ib / if = 0.089) put into working curves, the rate constant of chemical reaction (k) following electrochemical step was calculated as 3.14 x 10⁻³ s-1
which was assumed 1st. degree. If there is not any chemical reaction on the reverse scan, the value of ib / if
should be found as 1.0. Therefore, these results confirmed that the reduction reaction occured according to EC mechanism.
As a results of CV and SWV experiments, it is concluded that the reduction mechanism included 2 electrons and 2 protons. In addition that it is known that carbonyl compounds is reduced to alcohols in alkaline media at high over-voltage cathodes such as Hg and reduced to pinacols in acidic media [37, 38]. It is thought that carbonyl (-C=O) belonging to the group of azetidione found in structure of EZE is reduced to –CH(OH) at HMDE. We therefore propose as a possible mechanism to explain the electrochemical reduction of EZE as below.
Validation of the proposed method
Stability
The standard stock solutions of EZE were stored in two different conditions at 4 0C for 30 days (long term stability)
and at ambient temperature for 12 h (short term stability). During this period, the solutions were analyzed by the developed method and no significant differences were found in EZE concentrations. It is decided that EZE is highly stable in the mentioned conditions.
Linearity range
Voltammograms recorded with increasing amount of EZE (fig. 6) show that the peak currents increased linearly with increasing concentration. Each point of the calibration graph corresponded to the mean value obtained from 7 independent measurements. Data of the calibration curves for the proposed method were given in table 1.
Limit of quantification (LOQ) and Limit of detection (LOD) Limit of quantification was estimated by the equation : LOQ = 10 S / m,
Where S is the standard deviation of the intercept and m is the slope of the regression line. The limit of quantitation for EZE was found to be 0.30 μg mL-1.
Chemical reaction (C) following electrochemical step (E) may occur as a strong hydrogen bond between flour and hydrogen. Because this product is stable, re-oxidation does not occur. Due to this situation, anodic peak on the reverse scan is not observed.
Optimization of the experimental conditions
SWV method was used to optimize a rapid and sensitive electroanalytical method for determination of EZE and this method was applied to determination of the drug in pharmaceutical dosage forms.
The square-wave voltammetric responses are directly according to the instrumental conditions. To obtain a much more sensitive peak current, the optimum instrumental conditions, for example pulse amplitude, frequency and scan increment were studied for 1.64 μg mL-1 EZE. The
frequency varied from 10 to 100 Hz. Although the signal response increased with frequency, above 50 Hz the peak shape was deformed. When the pulse amplitude was varied in the range 10 – 50 mV, the peak current increased with increasing pulse amplitude. But above 20 mV peak broadening was observed. The scan increment varied from 2 to 6 mV. When peak height and the peak shape were taken in consideration, 3 mV of scan increment was chosen. Hence, the best peak definition was recorded when using frequency of 50 Hz, pulse amplitude of 20 mV and scan increment of 3 mV.
Limit of detection was estimated by the equation : LOD = 3.3 S / m
The calculated detection limit for EZE was found to be 0.099 μg mL-1 [39].
Precision
Three different concentration of EZE (0.66, 2.28, 4.76 μg mL-1 EZE) in the linear range were analyzed in six
independent series on the same day (intra-day precision) Fig.6. Effect of concentration on the peak current of EZE (a) supporting electrolyte; (b) 0.33; (c) 0.99; (d) 3.23; (e) 4.76; (f) 6.54
μg mL-1 EZE (frequency of 50 Hz, pulse amplitude of 20 mV, scan
increment of 3 mV)
and six consecutive days (inter- day precision) from six measurements of every sample in each series (table 2). The RSD values varied from 0.28 to 1.23 for intra-day and from 0.35 to 1.84 for inter-day precision. The low RSD values of intra-day and inter-day indicated that the developed method has high precision[40].
Accuracy
The accuracy of an analytical method expresses the closeness between the reference value and found value. Accuracy was evaluated as percentage relative error between the measured mean concentrations and added concentrations for EZE (Bias %). Both the results obtained for intra-day and inter-day accuracy were ≤1.52 % (table 2) [40].
Fig. 7. Voltammograms of synthetic preparation, tablet and standard solution for 1.64 μg mL-1 EZE
Table 1
DATA OF THE CALIBRATION CURVES FOR THE PROPOSED METHOD (n = 7)
Table 2
INTRA-DAY AND INTER-DAY PRECISION AND ACCURACY RESULTS OF EZE (n = 6)
Recovery
The determination of EZE in a synthetic preparation [the mixture of excipients and labeled amount (10 mg EZE)] were made. The recovery percentage values ranged between 99.10 and 101.30 % with RSD < 2.00. Closeness of the results to 100.00 % showed that recovery of the developed method was very good [40].
Selectivity
The voltammograms obtained from tablet solution and synthetic preparation were identical with that obtained from standard solution containing an equivalent of EZE (fig. 7). In addition the standard addition technique was applied to the same preparations which were analysed by calibration curves. The regression equation of standard addition curve was found to be y = 291.39x + 315.17 and there was no significant difference between slopes of calibration curves and standard addition curves. These results show that there was no interference from matrix components. Therefore it could be said that the developed method are highly selective.
Robustness and Ruggedness
The effect of different analysts (two) on the results for 1.96 μg mL-1 EZE was evaluated. The obtained results were
compared by Wilcoxon test and there was no significant difference between the results of two analysts (p> 0.05). Robustness test was performed with deliberate small changes at buffer pH (pH 8.90 and pH 9.10), initial potential (-0.6 V and -0.8 V). Each deliberate small change was analyzed 7 independent series containing 1.96 μg mL-1 EZE.
These results were compared by Wilcoxon test and there was no significant difference between the results of changed conditions (p> 0.05). So the developed method could be considered rugged and robust.
Table 3
COMPARISON OF THE RESULTS OBTAINED BY SWV AND UV METHODS FOR EZETROL® CONTAINING 10 mg EZE (n = 7)
Determination of EZE in a pharmaceutical formulation To check the applicability of the proposed method, commercial tablet formulations containing EZE (10 mg per tablet) were analysed. A spectrophotometric method was employed as a comparision to evaluate the validity of the developed method. Table 3 gives the results obtained by the two methods for the determination of EZE in pharmaceutical preperations. The results were compared by the Mann-Whitney U test and there was no significant difference between the methods (p> 0.05).
Conclusion
It can be concluded that SWV is a good technique for determination of EZE in pharmaceutical product. In this method, a high percentage of recovery shows that SWV method can be used to quantify EZE without interference from the excipients. Chromatographic methods for the determination of EZE need expensive equipment and materials and also include time-consuming extraction steps to eliminate the excipients. The described method is a direct method for the determination of EZE without using any reagents which causes interferences, contaminations and consuming time.
In conclusion, the proposed method is precise, accurate, sensitive, rapid, cheap, easy to use and can be preferred to published chromatographic and spectrophoto-metric method for determination of EZE in pharmaceutical preparations.
Acknowledgements: This work is a part of the project (08D12301001-4706) supported by the Hacettepe University, Scientific Research Unit.
References
1. MYCEK, M. J., HARVEY, R. A ., CHAMPE, P. C., Lippincott’s Illustrated Reviews: Pharmacology, Lippincott Williams & Wilkins, 2001
2. SUDHOP, T., BERGMANN, K. V., Drugs, 62, nr. 16, 2002, p. 2333 3. PAWAR, H. L., KOTHAPALLI, L., THOMAS, A., NANDA, R. K., MARE, S., Res. J. Pharm. Technol., 1, nr. 1, 2008, p. 25
4. NEELIMA, B., KUMAR, P. R., KRISHNA, M. M., BINDU, V. H., PRASAD, Y. R., Orient. J. Chem., 24, nr. 1, 2008, p. 195
5. SESHACHALAM, U., KOTHAPALLY, C. B., J. Liq. Chromatogr. Relat. Technol., 31, nr. 5, 2008, p. 714
6. OLIVEIRA PAULO, R., BARTH, T., TODESCHINI, V., DALMORA SERGIO, L., J AOAC Int., 90, nr. 6, 2007, p. 1566
7. RAO, J. V. L. N. S., PRAKASH, P. B., KRISHNA, M. M., KUMAR, B. A., SRINIVAS, A. R. L., Acta Cienc. Indica, Chem., 32 , nr. 2, 2006, p. 95 8. OZALTIN, N., UCAKTURK, E., Chromatographia, 66 , 2007, p. S87-S91
9. CHAUDHARI, B. G., PATEL, N. M., SHAH, P. B., J AOAC Int., 90, nr. 5, 2007, p. 1242
10. QUTAB, S. S., RAZZAQ, S.N., KHAN, I.U., ASHFAQ, M., SHUJA, Z. A., Yaowu Shipin Fenxi 15 , nr. 2, 2007, p. 139
11. SHIVSHANKER, K., SREEKANTH, N., HARIKRISHNAN, N., ROOSEWELT, C., RAO, G. S., GUNASEKARAN, V., Asian J. Chem., 1, nr. 6, 2007, p. 4303
12. BASHA, S. J. S., NAVEED, S. A., TIWARI , N. K., SHASHIKUMAR, D., MUZEEB ,S., KUMAR, T. R., KUMAR, N. V., RAO, N. P., SRINIVAS, N., MULLANGI, R., SRINIVAS, N. R., J. Chromatogr., B: Anal. Technol. Biomed. Life Sci., 853, nr. 1-2, 2007, p. 88
13. RAJKONDAWAR, V. V., Asian J. Chem., 18, nr. 4, 2006, p. 3230 14. DOSHI, A. S., KACHHADIA, P. K., JOSHI, H. S., Chromatographia 67, nr. 1-2, 2008, p. 137
15. MAHADIK, M. V., DHANESHWAR, S. R., Asian J. Pharm. Sci., (Hong Kong, China) 2, nr. 2, 2007, p. 182
16. DIXIT, R. P., BARHATE, C. R., NAG ARSENKER, M. S., Chromatographia 67, nr. 1 - 2, 2008, p. 101
17. DHANESHWAR, S. S., DHANESHWAR, S. R., DESHPANDE, P., PATIL, M., Acta Chromatogr., 19, 2007, p.141
18. SONAWANE, S. S., SHIRKHEDKAR, A. A., SURANA, S. J., Asian J. Chem. 19, nr. 6, 2007, p. 4925
19. LI, Z., SHI, X., WANG, B., JIAO, Z., ZHONG, M., LIU, G., JIA, J., YU, C., Zhongguo Yaoxue Zazhi (Beijing, China) 42 , nr. 7, 2007, p. 531 20. UCAKTURK, E., OZALTIN, N., KAYA, B., J Sep Sci., 32 , nr. 11, 2009, p. 1868
21. MISHRA, P., GUPTA, A., SHAH, K., J. Indian Chem. Soc., 84 , nr. 9, 2007, p. 945
22. ANADAKUMAR, K., KANNAN, K., VETRICHELVAN, T., Pharmbit 17, nr. 1, 2008, p. 57
23. DESHMUKH, D. D., BHATIA, N. M., MORE, H. N., BHATIA, M. S., Asian J. Chem., 20, nr. 1, 2008, p. 155
24. PALABIYIK, I. M., ONUR, F., YARDIMCI C., OZALTIN, N., Quim. Nova 31, nr. 5, 2008, p. 1121
25. KOTHAPALLI, L., PAWAR, H. I., THOMAS, A., NANDA, R. K., YADAV, A., DESHPANDE, A. D., J. Pharm. Res., 7, nr. 1, 2008, p. 14 26. SANKAR, D. G., LATHA, P. V. M., KUMAR, B. A., BABU, P. J., J. Inst. Chem. (India) 78 , nr. 5, 2006, p. 129
27. IMRAN, M., SINGH, R. S. P., CHANDRAN, S., Pharmazie 61, nr. 9, 2006, p. 766
28. SANKAR, D. G., KUMAR, D. V. S. P., KRISHNA, M. V., LATHA, P. V. M., Asian J. Chem., 17, nr. 4, 2005, p. 2812
29. SHRIVASTAVA, P. K., BASNIWAL, P. K., DUBEY, R., NAGAR, P., JAIN, D., BHATTACHARYA, S., Asian J. Chem., 18, nr. 4, 2006, p. 3123 30. SANKAR, D. G., PAWAR, A. K. M., SUMANTH, S. K., LATHA, P. V. M., Asian J. Chem., 17, nr. 3, 2005, p. 2025
31. BARAKA, M. M., KHALIL, H. M., AL-AHMARY, K. M., Bull. Fac. Pharm., (Cairo Univ.) 46, nr. 1, 2008, p. 163
32. DALMORA SERGIO, L., OLIVEIRA PAULO, R., BARTH, T., TODESCHINI, V., Anal Sci., 24 , nr. 4, 2008, p. 499
33. GREEF, R., PEAT, R., ROBINSON, M. L., Instrumental Methods In Electrochemistry, Ellis Horwood, England, 1990
34. O’DEA, J. J., RIBES, A., OSTERYOUNG, J. G., J. Electroanal. Chem., 345, nr. 1 - 2, 1993, 287
35. BOND, A . M. Modern Polarographic Methods in Analytical Chemistry, Marcel Dekker, Inc., USA, 1980, p. 518
36. HEYROVSKY, J., KUTA, J., Principles of Polarography, Academic Press, New York, 1966
37. RIFI, M. R., COVITZ, F. H., Introduction to Organic Electrochemistry, Marcel Dekker, New York, 1974
38. KOLTHAOO, I. M., LINGANE, J. J., Polarography, Interscience Publýshers, New York - London, 1952
39. International Conference on Harmonisation of Technical Requirements for Registration of Pharmacueticals for Human Use, Validation of Analytical Procedures: ICH Harmonised Tripartite Guideline. 2005
40. GREEN, J. M., A practical guide to analytical method validation: Analytical Chemistry 68, nr. 9, 1996, p. 305A-309A