MARKET TIMING AND SELECTIVITY PERFORMANCE OF A-TYPE MUTUAL FUNDS IN TURKEY
The Institute of Economics and Social Sciences of
Bilkent University
by
SERKAN İMİŞİKER
In Partial Fulfillment of the Requirements for the Degree of MASTER OF ARTS IN ECONOMICS
in
THE DEPARTMENT OF ECONOMICS BILKENT UNIVERSITY
ANKARA
I certify that I have read this thesis and have found that it is fully adequate, in scope and in quality, as a thesis for the degree of Master of Arts in Economics.
--- Asst. Prof. Dr. Ümit Özlale Supervisor
I certify that I have read this thesis and have found that it is fully adequate, in scope and in quality, as a thesis for the degree of Master of Arts in Economics.
--- Assoc. Prof. Dr. Hakan Berument Examining Committee Member
I certify that I have read this thesis and have found that it is fully adequate, in scope and in quality, as a thesis for the degree of Master of Arts in Economics.
--- Assoc. Prof. Dr. Levent Özbek Examining Committee Member
Approval of the Institute of Economics and Social Sciences
--- Prof. Dr. Kürşat Aydoğan Director
iii
ABSTRACT
MARKET TIMING AND SELECTIVITY PERFORMANCE OF A-TYPE MUTUAL FUNDS IN TURKEY
İmişiker, Serkan
M.A., Department of Economics Supervisor: Asst. Prof. Dr. Ümit Özlale
August 2004
Selectivity and market timing abilities have been investigated as major determinants of the performance measures for mutual fund managers for years. Almost all of these works are done by using the data from developed countries with monthly or yearly frequency. In this study, A-Type mutual fund managers’ abilities are obtained for Turkey, which is an emerging market, encountered with severe economic crises in the last decade. Also, weekly data have been employed to have a clearer picture. Minor evidence about significant selection ability and some evidence about superior market timing quality are found. Also, cross sectional determinants of these abilities are investigated such as management fee ratio, experience and size. Regression results suggest an interesting effect of management fees on these abilities beside expected outcomes of other factors.
iv ÖZET
TÜRKİYE’DE A TİPİ YATIRIM FONLARININ PİYASA ZAMANLAMASI VE SEÇİCİLİK PERFORMANSI
İmişiker, Serkan Master, Ekonomi Bölümü
Tez Yöneticisi: Yrd. Doç. Dr. Ümit Özlale
Ağustos 2004
Seçim ve zamanlama yetenekleri, yatırım fonu yöneticileri için performans ölçüsünün başlıca kaynağı olarak yıllardır araştırılmaktadır. Bu çalışmaların tamamına yakını gelişmiş ülkelerden elde edilen aylık veya yıllık veriler kullanılarak yapılmıştır. Bu çalışmada, A-Tipi yatırım fonu yöneticilerinin yetenekleri, son on yıldır ciddi ekonomik krizlerin yaşandığı gelişmekte olan bir piyasa konumundaki Türkiye için elde edilmiştir. Buna ek olarak, daha açık bir tabloya ulaşmak için haftalık veriler kullanılmıştır. Ciddi oranlarda seçim yeteneği hakkında çok az kanıt bulunurken, üstün piyasa zamanlaması için ise daha fazla kanıta rastlanmıştır. Yanısıra, bu yeteneklerin oluşumunda yönetim ücreti oranları, tecrübe ve büyüklük gibi sektörel özelliklerin rolü incelenmiştir. Regresyon sonuçları diğer faktörlerin beklendiği şekilde ortaya çıkan bulgularının yanısıra yönetim ücretlerinin bu yetenekler üzerinde ilginç etkilerini göstermektedir.
Anahtar Kelimeler: Seçim, Piyasa zamanlaması, Yatırım fonları, Gelişmekte olan ülke.
v TABLE OF CONTENTS ABSTRACT ... iii ÖZET ... iv TABLE OF CONTENTS ... v LIST OF TABLES ... vi
LIST OF FIGURES ... vii
CHAPTER ONE: INTRODUCTION ... 1
1.1 Literature Review ... 3
CHAPTER TWO: THE TURKISH CAPITAL MARKETS ... 6
2.1 Mutual Funds ... 18
CHAPTER THREE: DATA ... 24
CHAPTER FOUR: METHODOLOGY ... 28
CHAPTER FIVE: EMPIRICAL RESULTS ... 36
5.1. Estimates of Selection and Market Timing Abilities ... 36
5.2. Determinants of Selectivity and Market Timing ... 41
CHAPTER SIX: CONCLUSION ... 45
vi
LIST OF TABLES
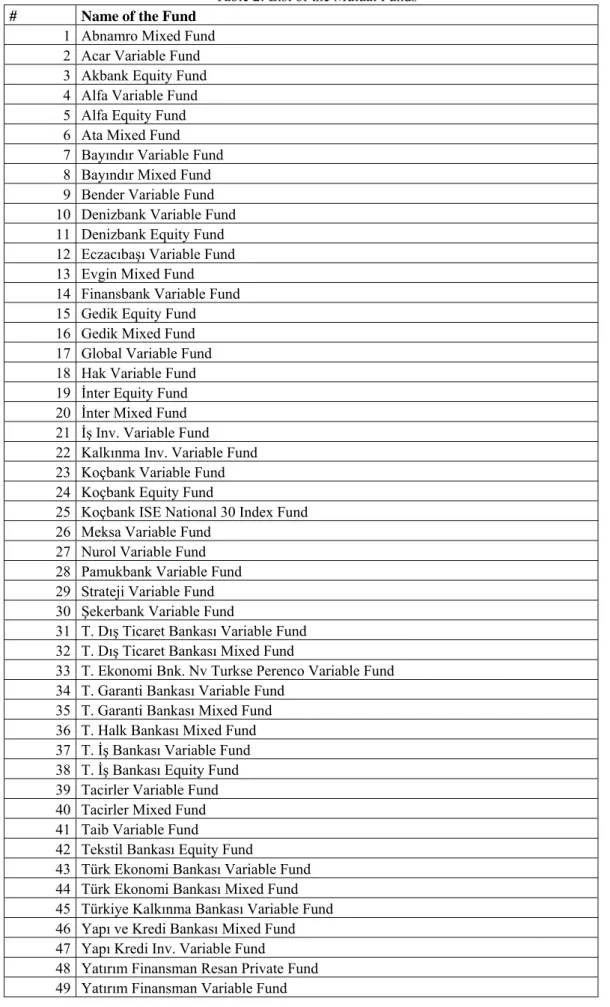
Table 1: Outstanding Securities at Turkish Capital Markets …….……… 14 Table 2: List of the Mutual Funds ………... 27 Table 3: Results of Selectivity Performance of Fund Managers without Considering Timing Ability
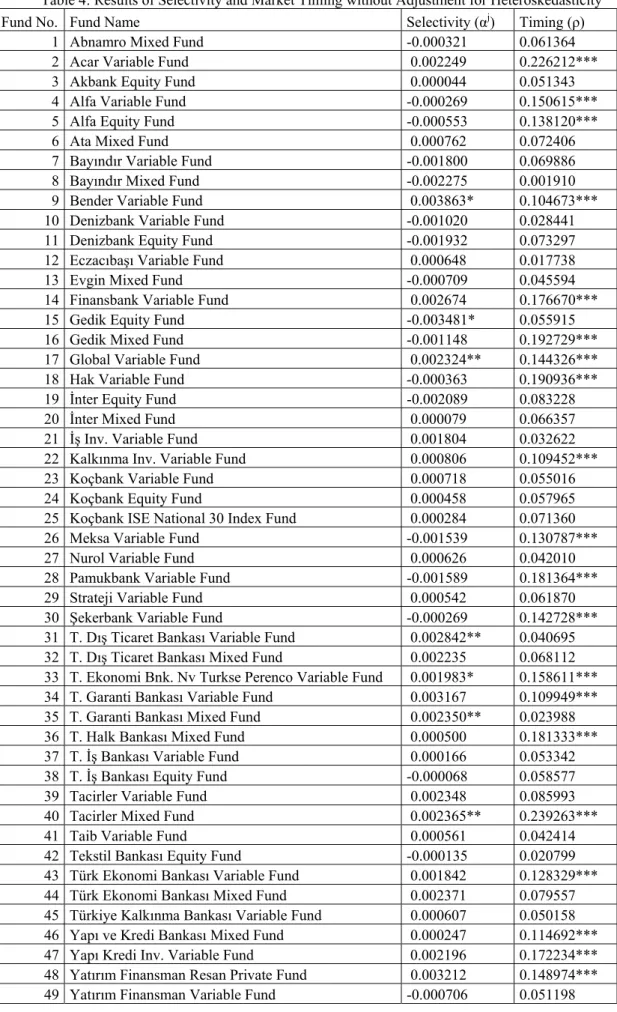
……….… 38 Table 4: Results of Selectivity and Market Timing without Adjustment for
Heteroskedasticity
……….… 39 Table 5: Results of Selectivity and Market Timing with Adjustment for
Heteroskedasticity
……….… 40 Table 6: Summary of the Results of Selectivity and Market Timing Abilities of Mutual Fund Managers
……….… 41 Table 7: Results of the regressions of Ability Measures to Cross Sectional Variables ……….… 43 Table 8: Results of the SUR of Ability Measures to Cross Sectional Variables ...……... 44
vii
LIST OF FIGURES
Figure 1: Number of Firms at ISE……… 12 Figure 2: Total Value of Foreign Investors’ Portfolios at ISE Stocks in Million $... 13 Figure 3: Market Capitalization of ISE-Stock Market for the Period of 1986-2003 in Billion $ ……….. 15 Figure 4: Value of the ISE-100 Index for the period of January 1993- December 2003 in $ ……….. 17 Figure 5: Value of the ISE-100 Index for the Sample Period in TL ……….. 17 Figure 6: Total Portfolio Value of Mutual Funds between January 1997 and October 2003 (Millions $) ………... 20 Figure 7: Percentages of Assets in the Portfolios of A-Type Mutual Funds for 1994-2003 ……….... 20 Figure 8: Percentages of Assets in the Portfolios of B Type Mutual Funds for 1994-2003 ……….... 21 Figure 9: IIMA’s Index Values of Mutual Funds for A and B Types between January 2000 - October 2003 ………... 23
1
CHAPTER ONE
INTRODUCTION
Evaluating the performance of mutual funds is a very popular topic among many researchers for years. The main idea behind the development of mutual fund sector was the lack of time and necessary information of individual investors to form their own portfolios. So, informed and professional mutual fund managers have taken care of these portfolios for their customers in an institutional manner. In this regard, mutual funds are giving the service of portfolio diversification. Development of the mutual funds promotes more efficient financial intermediation and more effective systems of corporate governance, which are prerequisites for improvement of a well-established capital markets.
Investors, who do not have sufficient time and information for managing their savings, evaluate mutual funds’ performances and choose one of them which is suitable for their choice of risk and return. Some well-known performance criteria, such as Sharpe measure, are used by the mutual fund customers.
2
On the other hand, mutual fund managers are selecting financial instruments to buy depending on their fund-specific risk-return criterion. Then, they are trying to sell these instruments at the right time depending on their beliefs about the movements of the individual instruments and the market. This procedure points out that mutual funds have two basic abilities: selectivity and market timing.
Most of the previous studies on this field examined ability parameters of fund managers in developed countries and almost all of them used monthly and yearly data. In this study, we tried to measure both selectivity and market timing performance of 49 mutual funds, which are operating in an emerging market, Turkey, by using the method developed by Bhattacharya and Pfleiderer (1983), which extended Jensen’s (1972) work of evaluating the performance of mutual fund managers by looking at their ex-post performance with respect to market return. Distinct economic conditions and publicly dominated capital market in the country acquire a unique platform to test this model. In contrast to previous works in the field, weekly data are used. In addition, we looked for the relationship between ability parameters of the funds and fund-specific factors such as management fees, bank and non-bank intermediary ownership, experience and size of funds. Such an exercise allowed us to determine the main factors that affect both selection and timing performance of the mutual fund managers. Our results show that management fees have negative effect on both abilities whereas experience has a positive one.
3
1.1. Literature Review
Research on mutual fund performance became very popular after 1960s, starting with the works of Treynor (1965) and Sharpe (1966). Sharpe (1966) developed a measure, called by his name, defined as average excess return on a portfolio divided by its standard deviation. This measure can also be interpreted as the average excess return for a unit of risk. He applied his measure to Dow-Jones Industrial Average (DJIA), 34 mutual funds with annual data for the period of 1954-63. Results showed that funds had nearly 0.63 average while DJIA had 0.68 and approximately only one third of funds performed better than the DJIA in terms of this measure.
Treynor and Mazuy (1966) took the first step to test for market timing ability by adding the quadratic term to the regression model of mutual fund returns. For the period of 1953-62, they concluded that 56 out of 57 mutual funds did not have a significant market timing measure.
Jensen (1968, 1969) estimated funds performance measures for 59 funds by using annual data during 1955-64 and for 56 funds for the sample period 1945-64. The range of measures is -0.08 to 0.058 with an average of -0.011, which indicates that funds have negative selection skills in general.
McDonald (1974) estimated Sharpe, Treynor and Jensen measures of 123 mutual funds by using monthly data for the period 1960-69. He found out sample means of 0.112, 0.518 and 0.051 respectively. Results indicated that more risky and aggressive funds have better performance in terms of mean return to beta or to total variability
4
ratio. Also many funds performed worse than the NYSE Index.
Kon and Jen (1979) investigated whether mutual funds are changing over time their level of market-related risk or not, by dividing their sample into different risk regimes. Using 49 mutual funds’ data they concluded that there is no risk-level stationarity and that funds have market timing abilities.
Kon (1983) examined both selectivity and market timing ability of 37 mutual funds by monthly return for the period 1960-76. His results reveal that none of the funds have a significant level of timing ability and also 5 of them have significant selective measures. Henriksson (1984) also inspected both timing and selectivity abilities of 116 mutual funds for the period of 1968-80. Results indicated that there were 11 positive and 8 negative parameters for selectivity and 3 positive and 9 negative measures of timing.
Ippolito (1989) searched for the effect of fees and expenses of mutual funds to their portfolio performance. He examined selection skills of 143 mutual funds by yearly return of the period 1965-84 and found out that, net of all fees and expenses, mutual funds had better performance than the index funds and mutual funds with high fees and expenses have sufficiently high returns to offset their costs as well.
Lee and Rahman (1990), with the same technique that we used in this study, investigated both market timing and security selection abilities of 93 mutual funds for the period of January 1977 – March 1984. Results suggested that there was some evidence for the superior market timing and security selection abilities. They also
5
looked for the aggressiveness of mutual fund managers and derived a parameter of risk tolerance, which is a measure of a mutual fund manager’s tolerance to accept risk in order to have a better expected return. In addition, they produced a ratio for the average size of risky assets in the portfolio of a fund by using the parameter for risk tolerance.
Leger (1997) examined timing and selectivity skills of UK mutual funds by using 5-year samples between 1974 and 1993. Estimated parameters showed that there was weak superior performance and these abnormal performances of mutual funds were not persistent over time. Furthermore, a negative correlation between market timing and selectivity performance is reported.
6
CHAPTER TWO
THE TURKISH CAPITAL MARKETS
In 1980s, Turkish capital markets experienced a considerable degree of changes to develop into a competitive counterpart for its modern rivals. By the help of some positive modifications observed on the political and economic structure of the country, liberalization and market-orientation processes have formed a sound basis for a modern financial system. There were some cornerstones regarding the acceleration of the development of capital markets.
Initial steps about accelerating the establishment and secure, transparent and stable functioning of modern capital markets were setting up a regulatory institution, named Capital Markets Board (CMB) and a legitimate ground, which is Capital Market Law (CML) enacted in 1981. As mentioned at the 1st Article of that law, the subject of the CML: “…to regulate and control the secure, transparent and stable functioning of the capital market and to protect the rights and benefits of investors with the purpose of ensuring an efficient and widespread participation by the public in the development of the economy through investing savings in the
7 securities market.”
CMB was established as an independent regulatory body in 1982. It is responsible for the regulation and supervision of primary and secondary markets in Turkey. Principal duties of CMB which are listed in Capital Market Law are:
a) To regulate and control the conditions of the issuance, public offering and sale of capital market instruments with respect to the application of this Law;
b) To register capital market instruments to be issued or offered to public and to halt the public offering sale of capital market instruments temporarily in case the public interest so requires;
c) To determine standard ratios related to financial structures, and the use of resources of capital market institutions subject to this Law in general or by areas of activity or types of institutions, and to regulate the principles and procedures related to the publication of these ratios;
d) To determine the principles related to independent auditing operations, including when appropriate with respect to use of electronic media in the capital markets; to determine the conditions for establishment and the working principles of institutions engaged in independent auditing operations with respect to the capital market according to Law No. 3568, dated 1 June 1989 by consulting with the Union of Chambers of Public Accountants of Turkey and to publish lists of those who have such qualifications;
e) To make general and special decisions to ensure duly and timely enlightening of the public and to determine and issue communiqués about the content, standards and principles for the publication of financial statements and reports and their
8
audit, of prospectuses and circulars issued at the public offering of capital market instruments, and of important information affecting the value of instruments;
f) To supervise the activities of the issuers subject to this Law, banks with respect to provisions in paragraph (a) of Article 50, capital market institutions and stock exchanges and other organized markets for compliance with this Law, decrees, communiqués of the Board and other legislation related to capital markets by demanding all the necessary information and documents;
g) To monitor all kinds of publications, announcements and advertisements which are related to the capital market made by any means of communications, and to ban those which are determined to be misleading and to inform the related organizations to duly execute what is required;
h) To review the financial statements and reports and other documents obtained by it or submitted to it in accordance with the provisions of this Law, to request reports also from issuers and internal auditors and independent auditors about matters which are deemed necessary and by evaluating the results obtained, to take the required measures as proved in this Law;
i) To determine the principles related to voting by proxy in the framework of the general provisions at the general assemblies of publicly held joint stock corporations and to make regulations related to those who collect proxies or acquire shares in an amount enabling them to change the management of such corporations, or the obligation of purchasing other shares and the rights of the partners who are in the minority to sell their shares to persons or a group which has taken over the control;
j) To make regulations on the specifications and sale and purchase principles of any derivative instruments, including futures and options contracts based on economic and financial indicators, capital market instruments, commodities, precious
9
metals and foreign currency; the rules and principles relating to supervision, obligations and activities of those who shall be employed at the exchanges and markets where these instruments shall be traded; and the principles for margining, clearing and settlement system;
k) To regulate agreements for the purchase or sale of capital market instruments with the promise to resell or repurchase; to adopt market transaction rules related to these contracts; and to determine operating rules and principles related to these transactions;
l) To determine rules and principles related to the borrowing and lending capital market instruments and short selling transactions and, after obtaining the opinions of the Undersecretariat of the Treasury and the Central Bank of the Republic of Turkey, to adopt regulations related to transactions involving margin trading ;
m) To make necessary regulations within the framework of related legislation with respect to the issuing and public offering of capital market instruments in Turkey by non-residents;
n) To regulate and supervise the clearing and custody of capital market instruments and the rating of capital market institutions and capital market instruments;
o) To determine the principles of establishment, operation, liquidation and termination of newly established capital market institutions and to supervise them in order to ensure the development of capital market.
p) To perform the examinations requested by the Related Minister; to submit reports to the Related Minister in relation with its activities; to submit proposals to the Related Minister with respect to the amendment of legislation concerning the capital market;
10
r) To establish the qualifications necessary to serve as an expert institution with respect to the appraisal of real estate for the purpose of capital market activities and to publish a list of the institutions that have met these qualifications;
s) To determine the rules and principles applicable to persons and organizations engaged in making investment recommendations on the capital market, including in the media and by electronic means;
t) To determine the principles for issuing certificates showing the vocational training and vocational adequacy of persons who shall engage in activities on the capital markets or who shall engage in activities in scope of paragraph (r) of this article and managers and the other employees of capital market institutions and with this objective to establish centers and to determine the principles with respect to the activity;
u) To regulate and supervise public offerings and capital market activities and transactions that are made by means of all kinds of electronic communication tools and media and similar tools including internet and pursuant to general rules to provide for and supervise the use of electronic signatures in activities within the scope of this Law;
v) To make rules and regulations with respect to the method of collective use of voting rights wholly or partly to select members of the board of directors and of company auditors by the general assemblies of stockholders of publicly held joint stock companies subject to this Law;
y) To collaborate in any way and to exchange information regarding the capital market with any equivalent authority of a foreign country responsible for regulation and supervision of their capital markets.
11
Regulation and supervision of capital markets and banking sector are executed by separate public authorities that differ from some other countries. Banking sector was regulated by Treasury before 2000. Then a new regulatory body, Banking Regulation and Supervision Agency, has started to operate by the legitimate ground established in 1999.
After the constitution of relevant regulations in 1985, Istanbul Stock Exchange (ISE) started to operate in 1986. Calculation of ISE Indices was started on October 1987. ISE is the only securities exchange in Turkey, which provides trading in equities, bonds and bills. ISE is now utilizing the latest technologies. Trading and settlement of transactions are executed in a fully computerized environment. Trading is carried out with a screen-based system and orders are automatically matched according to price and time priority. In other words, ISE has similar facilities and technological base like its precedents in developed countries.
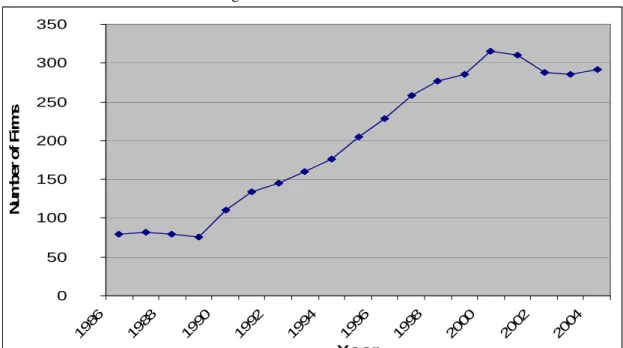
At first, there were 80 firms which were quoted to Istanbul Stock Exchange (ISE) in 1986. Then, another important step was introduced with Decree Num. 31 in 1989. This arrangement liberated the foreign capital flows to the country. As it is seen in figure 1, after Decree Num. 31 was enacted in 1989, the number of firms, which are quoted to ISE, started to increase sharply. This also supported the idea that free capital flow is a crucial point to deepen the capital markets. However, it must also be noted that short-term capital flows can have negative effects on the performance of ISE.
12
Figure 1: Number of Firms at ISE
0 50 100 150 200 250 300 350 19 86 19 88 19 90 19 92 19 94 19 96 19 98 20 00 20 02 20 04 Ye ar Nu m be r of Fi rm s
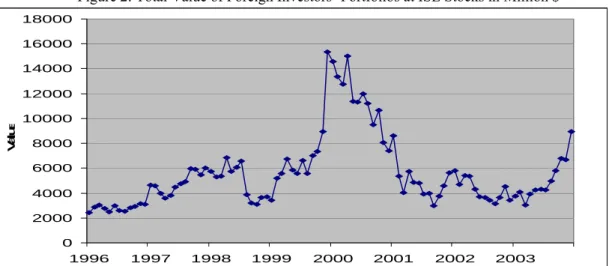
On the other hand, foreign investors’ custody balances of stocks in the period of 1995-2003, in figure 2, seem to be quite volatile, especially for the period of 1998-2000 and the year of 2003. These periods are times of rapid changes in both market capitalization level and index value of ISE stock market, that can also be seen in figure 3 and 4. In the 1998-2000 period, the country experienced a macroeconomic stability program based on a fixed-exchange rate policy. By the help of this program, short-term capital inflows increased which has a great effect on the rise of ISE. However, later on, the overall economy faced with the most severe financial crisis of its history combined with political instability and serious banking scandals. These economic incidents also affected the capital markets extensively; capital inflows replaced by the outflows, hence a highly volatile period for securities market was observed. With general elections on November 2002, after many destabilizing years of coalition governments, one-party government has come into power which is considered by many a promoter of optimism in economic matters. These were the
13
main reasons behind the fluctuations of ISE at the period of 1998-2000 and the year of 2003.
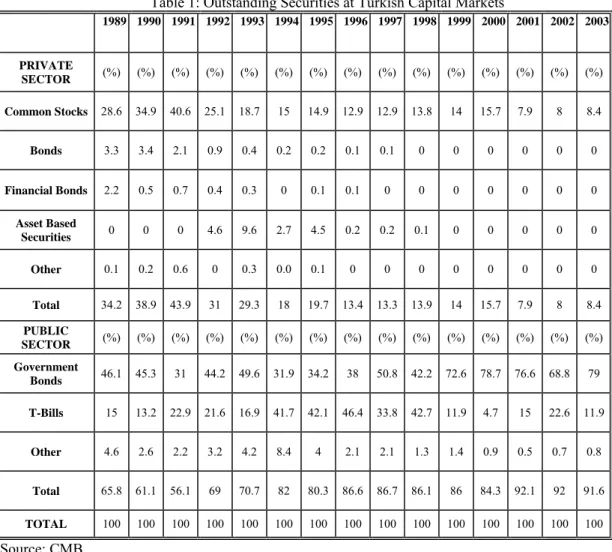
Security structure of the Turkish capital markets for the period 1989-2003 is shown at Table 1. A remarkable point of the picture is that the private sector securities’ weight in the financial system is continuously decreasing, which was 34.2 percent in 1989 and highest with 43.9 percent in 1991 but decreased to 8.4 percent in 2003 and lowest with 7.9 percent in 2001. This is a dramatic fall which indicates a changing environment of capital markets. Another important point is that, recently, there is only common stock in terms of private sector securities which shows that no opportunity for diversification exists and firms can not avoid their several risks by issuing securities. However, in the past there were private sector bonds and asset backed securities to some extent. Especially in 1993, the share of asset-backed securities was more than the half of the common stocks’ share. But for the purpose of monetary control, the share of asset-backed securities was reduced and this instrument disappeared completely after 1998.
Figure 2: Total Value of Foreign Investors’ Portfolios at ISE Stocks in Million $
0 2000 4000 6000 8000 10000 12000 14000 16000 18000 1996 1997 1998 1999 2000 2001 2002 2003 Date V al u e
14
All these changes were influenced by the domination of public sector securities, especially government bonds. Debt structure and huge borrowing requirements of the public sector led to excessively high real interest rates on the government securities. These conditions combined with the tax advantages of the public sector debt instruments with respect to private sector instruments created this picture of one-sided distribution of the securities’ issuers. Total share of the public sector securities increased from 65.8 to 91.6 in the period of 1989-2003. Years of 1992, 1994 and 2001 had a remarkable effect on this situation. 1994 and 2001 economic crisis caused higher public borrowing, nearly a 10 percent jump in the share of public securities for each, and this led to more publicly dominated securities market.
Table 1: Outstanding Securities at Turkish Capital Markets
1989 1990 1991 1992 1993 1994 1995 1996 1997 1998 1999 2000 2001 2002 2003 PRIVATE SECTOR (%) (%) (%) (%) (%) (%) (%) (%) (%) (%) (%) (%) (%) (%) (%) Common Stocks 28.6 34.9 40.6 25.1 18.7 15 14.9 12.9 12.9 13.8 14 15.7 7.9 8 8.4 Bonds 3.3 3.4 2.1 0.9 0.4 0.2 0.2 0.1 0.1 0 0 0 0 0 0 Financial Bonds 2.2 0.5 0.7 0.4 0.3 0 0.1 0.1 0 0 0 0 0 0 0 Asset Based Securities 0 0 0 4.6 9.6 2.7 4.5 0.2 0.2 0.1 0 0 0 0 0 Other 0.1 0.2 0.6 0 0.3 0.0 0.1 0 0 0 0 0 0 0 0 Total 34.2 38.9 43.9 31 29.3 18 19.7 13.4 13.3 13.9 14 15.7 7.9 8 8.4 PUBLIC SECTOR (%) (%) (%) (%) (%) (%) (%) (%) (%) (%) (%) (%) (%) (%) (%) Government Bonds 46.1 45.3 31 44.2 49.6 31.9 34.2 38 50.8 42.2 72.6 78.7 76.6 68.8 79 T-Bills 15 13.2 22.9 21.6 16.9 41.7 42.1 46.4 33.8 42.7 11.9 4.7 15 22.6 11.9 Other 4.6 2.6 2.2 3.2 4.2 8.4 4 2.1 2.1 1.3 1.4 0.9 0.5 0.7 0.8 Total 65.8 61.1 56.1 69 70.7 82 80.3 86.6 86.7 86.1 86 84.3 92.1 92 91.6 TOTAL 100 100 100 100 100 100 100 100 100 100 100 100 100 100 100 Source: CMB
15
These policies damaged the development of financial markets and investors faced only with a few types of financial instruments.
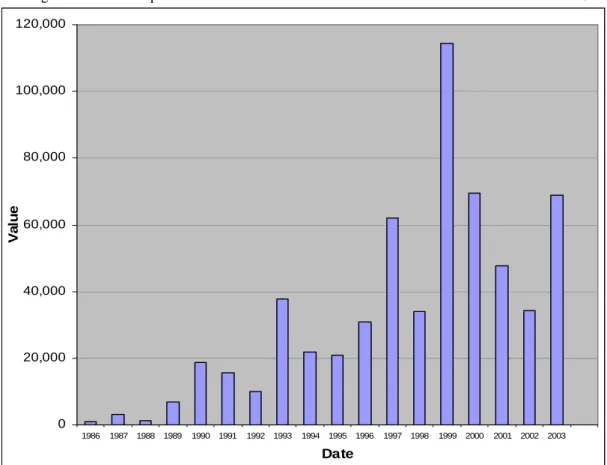
On the other hand, market capitalization, which is the total value of the firms that are quoted to ISE in terms of their market value, increased significantly in 1990s, by the effect of liberalization of foreign capital movements. Figure 3 represents the market capitalization values of the ISE firms. Since market capitalization level was only 938 million $ in 1986, it became 37,824 million $ in 1993 and then it had the highest value at the end of 1999 which was more than 100 billion $.
Figure 3: Market Capitalization of ISE-Stock Market for the Period of 1986-2003 in Billion $
0 20,000 40,000 60,000 80,000 100,000 120,000 1986 1987 1988 1989 1990 1991 1992 1993 1994 1995 1996 1997 1998 1999 2000 2001 2002 2003 Date Va lu e
The sample period for this study of evaluating selectivity and timing performance of mutual funds is between 14 January 2000 and 24 October 2003. The main
16
reason for selecting January 2000 as the beginning of sample period is the new macroeconomic stability program based on a fixed exchange rate regime, primary surplus and structural reforms on the subjects of social security, privatization, taxes and agriculture, which was introduced by the government at the end of 1999.
In our sample period, we see that market capitalization of ISE stock market was 121,703 million $ by the end of January 2000 but it decreased by %54.9 to 54,865 million $ at the end of October 2003 totally due to the detrimental financial crisis of February 2001. The fundamental reason of this remarkable decline in market capitalization was the financial crisis of 2001. Weaknesses of the banking sector and political instability in Turkey, combined with a fragile financial market produced huge financial crisis in November 2000 and February 2001.
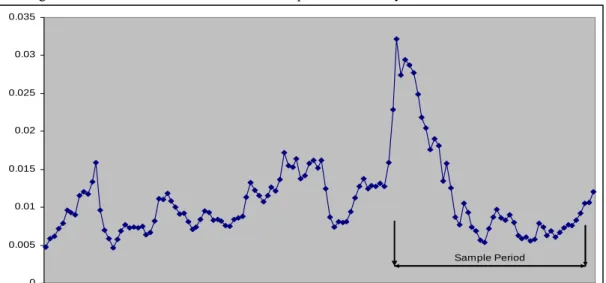
It is seen that, from the chart below, it was also a detrimental period for the ISE-100 index. Index’ dollar value was decreased from 3.22 cent to 1.05 cent in our sample period. At the beginning of the program, with the positive expectations formed by the agents, index had its all-times high value in January 2000, but then it had a sharp downfall.
17
Figure 4: Value of the ISE-100 Index for the period of January 1993- December 2003 in $
0 0.005 0.01 0.015 0.02 0.025 0.03 0.035 Jan .93 Jun. 93 Nov .93 Apr.94Sep. 94 Feb .95 Jul.95Dec. 95 Ma y.96 Oct .96 Ma r.97 Aug. 97 Jan .98 Jun. 98 Nov .98 Apr.99Sep. 99 Feb .00 Jul.00Dec. 00 Ma y.01 Oct .01 Ma r.02 Aug.0 2 Jan .03 Jun. 03 Nov .03 Sample Period
It can also be seen from the chart below that the devaluation of Turkish Lira at that period of time had the dominant effect on this sharp fall. In figure 5, ISE-100 index had a smoother movement for the sample period in terms of Turkish Lira. Index had only a 22.2 percent decrease at this period. After the February 2001 crisis, however, index seems to have a more stable behavior.
Figure 5: Value of the ISE-100 Index for the Sample Period in TL
0 5000 10000 15000 20000 25000 01.20 00 04.2 000 07.2 000 10.20 00 01.20 01 04.200 1 07.20 01 10.200 1 01.20 02 04.2 002 07.20 02 10.2 002 01.2 003 04.20 03 07.200 3 10.200 3 Date Va lu e
18
2.1. Mutual Funds
In the Capital Markets Law, mutual funds are defined as the collections of assets, which have been established with the money to be collected from the public in return for participation certificates with the purpose of managing portfolios on capital market instruments, gold and precious metal on the account of the holders of these certificates on the basis of principle of risk distribution and fiduciary ownership.
Mutual funds are established in the form of open-end investment companies in Turkey. They do not have any legal entity. They are operated in terms of the rules stated in the internal statute of the fund, which includes general terms about management of the fund, custody of the assets, valuation principles and conditions of investing in the fund.
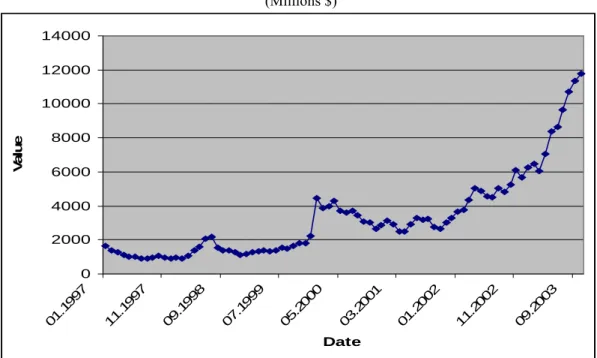
In Turkey, mutual funds became very popular after the end of 1999. Figure 6 demonstrates the total value of portfolios managed by mutual funds. The jump in 1999 and 2000 points out mostly the A-Type funds’ growth, related to the good performance of ISE index. Then, a slow down occurred until the second half of 2002 and after this point of time, mutual funds seized an incredible growth path which concludes with almost 300 percent increase in such a short time. By the end of October 2003, total value of mutual funds’ portfolios valued at approximately 12 billion $, which is also 6.6 percent of GDP in 2002. Over-valued Turkish lira also has an important role on this sharp increase.
19
There are two different types of mutual funds in Turkey, Type A and Type B. Type A mutual funds are required to invest at least 25% of their assets in equities that are issued by Turkish companies. Mutual funds that have no such obligations are classified as Type B mutual funds.
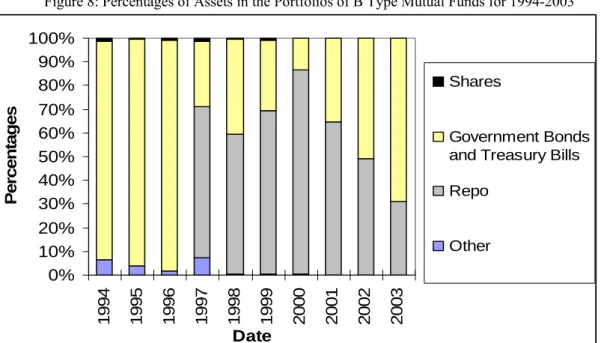
At figures 7 and 8, percentage weights of the asset groups of domestic shares, governments bonds, treasury bills and repo related financial instruments for both A and B Type mutual funds are illustrated. It is observed that for the A-type funds, percentage of stocks steadily increased in time, and, in return, the percentage of public debt instruments such as government bonds and treasury bills decreased. Whereas for B-Type mutual funds, public debt instruments have a significant place on their portfolios. Also repo-related products cover an important weight after 1997. But the stock shares do not have a similar weight on B Type funds’ portfolios compared to A Types. This constitutes the main reason for selecting only A Type mutual funds to evaluate performance of their managers in terms of ISE index’s movements.
Kinds of both mutual funds are classified according to their asset allocation such as Variable, Balanced/Mixed, Affiliate Companies, Sector, Equity, Private, Index, Notes and Bonds, Liquid and Foreign Securities Funds.
20
Figure 6: Total Portfolio Value of Mutual Funds between January 1997 and October 2003 (Millions $) 0 2000 4000 6000 8000 10000 12000 14000 01. 199 7 11. 199 7 09. 199 8 07. 199 9 05. 200 0 03. 200 1 01. 200 2 11.2 002 09. 200 3 Date Va lu e
Figure 7: Percentages of Assets in the Portfolios of A Type Mutual Funds for 1994-2003
0% 10% 20% 30% 40% 50% 60% 70% 80% 90% 100% 1994 1995 1996 1997 1998 1999 2000 2001 2002 2003 Date Percentages Shares Government Bonds and Treasury Bills Reverse Repo
21
Figure 8: Percentages of Assets in the Portfolios of B Type Mutual Funds for 1994-2003
0% 10% 20% 30% 40% 50% 60% 70% 80% 90% 100% 1994 1995 1996 1997 1998 1999 2000 2001 2002 2003 Date Per centages Shares Government Bonds and Treasury Bills Repo
Other
Mutual fund founders are restricted to banks, insurance companies, non-bank intermediaries, unemployment funds and pension funds. Either intermediary institutions that have been authorized to manage portfolios or portfolio management companies manage the portfolios of the mutual funds. The portfolio manager is responsible for managing the portfolio consistent with objectives stated in the internal statute of the fund. A written contract established between a mutual fund and a portfolio manager specifies the services. The portfolio manager is subject to numerous legal restrictions between the fund and itself.
In order to ensure that mutual funds’ portfolios are sufficiently liquid and well diversified, law and regulations enforce some limitations on their portfolios. Some of the portfolio restrictions of the mutual funds are as follows;
22
price when buying and the highest price when selling an asset.
· Not to invest in non-listed securities, with a limited exception for the securities, the founder or the portfolio manager of the fund underwrites.
· Not to invest in the securities of a single issuer more than 10% of its net asset value.
· Not to purchase more than 9% of one issuer’s shares.
· Not to invest in the securities of the founder or the portfolio manager.
· Not to be represented in the management of the companies whose shares it has purchased.
The assets of the mutual funds are subject to valuation on a daily basis. They are valued at weighted average prices or rates of the market in case such a price or rate exists. Alternatively, the valuation is based on the last existing market price for stocks and the internal rate of return for fixed income securities. After valuation is done for each of the assets, they are summed up to find the portfolio value. Finally, by including the credits and excluding the debts and other costs of the fund, the net asset value of the fund is reached.
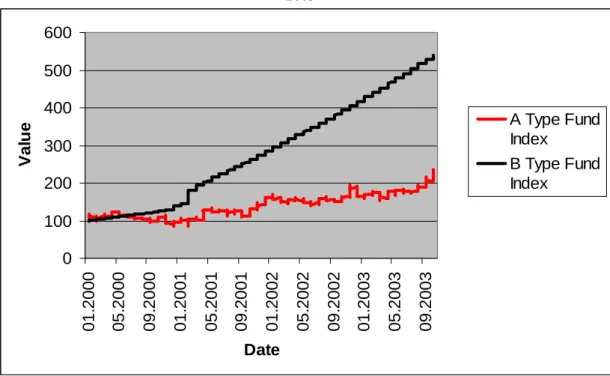
Institutional Investment Managers’ Association (IIMA) announces an index value for both A and B Type mutual funds on a daily basis. In figure 9, index values for the sample period are seen. Both fund indexes are starting from a standardized value 100 at the beginning. B-Type funds obviously have a better performance with an approximately 450 percent raise than the A-Types which have nearly 100 percent. Debt dynamics of the public sector and depreciation of Turkish lira are primary reasons for this divergence between the returns of these types of
23
funds. At the same time, period ISE-100 index decreased by 22.2 percent. In general, A-Type funds’ portfolios, dominated by the weight of stock shares, could only outperform ISE-100 index by their managers’ abilities of selectivity and market timing.
Figure 9: IIMA’s Index Values of Mutual Funds for A and B Types between January 2000 - October 2003 0 100 200 300 400 500 600 01 .2 000 05 .2 000 09 .2 000 01 .2 001 05 .2 001 09 .2 001 01 .2 002 05 .2 002 09 .2 002 01 .2 003 05 .2 003 09 .2 003 Date Va lu e A Type Fund Index B Type Fund Index
Both A and B type funds are exempted from corporate tax but there is only a %10 withholding tax on B type funds.
24
CHAPTER THREE
DATA
We examine the selectivity and market timing ability of portfolio managers by using excess return of each mutual fund and market portfolio. The data consist of weekly time series of the variables. Data of fund values are published by Custody and Settlement Bank of Turkey and obtained from CMB’s database system. Fund values represent the value of portfolios of each fund, net of all fees and expenses. Data consist of 49 A-Type mutual funds for 193 weeks for the period 14 January 2000-24 October 2003. List of the funds that are used in this study is shown at the Table-2 below. ISE-100 Index’s performance is used as a proxy for the market portfolio’s return. Risk-free rate is measured by the rate of return of 91-day Treasury bill, which is calculated by ISE’s 91-day Treasury bill performance index. Excess return of each asset is calculated by subtracting the risk-free rate from the individual asset’s return. All rates of returns are calculated simply by the following formula:
25 1 1 − − − = t t t t P P P R
, where Pt is the value of index at time t and Rt is the rate of return at time t.
Index values of last business day of each week are accepted as weekly observations of each index.
Funds charge a constant percentage of the total portfolio each day as management fees.1 The maximum of the average management fee ratios is .0003, while the minimum is .000023 and the average is .000146. Most of the funds have charged .000150 as management fee. Because of the fact that mutual fund values, net of management and all other fees, are used to obtain selectivity and market timing performance measures, it is expected to see independent or positively related behavior of ability measures and fee ratios to offset the management costs.
Another fund-specific variable is experience. Experience of a mutual fund is measured by the days between the initial public offering of the fund and the first day of the sample period. It is assumed that each month consists of 30 days and each year has 360 days. For 47 funds out of 49, experience measures are obtainable from CMB data system.
1 Management fee ratios of each mutual fund are announced by CMB for the years of 2001, 2002 and
2003, not for the year of 2000 which is in our sample period. However, when fee ratios for each year are analyzed, it is observed that there were only slight changes for a few funds along this period. So, average of the management fee ratios for these 3 years is used as a proxy for the entire period without any inconvenience.
26
Average portfolio value of each fund is calculated by simply taking the average of the daily values for the entire sample period.
27
Table 2: List of the Mutual Funds # Name of the Fund
1 Abnamro Mixed Fund 2 Acar Variable Fund 3 Akbank Equity Fund 4 Alfa Variable Fund 5 Alfa Equity Fund 6 Ata Mixed Fund 7 Bayındır Variable Fund 8 Bayındır Mixed Fund 9 Bender Variable Fund 10 Denizbank Variable Fund 11 Denizbank Equity Fund 12 Eczacıbaşı Variable Fund 13 Evgin Mixed Fund 14 Finansbank Variable Fund 15 Gedik Equity Fund 16 Gedik Mixed Fund 17 Global Variable Fund 18 Hak Variable Fund 19 İnter Equity Fund 20 İnter Mixed Fund 21 İş Inv. Variable Fund 22 Kalkınma Inv. Variable Fund 23 Koçbank Variable Fund 24 Koçbank Equity Fund
25 Koçbank ISE National 30 Index Fund 26 Meksa Variable Fund
27 Nurol Variable Fund 28 Pamukbank Variable Fund 29 Strateji Variable Fund 30 Şekerbank Variable Fund
31 T. Dış Ticaret Bankası Variable Fund 32 T. Dış Ticaret Bankası Mixed Fund
33 T. Ekonomi Bnk. Nv Turkse Perenco Variable Fund 34 T. Garanti Bankası Variable Fund
35 T. Garanti Bankası Mixed Fund 36 T. Halk Bankası Mixed Fund 37 T. İş Bankası Variable Fund 38 T. İş Bankası Equity Fund 39 Tacirler Variable Fund 40 Tacirler Mixed Fund 41 Taib Variable Fund
42 Tekstil Bankası Equity Fund
43 Türk Ekonomi Bankası Variable Fund 44 Türk Ekonomi Bankası Mixed Fund 45 Türkiye Kalkınma Bankası Variable Fund 46 Yapı ve Kredi Bankası Mixed Fund 47 Yapı Kredi Inv. Variable Fund
48 Yatırım Finansman Resan Private Fund 49 Yatırım Finansman Variable Fund
28
CHAPTER FOUR
METHODOLOGY
Fama (1972) considered portfolio managers’ forecasting abilities in two major parts: microforecasting and macroforecasting. Microforecasting ability refers to the managers’ performance of foresee the price movements of individual stocks. Fundamental and technical analyses are two widely used methods to outguess stock price movements in the market. Basically, these methods depend onto historical behavior of that individual stock and financial statements. On the other hand, macroforecasting ability of portfolio managers indicates their success on foreseeing price movements of the market and it is clear that these movements depend upon many political and economic events. Microforecasting is known as “security analysis” and macroforecasting is referred as “market timing”. Our purpose is to use an empirical model to reveal both microforecasting, selectivity, and macroforecasting, market timing, abilities of portfolio managers at the same time.
29 , ~ ~ ~ j t m t j j t R e R = β + (1) where j t
R~ is the excess return of the jth portfolio at time t, R~tm is the excess return
of the market portfolio, β j
represents the relation between individual portfolio return and market return and j
t
e~ is a random error with zero mean. Informed portfolio manager as microforecasters, would try to realize positive j
t
e~ values which indicate a good selection of securities that yield better return for a given level of risk. In this sense, a superior microforecaster tries to select stocks which are lying above the security market line, which means higher return than the similar assets with the same level of risk. Thus, we can relax the assumption that excess return equation (1) is passing through the origin and simply rewrite the equation as follows:
, ~ ~ ~ j t m t j j j t R u R = α + β + (2)
If a portfolio manager predicts the price movements of stocks well, then the intercept term of the equation (2), α j, has a positive value. In addition to the selection ability, if portfolio managers do superior forecasts on market movements, then when they expect that market will make positive returns in the next period they can simply increase their risk level by choosing more sensitive stocks for their portfolios. Analogously, if they expect negative returns on the market, then they invest to less risky assets which are less sensitive to the market portfolio. These behaviors of the portfolio managers show their market timing ability.
30
Equation (2), which is Jensen’s (1968) specification, does not consider the market timing ability of a portfolio manager by itself. It can be achieved by allowing β j being stochastic. Then, market timing ability can be captured by the correlation between time varying β~jand m
t R~ .
Treynor and Mazuy (1966) proposed adding quadratic term to the equation (2) to test the market timing ability of portfolio managers, but they noted that only one fund has a superior market timing behavior out of 57 mutual funds. Jensen (1972) put forward a model design to test both selection and market timing abilities. In this setup,
t
π~ represents~ (~m)
t m
t E R
R − , where E(R~tm) is the unconditional expectation of the market return. Also, ~*
t
π is the expected value of π~ conditional upon the fund t manager’s information set φt. In this sense, ~*
t
π serves as a proxy for the fund managers’ beliefs about the abnormal return on the market which can also help to model out the market timing. Under the assumptions, there is constant absolute risk aversion and π~ has normal conditional distribution, Jensen indicated that: t
, ~ ~ * t j T j t β θ π β = + (3) where β jis time-varying. j T
β is the target beta of the fund and θ measures the sensitivity of the mutual fund managers’ responses to the information set they have. Under the assumptions of joint normal distributions of forecasted and actual returns, Jensen proposed to get a manager’s forecasting ability by looking at the relation between forecasted and actual rate of return on the market. In accordance, Jensen
31 noted optimal forecast
~ ~ ~* t t t =
π
+ vπ
(4)where v~ is assumed to be normally distributed and independent of t π~ . He t rewrites equation (2) as follows:
[
~ (~ ~ )]
[
( ) ~]
~ ~ j t t m t t j t j j t v E R u R =α + β +θ π + +π + (5)Then, for the regression of
~ ~ ~ ~ 2 2 1 0 j t t t j t u R = η +η π + η π + (6) where as claimed: , ) 1 ( ) ~ ( lim 2 2 0 ^ π σ ρ θ β α η = + j m + − T j R E p (7) , ) ~ ( lim 2 1 ^ j T m R E p η = ρ θ + β (8) and , lim η^ 2 = θ p (9)
where ρ is the correlation between predicted value of π~ and realized value of t
t
π~ and 2
π
σ is the variance of π~ . However, for this setup there are too many t unknowns and extra information is needed to quantify relevant ability measures. Merton (1981) and Henriksson and Merton (1981) tried to adjust this method and assumed a simpler way of forecasting which consists of positive or negative excess return of the market. But Chang and Lewellen (1984) and Henriksson (1984) used this method and they did not find any proof of market timing.
32
In our study, we used the method which was developed by Bhattacharya and Pfleiderer (1983) based on the work of Jensen (1972), which improved the former model by assuming that, at time t, fund managers receive a signal of π~ + , in which t ε~t
t
ε~ is independent of π~ and normally distributed with zero mean. At this time they t wrote for the optimal forecast
), ~ ~ ( ~ * t t t
ψ
π
ε
π
= + (10)and showed from the minimization of the variance of the forecast error as
[
~ ( ~ ~ )]
minψ E π t − ψ π t + ε t 2 that, ) ( 2 2 2 ε π π σ σ σ ψ + = (11)They have also mentioned that θ is 1/
[
avar(π~t /φt)]
, where absolute risk aversion is indicated by a and they noted jT
β is (~m) R E
θ . Finally they also, rewrote equation (2) as ~ ~ ~ ) ~ ( ~ ) 1 )( ~ ( ~ 2 j t m t t m t m t m j j t u R R R R E R + + + − + = ε ψθ ψθ ψ θ α (12)
and this is simply,
~ ) ~ ( ~ ~ 2 2 1 0′ + ′ + ′ + ′ = m t t m t j t R R R η η η ω (13) where
33 lim 0 ^ j p η ′ = α (14) ), 1 )( ~ ( lim η^′1 = θ m − ψ R E p (15) , lim η^′2 = θψ p (16) j
α exposes the information about the existence of selection ability of fund managers. Obtaining the market timing measures needs more than just performing regression of equation (13). It is done so by using the quadratic term’s coefficient and disturbance term. The disturbance term in (13) is
, ~ ~ ~ ~ j t m t t t = R + u ′ θψ ε ω (17)
Required information to get timing ability measure can be obtained by the following regression: , ~ ) ~ ( ) ~ ( 2 2 2 2 2 t m t t θ ψ σ R ζ ω ′ = ε + (18) where . ~ ~ ~ 2 ) ~ ( ) ~ ( ) ~ ( ~ 2 2 2 2 2 2 j t t m t j t t m t t θ ψ R ε σ u θψ R ε u ζ = − ε + + (19)
Using the estimates of 2 2 2
ε σ ψ
θ from (18) and θψ from (13) we can easily get
2
ε
σ . Another step to obtain market timing measures is to estimate 2
π
σ . This is done by using the technique which was developed by Merton (1980) under the assumption that
t
~
π is a stationary Wiener process. Relevant estimate of 2
π
34
[
ln( 1 ~ )]
/ . ˆ 2 1 2 n R n t m t ⎪⎭ ⎪ ⎬ ⎫ ⎪⎩ ⎪ ⎨ ⎧ + =∑
= π σ (20)For our sample period, the estimate for ˆ2
π
σ is .0048367 and the sample variance of π~ is .0047586. t
At the end, by the help of this estimate, quality of market timing ability of mutual fund managers can be estimated by the following equation:
. 2 2 2 2 ε π π σ σ σ ρ ψ + = = (21)
Finally ρ is a measurement for fund managers’ market timing ability.
However, the results that were already derived are not the most efficient ones because of the existence of heteroskedasticity at the disturbance terms of equation (13) and (18). For the purpose of obtaining more efficient results of the relevant regressions, generalized least squares (GLS) method is used consistent with Lee and Rahman (1990). In this method, variances of the disturbance terms of the relevant equations are derived as follows:
2 2 2 2 ( ~ ) 2 2 , u m t R σ σ ψ θ σ ω = ε + (22) and . ) ~ ( 4 2 ) ~ ( 2 4 4 4 4 4 2 2 2 2 2 2 u m t u m t R R σ σ θ ψ σ σ ψ θ σ ζ = ε + + ε (23)
35
2
u
σ is estimated from equation (2) and all other variables used in these derivations are already obtained from previous equations. Then, each expression in equation (13) are divided by 2
ω
σ and analogously the variables of the equation (18) are divided by
2
ζ
σ . After this process, OLS method is used for the transformed data set to get the efficient results.
36
CHAPTER FIVE
EMPIRICAL RESULTS
5.1. Estimates of Selection and Market Timing Abilities
Empirical results for selection and market timing abilities of the fund managers are divided into three parts. At Table-3, selectivity results of the equation (2) which does not consider the timing ability, are presented. At Table-4 and Table-5, the unadjusted and adjusted for heteroskedasticity results are shown. For selectivity measures, both .05, .10 and .15 significance levels are interpreted, but for market timing only the estimates with .05 significance level are indicated.
Results indicate weak evidence of selectivity and some evidence for market timing ability for the mutual fund managers. Only one fund for homoskedastic and 3 funds for heteroskedastic model have significant estimates of selectivity and all are positive. In terms of market timing, out of 49 mutual funds, 20 funds for heteroskedastic and 22 funds for homoskedastic model have superior quality of
37 market timing.
A summary of the results is shown at Table-6. It is clear that the estimates for selectivity ability for the model which does not consider market timing are lower than the estimates of the model with market timing. This result is consistent with the findings of Grant (1997), Chang and Lewellen (1984), Henriksson (1984) and Lee and Rahman (1990). On the other hand, correction for heteroskedasticity increases the number of superiror market-timing ability, which is not consistent with Breen, Jagannathan and Offer (1986) and Lee and Rahman (1990).
38
Table 3: Results of Selectivity Performance of Fund Managers without Considering Timing Ability
Fund No. Fund Name Selectivity (αj)
1 Abnamro Mixed Fund -0.001448
2 Acar Variable Fund -0.000713
3 Akbank Equity Fund -0.000786
4 Alfa Variable Fund -0.002106
5 Alfa Equity Fund -0.002770
6 Ata Mixed Fund -0.000060
7 Bayındır Variable Fund -0.000437
8 Bayındır Mixed Fund -0.002247
9 Bender Variable Fund 0.002055
10 Denizbank Variable Fund -0.000684
11 Denizbank Equity Fund -0.000478
12 Eczacıbaşı Variable Fund 0.000439
13 Evgin Mixed Fund -0.001317
14 Finansbank Variable Fund -0.002283
15 Gedik Equity Fund -0.004493***
16 Gedik Mixed Fund -0.003166**
17 Global Variable Fund 0.001003
18 Hak Variable Fund -0.002880*
19 İnter Equity Fund -0.000270
20 İnter Mixed Fund 0.001013
21 İş Inv. Variable Fund 0.002251*
22 Kalkınma Inv. Variable Fund -0.000853
23 Koçbank Variable Fund 0.001342
24 Koçbank Equity Fund -0.000503
25 Koçbank ISE National 30 Index Fund -0.001240
26 Meksa Variable Fund -0.003347**
27 Nurol Variable Fund 0.001221
28 Pamukbank Variable Fund -0.005197***
29 Strateji Variable Fund -0.000877
30 Şekerbank Variable Fund -0.002404
31 T. Dış Ticaret Bankası Variable Fund 0.002277* 32 T. Dış Ticaret Bankası Mixed Fund 0.001311 33 T. Ekonomi Bnk. Nv Turkse Perenco Variable Fund 0.000642 34 T. Garanti Bankası Variable Fund 0.001525 35 T. Garanti Bankası Mixed Fund 0.002110**
36 T. Halk Bankası Mixed Fund -0.001172
37 T. İş Bankası Variable Fund -0.000416
38 T. İş Bankası Equity Fund -0.001145
39 Tacirler Variable Fund 0.000742
40 Tacirler Mixed Fund 0.000204
41 Taib Variable Fund 0.001201
42 Tekstil Bankası Equity Fund -0.000587
43 Türk Ekonomi Bankası Variable Fund 0.000589 44 Türk Ekonomi Bankası Mixed Fund 0.001335 45 Türkiye Kalkınma Bankası Variable Fund -0.000141 46 Yapı ve Kredi Bankası Mixed Fund -0.001301 47 Yapı Kredi Inv. Variable Fund -0.000911 48 Yatırım Finansman Resan Private Fund -0.000165 49 Yatırım Finansman Variable Fund -0.001281
39
Table 4: Results of Selectivity and Market Timing without Adjustment for Heteroskedasticity
Fund No. Fund Name Selectivity (αj) Timing (ρ)
1 Abnamro Mixed Fund -0.000321 0.061364
2 Acar Variable Fund 0.002249 0.226212***
3 Akbank Equity Fund 0.000044 0.051343
4 Alfa Variable Fund -0.000269 0.150615***
5 Alfa Equity Fund -0.000553 0.138120***
6 Ata Mixed Fund 0.000762 0.072406
7 Bayındır Variable Fund -0.001800 0.069886
8 Bayındır Mixed Fund -0.002275 0.001910
9 Bender Variable Fund 0.003863* 0.104673***
10 Denizbank Variable Fund -0.001020 0.028441
11 Denizbank Equity Fund -0.001932 0.073297
12 Eczacıbaşı Variable Fund 0.000648 0.017738
13 Evgin Mixed Fund -0.000709 0.045594
14 Finansbank Variable Fund 0.002674 0.176670***
15 Gedik Equity Fund -0.003481* 0.055915
16 Gedik Mixed Fund -0.001148 0.192729***
17 Global Variable Fund 0.002324** 0.144326***
18 Hak Variable Fund -0.000363 0.190936***
19 İnter Equity Fund -0.002089 0.083228
20 İnter Mixed Fund 0.000079 0.066357
21 İş Inv. Variable Fund 0.001804 0.032622
22 Kalkınma Inv. Variable Fund 0.000806 0.109452***
23 Koçbank Variable Fund 0.000718 0.055016
24 Koçbank Equity Fund 0.000458 0.057965
25 Koçbank ISE National 30 Index Fund 0.000284 0.071360
26 Meksa Variable Fund -0.001539 0.130787***
27 Nurol Variable Fund 0.000626 0.042010
28 Pamukbank Variable Fund -0.001589 0.181364***
29 Strateji Variable Fund 0.000542 0.061870
30 Şekerbank Variable Fund -0.000269 0.142728*** 31 T. Dış Ticaret Bankası Variable Fund 0.002842** 0.040695 32 T. Dış Ticaret Bankası Mixed Fund 0.002235 0.068112 33 T. Ekonomi Bnk. Nv Turkse Perenco Variable Fund 0.001983* 0.158611*** 34 T. Garanti Bankası Variable Fund 0.003167 0.109949*** 35 T. Garanti Bankası Mixed Fund 0.002350** 0.023988 36 T. Halk Bankası Mixed Fund 0.000500 0.181333*** 37 T. İş Bankası Variable Fund 0.000166 0.053342
38 T. İş Bankası Equity Fund -0.000068 0.058577
39 Tacirler Variable Fund 0.002348 0.085993
40 Tacirler Mixed Fund 0.002365** 0.239263***
41 Taib Variable Fund 0.000561 0.042414
42 Tekstil Bankası Equity Fund -0.000135 0.020799 43 Türk Ekonomi Bankası Variable Fund 0.001842 0.128329*** 44 Türk Ekonomi Bankası Mixed Fund 0.002371 0.079557 45 Türkiye Kalkınma Bankası Variable Fund 0.000607 0.050158 46 Yapı ve Kredi Bankası Mixed Fund 0.000247 0.114692*** 47 Yapı Kredi Inv. Variable Fund 0.002196 0.172234*** 48 Yatırım Finansman Resan Private Fund 0.003212 0.148974*** 49 Yatırım Finansman Variable Fund -0.000706 0.051198
40
Table 5: Results of Selectivity and Market Timing with Adjustment for Heteroskedasticity
Fund No. Fund Name Selectivity (αj) Timing (ρ)
1 Abnamro Mixed Fund 0.000200 0.059043***
2 Acar Variable Fund 0.001297 0.059978***
3 Akbank Equity Fund -0.000303 0.001835
4 Alfa Variable Fund -0.000227 0.078992***
5 Alfa Equity Fund -0.000845 0.055129***
6 Ata Mixed Fund 0.001263 0.069637***
7 Bayındır Variable Fund -0.001851 0.051068***
8 Bayındır Mixed Fund -0.000993 0.056186***
9 Bender Variable Fund 0.002441 0.013323
10 Denizbank Variable Fund -0.000712 0.000708
11 Denizbank Equity Fund -0.001091 0.015293
12 Eczacıbaşı Variable Fund 0.000769 0.009758
13 Evgin Mixed Fund -0.000023 0.055149***
14 Finansbank Variable Fund 0.002122 0.102141***
15 Gedik Equity Fund -0.003071 0.045010
16 Gedik Mixed Fund -0.001813 0.046558
17 Global Variable Fund 0.002215* 0.059599***
18 Hak Variable Fund -0.001715 0.031459
19 İnter Equity Fund -0.002481 0.086476***
20 İnter Mixed Fund 0.000274 0.040196
21 İş Inv. Variable Fund 0.002011 0.026947
22 Kalkınma Inv. Variable Fund 0.000987 0.065155***
23 Koçbank Variable Fund 0.000747 0.043397
24 Koçbank Equity Fund 0.001256 0.057192***
25 Koçbank ISE National 30 Index Fund 0.001284 0.074147***
26 Meksa Variable Fund -0.003064 0.021781
27 Nurol Variable Fund 0.000369 0.044067
28 Pamukbank Variable Fund -0.003287 0.027284
29 Strateji Variable Fund -0.000803 0.019200
30 Şekerbank Variable Fund -0.000521 0.060213*** 31 T. Dış Ticaret Bankası Variable Fund 0.001342 0.069027*** 32 T. Dış Ticaret Bankası Mixed Fund 0.001052 0.033703 33 T. Ekonomi Bnk. Nv Turkse Perenco Variable Fund 0.001934** 0.076435*** 34 T. Garanti Bankası Variable Fund 0.002048 0.001392 35 T. Garanti Bankası Mixed Fund 0.002071* 0.020461 36 T. Halk Bankası Mixed Fund 0.000997 0.124427*** 37 T. İş Bankası Variable Fund 0.000647 0.054835***
38 T. İş Bankası Equity Fund 0.000354 0.045424
39 Tacirler Variable Fund 0.002641 0.050470***
40 Tacirler Mixed Fund 0.002021 0.099211***
41 Taib Variable Fund 0.001236 0.003590
42 Tekstil Bankası Equity Fund -0.000948 0.030391 43 Türk Ekonomi Bankası Variable Fund 0.001181 0.016616 44 Türk Ekonomi Bankası Mixed Fund 0.001024 0.037109 45 Türkiye Kalkınma Bankası Variable Fund 0.000676 0.028064 46 Yapı ve Kredi Bankası Mixed Fund -0.000046 0.040435 47 Yapı Kredi Inv. Variable Fund 0.000668 0.023827 48 Yatırım Finansman Resan Private Fund 0.004409* 0.137893*** 49 Yatırım Finansman Variable Fund -0.000746 0.016499 *: .15 level of significance, **: .10 level of significance, ***: .05 level of significance
41
Table 6: Summary of the Results of Selectivity and Market Timing Abilities of Mutual Fund Managers Selectivity (αj) Timing (ρ) Method Mean Positive (Significant at .10) Negative (Significant at .10) Mean Significant at .05 Without Timing -0.000539 1 4 - -
Both Timing and Selectivity without Adjustment for Heteroskedasticity
0.000543 3 - 0.095207 20
Both Timing and Selectivity with Adjustment for Heteroskedasticity
0.000347 1 - 0.046668 22
The correlation between the selectivity and market-timing measures for the efficient model is 0.287, which indicates that there is no support for the existence of specialization for mutual fund managers in one of the abilities.
5.2. Determinants of Selectivity and Market Timing
In this section, determinants of the selectivity and market timing abilities of the mutual fund managers are analyzed by using fund-specific factors such as management fee ratios and experience. For this purpose, measures for the related abilities which are derived in the previous parts of the study are regressed on these cross sectional variables. Following models are used to obtain the fund-specific factors’ effect on the abilities:
42 , 3 6 2 5 1 4 3 2 1 0 j j j j j =
β
+β
MF +β
EX +β
APV +β
D +β
D +β
D +uα
(24) 3 6 2 5 1 4 3 2 1 0 j j j j j =β
+β
MF +β
EX +β
APV +β
D +β
D +β
D +uρ
(25)where MF is the management fee ratio, EX is institutional experience and APV is the average portfolio value as a proxy for the size of each mutual fund. D1 stands for a dummy for the mutual funds owned by banks. D2 and D3 are the dummy variables for stock-index funds and variable funds. Typically, A-Type mutual funds are categorized in 3 groups. These are stock-index, mixed and variable funds. Stock-index funds have strict restrictions for holding risky assets in their portfolios while variable funds have the most freedom to change asset weights in their portfolios. In this respect, dummy variables are used only for the most and least restricted ones to avoid dummy trap. Regression results are presented at the Table-7 below.
The most interesting result is that management fee ratios have a significantly negative effect for both selectivity and market timing. Under these results, it seems that mutual fund managers are not receiving fees consistent with their performance on these two essential management abilities. On the other hand, size of the fund has a negative effect on timing but positive on selectivity as expected. However, the coefficient is not significant. This result is also quite expected because bigger funds have difficulties in terms flexibility. Also, stock-index funds have worse selectivity performance than the others.
43
Table 7: Results of the regressions of Ability Measures to Cross Sectional Variables
Variable Name Selectivity Market Timing
Coefficient t-value Coefficient t-value
Intercept 0.002675 2.73 0.097243 4.61
Management Fee Ratio -17.07119 -3.16 -304.2618 -2.61
Experience 0.00000038 1.51 0.0000093 1.73
Size (Average Portfolio Value, million TL) 0.0000322 1.26 -0.000735 -1.34 Bank -0.000252 -0.49 -0.013970 -1.26 Stock-Index Funds -0.001351 -2.09 -0.007300 -0.52 Variable Funds -0.000335 -0.62 -0.013606 -1.18 R2 0.370950 0.211662
Another important result in this model is the role of experience. Experience seems to have a positive effect on both “ability” parameters. But the effect is more significant on market timing and this means more experienced mutual funds have better macro perspectives than the less experienced funds.
Also, in terms of market timing, variable funds, which have more space to change asset weights in their portfolios have a worse record compared to the most restricted funds, which are stock-index funds. This result is also very surprising and indicates that variable funds could not use their options effectively.
Consistent with most of the previous studies it is found that selectivity and market timing abilities are related to each other. Because of this findings and the lack of explanatory power of the cross sectional regressions, Zellner’s (1962) seemingly
44
unrelated regression (SUR) is employed to these models to appreciate the potential effect of the omitted variables in these models and to get more efficient estimates. Results of SUR are shown at Table-8. SUR results have better t-values for all of the coefficients, so it gives more reliable estimates for the cross sectional parameters. Here, in this model, experience becomes even more effective for both abilities.
Table 8: Results of the SUR of Ability Measures to Cross Sectional Variables
Variable Name Selectivity Market Timing
Coefficient t-value Coefficient t-value
Intercept 0.002675 2.96 0.097243 5.01
Management Fee Ratio -17.07119 -3.43 -304.2618 -2.84
Experience 0.00000037 1.64 0.0000093 1.87
Size (Average Portfolio Value, million TL)
0.0000322 1.37 -0.000735 -1.46
Bank -0.000252 -0.53 -0.013970 -1.37
Stock-Index Funds -0.001351 -2.27 -0.0073 -0.57
45
CHAPTER SIX
CONCLUSION
In the literature, significant effort has been devoted to investigate the mutual fund managers’ abilities of micro and macro forecasting, namely selectivity and market timing. Most of the previous works analyzed the mutual funds in developed countries and in almost all of them monthly and yearly data were used.
In this study, selectivity and market timing performance of mutual fund managers of a developing country, Turkey, is analyzed. In addition, a different time horizon is used. By using the weekly data between 14 January 2000 and 24 October 2003 for 49 A-Type mutual funds, which are basically the funds that must hold risky assets, both ability parameters for each individual fund is evaluated by using the method first derived by Jensen (1972) then modified by Bhattacharya and Pfleiderer (1983). The sample period witnessed two major economic crisis of the country and the behavior of the mutual fund managers in such an environment of uncertainty is important.
46
Results of the relevant parameters suggest weak evidence about the existence of selectivity and some evidence for the superior timing quality for that period of time. Positive relation between these ability measures points out the lack of specialization in one of the abilities.
Then, by using the fund specific factors such as management fee ratio, experience and average value of the portfolios as a proxy for the size, the determinants of these abilities are analyzed.
Both OLS and SUR methods are used to obtain the effects of these cross sectional variables on the abilities. Results are surprising in terms of the effect of management fees. Unexpectedly, management fee ratio has a negative effect on both selectivity and market timing. This result causes suspicion about the performance based management fee regime of the sector. Also, experience of a mutual fund has a significant effect on both abilities being more on market timing. On the other hand, size of a fund has a positive effect on selectivity and negative effect on market timing with statistically insignificant coefficients. Stock-index funds have worse selectivity measures than the other types of A-Type mutual funds.