Science
PAPER
Cite this:Biomater. Sci., 2016, 4, 1328
Received 14th March 2016, Accepted 13th July 2016 DOI: 10.1039/c6bm00179c www.rsc.org/biomaterialsscience
A glycosaminoglycan mimetic peptide nano
fiber
gel as an osteoinductive sca
ffold†
Gulistan Tansik,
aErden Kilic,
bMustafa Beter,
aBahtiyar Demiralp,
cGullu Kiziltas Sendur,
d,eNuray Can,
fHuseyin Ozkan,
fElif Ergul,
aMustafa O. Guler*
aand Ayse B. Tekinay*
aBiomineralization of the extracellular matrix (ECM) plays a crucial role in bone formation. Functional and structural biomimetic native bone ECM components can therefore be used to change the fate of stem cells and induce bone regeneration and mineralization. Glycosaminoglycan (GAG) mimetic peptide nanofibers can interact with several growth factors. These nanostructures are capable of enhancing the osteogenic activity and mineral deposition of osteoblastic cells, which is indicative of their potential appli-cation in bone tissue regeneration. In this study, we investigated the potential of GAG-mimetic peptide nanofibers to promote the osteogenic differentiation of rat mesenchymal stem cells (rMSCs) in vitro and enhance the bone regeneration and biomineralization processin vivo in a rabbit tibial bone defect model. Alkaline phosphatase (ALP) activity and Alizarin red staining results suggested that osteogenic di fferen-tiation is enhanced when rMSCs are cultured on GAG-mimetic peptide nanofibers. Moreover, osteogenic marker genes were shown to be upregulated in the presence of the peptide nanofiber system. Histo-logical and micro-computed tomography (Micro-CT) observations of regenerated bone defects in rabbit tibia bone also suggested that the injection of a GAG-mimetic nanofiber gel supports cortical bone de-position by enhancing the secretion of an inorganic mineral matrix. The volume of the repaired cortical bone was higher in GAG-PA gel injected animals. The overall results indicate that GAG-mimetic peptide nanofibers can be utilized effectively as a new bioactive platform for bone regeneration.
1.
Introduction
Bone tissue defects can occur as a result of trauma, organic bone diseases, infectious diseases, and surgeries. The treat-ment of bone defects is a major reconstructive challenge in the field of orthopedics.1 While the gold standard of clinical care is the autograft, the use of autografts, xenografts and allo-grafts is limited due to their lack of availability, the risk of infections, donor site morbidity, and the potential of
trans-plant rejection.2 These problems can be overcome by using scaffolds made of synthetic or natural biomaterials promoting the migration, proliferation, and differentiation of bone cells.3,4 Advances in nanotechnology and tissue engineering offer promising options for the regeneration and replacement of damaged bone.5
Supramolecular peptide nanofiber systems are used as syn-thetic scaffolds in regenerative medicine applications because of their tailorable properties and ability to mimic ECM proteins.6–9 Peptide nanofibers are attractive for regeneration of bone defects because bone is a composite consisting of a protein based soft template (i.e., a mixture of collagen, non-collagenous proteins (laminin, fibronectin, vitronectin) and water) and hard inorganic components (hydroxyapatite (HA), Ca10(PO4)6(OH)2).10,11 70% of the bone inorganic matrix is
composed of HA crystals, which are typically 30–50 nm long and 1.5–4 nm thick.12Other protein components in the bone ECM are also in the nanometer scale, and the adhesion, pro-liferation and differentiation of resident mesenchymal stem cells (MSCs), osteoblasts, osteoclasts and fibroblasts are known to be affected by this self-assembled nanostructured ECM. Bone tissue contains less than 1% glycosaminoglycans (GAGs)13,14consisting of about 90% chondroitin-4-sulfate and
†Electronic supplementary information (ESI) available. See DOI: 10.1039/c6bm00179c
aInstitute of Materials Science and Nanotechnology, National Nanotechnology
Research Center (UNAM), Bilkent University, Ankara 06800, Turkey. E-mail: [email protected], [email protected]; Fax: +90 312 266 4365; Tel: +90 312 290 8985
bYuzuncuyil Hospital, Ankara 06530, Turkey
cDepartment of Orthopedics and Traumatology, Istanbul Medipol University,
Istanbul 34718, Turkey
dFaculty of Engineering and Sciences, Sabanci University, Istanbul 34956, Turkey eSabanci University Nanotechnology Research and Application Center,
Istanbul 34956, Turkey
fDepartment of Orthopedics and Traumatology, Gulhane Military Medical Academy,
Ankara 06010, Turkey
View Article Online
small amounts of hyaluronic acid, chondroitin-6-sulfate, and dermatan sulfate.15GAGs have significant regulatory roles in the development and regeneration of bone tissue. They exhibit complex effects on the behavior of bone cells at all stages of their differentiation, and facilitate the attraction and adhesion of precursor cells, their subsequent differentiation and their interactions with other proteins.16Sulfated GAGs, which are rich in negatively charged sulfate groups, are important for bone formation due to their ability to interact with growth factors such as FGF, BMPs, TGF-β1 and IGF-II, which are involved in regulating the osteoblastic cells. Sulfated GAGs work by binding to the positively charged amino groups of various proteins and growth factors, thus increasing their local availability.17,18
We have previously shown that GAG mimetic peptide nano-fibers can interact with several growth factors, including vascu-lar endothelial growth factor (VEGF), fibroblast growth factor-2 (FGF-2) and hepatocyte growth factor (HGF).19In addition, we have recently demonstrated that glycosaminoglycan mimetic peptide nanofibers are able to interact with bone morpho-genetic protein-2 (BMP-2), which is a critical growth factor for osteogenic activity.20 The GAG mimicking ability of the peptide nanofibers and their interaction with BMP-2 promoted osteogenic activity and mineralization by osteoblastic cells.20 Since MSCs have self-renewing capabilities and multi-lineage differentiation potential,21there is currently a strong need for
the fabrication of a biomaterial scaffold that is able to support and direct these cells towards the osteoblastic lineage. In this study, we show that GAG-mimetic peptide nanofibers can provide a suitable microenvironment for the osteogenic di ffer-entiation of rat mesenchymal stem cells (rMSCs). We also demonstrate that these nanofibers enhance bone regeneration and biomineralization in a rabbit tibial bone defect model.
2.
Materials & methods
2.1. Materials4-(2 ′,4′-Dimethoxyphenyl-aminomethyl)-phenoxyacetamido-norleucyl-MBHA resin (Rink amide MBHA resin), Fmoc-Asp(OtBu)-Wang resin, all protected amino acids, lauric acid, 2-(1H-benzotriazol-1-yl)-1,1,3,3-tetramethyluroniumhexafluoro-phosphate (HBTU), and diisopropylethylamine (DIEA) were purchased from Novabiochem, ABCR, or Sigma-Aldrich. Calcein-AM and other cell culture materials were purchased from Invitrogen. All other chemicals and materials used in this study were purchased from Thermo Scientific or Sigma-Aldrich.
2.2. Synthesis of peptide amphiphile (PA) molecules
The Fmoc solid phase peptide synthesis method was used to synthesize Ala-Gly-Lys-Am (K-PA), Lauryl-Val-Val-Ala-Gly-Glu (E-PA), and Lauryl-Val-Val-Lauryl-Val-Val-Ala-Gly-Glu-Gly-Asp (Lys-p-sulfobenzoate)-Ser-Am (GAG-PA). Rink amide MBHA resin (Novabiochem) was used as the solid support for K-PA and GAG-PA, while Fmoc-Glu(OtBu)-Wang resin (100–200 mesh)
served as the solid support for E-PA. Amino acid couplings were carried out with 2 molar equivalents of a Fmoc protected amino acid, 1.95 molar equivalents of HBTU, and 3 molar equivalents of DIEA for 3 h. The removal of the Fmoc protect-ing group on the Nα-amino group of the peptide was per-formed with addition of 20% piperidine in dimethylformamide (DMF) solution for 20 min. In order to block the remaining free amine groups after amino acid coup-ling, 10% acetic anhydride in DMF solution was used. The resin was washed by using DMF and dichloromethane (DCM) after each step. To synthesize GAG-PA, a p-sulfobenzoic acid residue was added to the side-chain of lysine. A lysine residue with a 4-methyltrityl (Mtt) side-chain protecting group was used for selective deprotection of amine groups. In order to remove Mtt, the resin was shaken for 5 min with trifluoroacetic acid (TFA) : triisopropylsilane (TIS) : H2O : DCM at a ratio of
5 : 2.5 : 2.5 : 90. The cleavage of PAs and protecting groups from the resin was carried out with a mixture of TFA : TIS : H2O at a
ratio of 95 : 2.5 : 2.5 for 2.5 h. Excess TFA was removed by rotary evaporation, and PAs were precipitated using ice-cold diethyl ether at−20 °C overnight. The precipitate was then col-lected by centrifugation, dissolved in ultrapure water and frozen at −80 °C overnight. The frozen samples were lyophi-lized for 4 days. The identity and purity of peptide amphi-philes were assessed by LC-MS (Agilent 6530-1200 Q-TOF) analysis. Mass spectra were obtained with an Agilent LC-MS equipped with an Agilent 6530 Q-TOF with an ESI source and Zorbax Extend-C18 2.1 mm × 50 mm column for basic con-ditions and a Zorbax SB-C8 4.6 mm × 100 mm column for acidic conditions. A gradient of water (0.1% formic acid or 0.1% NH4OH) and acetonitrile (0.1% formic acid or 0.1%
NH4OH) was used as the mobile phase. To purify the peptides,
an Agilent preparative reverse-phase HPLC system equipped with a Zorbax Extend-C18 21.2 mm × 150 mm column was used for basic conditions, and a Zorbax SB-C8 21.2 mm × 150 mm column was used for acidic conditions. A gradient of water (0.1% TFA or 0.1% NH4OH) and acetonitrile (0.1% TFA
or 0.1% NH4OH) was used as the mobile phase. Positively
charged PAs were treated with 0.1 M HCl solution and lyophi-lized to remove residual TFA.
2.3 Scanning electron microscope (SEM) imaging of PA nanofiber networks
SEM was used to observe the nanofiber networks formed by PAs. Samples were prepared on silicon wafer by mixing oppo-sitely charged PA solutions (10 mM) in a final volume of 60 µL. Briefly, GAG-PA and E-PA were mixed with K-PA at 1 : 3 and 1 : 2 ratios to stabilize all net charges. 15 min after gelation occurred, the samples were dehydrated by sequential treat-ment with 20%, 40%, 60%, 80% and 100% v/v ethanol. After the ethanol gradient exchange, critical point drying was performed by using an Autosamdri-815B critical point dryer (Tousimis). The dried samples were coated with 4 nm Au–Pd before imaging and images were taken by using a FEI Quanta 200 FEG scanning electron microscope at high vacuum mode with 5 keV beam energy.
2.4 Circular dichroism (CD)
CD samples were prepared by using 3 × 10⁻² mM GAG-PA/ 9 × 10⁻²mM K-PA and 3 × 10⁻²mM E-PA/6 × 10−2 mM K-PA mixtures, respectively. A JASCO J815 CD spectrometer was used at room temperature. The CD spectra of peptide solutions were recorded in a range of 300 nm to 190 nm, with a data interval and data pitch of 0.1 nm, and a scanning speed of 100 nm min−1, and all measurements representing three accumu-lations. Digital integration time was selected as 1 s, bandwidth as 1 nm, and the sensitivity was standard.
2.5 Fourier transform infrared (FT-IR) spectroscopy
FT-IR spectroscopy was used to obtain information about the secondary structures of PAs. Briefly, 10 mM gels formed on Petri dishes were frozen in liquid nitrogen and kept at −80 °C overnight. Following the freeze drying process, the dried samples were used to form pellets with KBr (100 mg KBr per 1 mg dried sample) and absorbance analysis was performed with a Bruker Vertex 70 FT-IR spectrometer in the 4000–400 cm−1range.
2.6 Cell culture and maintenance
The rMSCs (Invitrogen, passage number 7) were used in all cell culture experiments, including viability, calcium de-position and gene expression analyses. Cells were cultured in 75 cm2flasks at a density of 3 × 10³cells per cm2at 37 °C in a humidified incubator and supplied with 5% CO2. The rMSCs
were maintained in DMEM (low glucose) withL-glutamine
sup-plemented with 10% fetal bovine serum (FBS) and 1% penicil-lin/streptomycin. All cell experiments were carried out after the cells reached 90% confluency. The culture medium was changed every 3–4 days. Cells were seeded under the same con-ditions used for their maintenance. For mineralization experi-ment, gene expression analysis, actin staining and SEM imaging of cells the seeded cell medium was replaced with osteogenic medium (DMEM with 10% FBS supplemented with 10 mM β-glycerophosphate, 50 µg mL−1 ascorbic acid and 10 nM dexamethasone) after reaching confluency.
2.7 Tissue culture plate coating
Tissue culture plate (TCP) surfaces were coated with peptides at a concentration of 1 mM. To neutralize charges, GAG-PA and E-PA were mixed with K-PA at 1 : 3 and 1 : 2 volume ratios, respectively. After coating, the plates were placed in a fume hood overnight for drying, and sterilized with UV light for 1 h prior to cell culture experiments.
2.8 Viability assay
The viability of rMSCs incubated on PA coated and uncoated TCP was studied by the Live/Dead assay (Invitrogen). Briefly, the cells were seeded on PA-coated and uncoated 96-well tissue culture plates at a density of 5 × 10³cells per well. After 24, 48, and 72 h of incubation, the cell medium was discarded; the cells were washed with phosphate buffered saline (PBS) and then incubated with 2μM calcein-AM and 2 μM EthD-1 in
PBS for 30 min at room temperature. After incubation, images were taken at three random points per well with a fluorescent microscope (Zeiss, Axio Scope A1) at 10× magnification. All samples were analyzed in triplicate. Live and dead cells were counted by using Image J and the number of live cells was cal-culated for each sample.
2.9 Actin staining of rMSCs on PA nanofiber coated surfaces Glass coverslips were coated with PAs, and the cells were seeded on top of the coated and uncoated surfaces at a density of 3 × 10³cells per cm2. Before phalloidin/TO-PRO-3 staining, the cells were fixed with 4% formaldehyde for 15 min and per-meabilized with 0.1% Triton-X for 10 min at room tempera-ture. The samples were incubated with 3% (w/v) bovine serum albumin (BSA)/PBS for 30 min for blocking. Actin filaments of the cells were initially stained with FITC-conjugated phalloidin (Thermo Fisher) in 3% (w/v) BSA/PBS for 20 min. After serial washing steps, the samples were stained with TO-PRO-3 (Thermo Fisher) in PBS for 20 min for the visualization of nuclei. Coverslips were mounted with the Prolong Gold Anti-fade Reagent (Invitrogen). The cytoskeletal organization of the cells was observed using a Zeiss LSM 510 confocal microscope. Images were taken at 63× magnification.
2.10 SEM imaging of rMSCs on PA nanofiber coated surfaces The morphology and spreading of MSCs were examined by SEM imaging by using an ETD detector at high vacuum mode at 5 keV beam energy. For this purpose, glass coverslips were coated with PAs, and the cells were seeded on top of the coated and uncoated surfaces at a density of 3 × 10³ cells per cm2. 3 and 14 days after incubation, the cells were rinsed with PBS and fixed with 2% glutaraldehyde/PBS and 1 wt% OsO4for 1 h
each, respectively. The fixed cells were washed with water, and then dehydrated sequentially in 20%, 40%, 60%, 80%, and 100% ethanol. The samples were critical point dried with Auto-samdri-815B Tousimis and coated with 5 nm Au–Pd before imaging.
2.11 Alkaline phosphatase (ALP) activity assay
In order to measure the ALP activity of rMSCs, degradation of p-nitrophenol due to endogenous ALP activity was quantified after 7 and 14 days of culture in osteogenic medium. Briefly, the cells were seeded on PA nanofiber-coated and uncoated TCP surfaces at a density of 3 × 10³cells per cm2and the cell medium was replaced with osteogenic medium after the cells reached confluency. The cells were rinsed with PBS at pre-determined time points. An M-PER protein extraction kit (Thermo) with a 5% protease inhibitor solution was used to extract proteins. Supernatants containing the protein fraction were removed after centrifugation at 14 000g for 10 min. The Pierce BCA protein assay (Thermo) was performed to quantify the amount of protein obtained from the cells as described in the manufacturer’s protocol. To measure ALP activity, 50 µL of the protein sample was incubated with 150 µL of p-nitrophenol phosphate substrate in 96-well plates for 30 min on a shaker. Serial dilutions of p-nitrophenol in 0.25 M NaOH solution
were used as standards. Finally, the optical density of the samples was determined at 405 nm using a Spectramax M5 microplate reader and the ALP results were normalized to the total amount of protein at each time point tested.
2.12 Detection of mineralization by Alizarin red staining Calcium deposition on the surface of hydrogels was measured on days 14 and 28 using Alizarin red staining. Briefly, rMSCs were seeded on PA coated and uncoated TCPs at a density of 3 × 10³ cells per cm2 in DMEM medium con-taining 10% FBS and 1% penicillin–streptomycin. The cells were cultured in this medium until they reached confluency, and the medium was then replaced with fresh osteogenic medium. This medium was replenished every 3–4 days over the course of experiments. At predetermined time intervals, the cells were fixed with ice-cold ethanol for 1 h and stained with 40 mM Alizarin-red S for 30 min on a shaker. Afterwards the samples were washed 4–5 times with double distilled water to get rid of non-specific Alizarin-red binding. Calcium nodules were imaged in PBS under light microscopy. In order to quantify deposited calcium, PBS was discarded and the samples were incubated in 10% cetylpyridinium chloride for 30 min at room temperature. At the end of the incubation period, the solution was transferred to 96-well plates and absorbance measurements were performed at 562 nm. 2.13 Gene expression analysis
For gene expression studies, the surfaces of TCP were coated with each PA mixture. rMSCs were seeded at a density of 3 × 10³ cells per cm2. After the cells had reached confluency, their media were replaced with osteogenic medium. The gene expression profiles for osteogenic differentiation (Runx2, collagen I, and osteopontin) were evaluated by quantitative RT-PCR (qRT-PCR) analysis. RNA isolation from rMSCs seeded on the PA nanofibers and bare surfaces was performed by using TRIzol (Invitrogen) according to the manufacturer’s instructions after 7 and 14 days of incubation. The yield and purity of the extracted RNA were assessed by using Nanodrop 2000 (Thermo Scientific). The samples were diluted to a con-centration of 100 ngμL−1 prior to their use. Primers for PCR amplification of Runx2, collagen I, osteopontin and GAPDH are shown in Table 1. cDNA synthesis from RNA and qRT-PCR was performed using the SuperScript III Platinum SYBR Green
One-Step qRT-PCR kit according to the manufacturer’s instruc-tions. mRNA levels were calculated and normalized to GAPDH according to the comparative Ct method for each target gene. 2.14 In vivo experiments
In vivo experiments were carried out with 4 young adult New Zealand rabbits per group weighing between 2.8 and 3.2 kg. All animal studies were approved by Gülhane Military Medical Academy Animal Studies Ethical Committee, and all experi-ments were conducted in accordance with the NIH Guide for Care and Use of Laboratory Animals.
2.14.1. Surgical procedure. GAG-PA and K-PA molecules were dissolved in ddH2O at a concentration of 10 mM and
sterilized under UV light for 1 h. Rabbits were anesthetized with an intramuscular injection (IM) of 35 mg kg−1 of ketamine hydrochloride and 5 mg kg−1 of xylazine hydrochloride. The region of operation was shaved and aseptically prepared for operation. Under general anesthesia, a proximal tibial meta-physeal surgical defect (2 mm in diameter) was made on the right tibia of animals by using a surgical drill and PA solutions were injected into the tibial defects. Defect entrances were sutured (Vicryl 4–0 absorbable suture) after PA injections. In the physiological saline sham group, right tibial defects were formed in a similar fashion and sutured following the injec-tion of physiological saline. IM antibiotics were given to each rabbit for 3 days following the operation. All the tibias were examined regularly clinically for any sign of inflammation or infection for the duration of the study. GAG-PA/K-PA (n = 4) and physiological saline (n = 4) injected tibiae were surgically removed after 4 weeks for bone morphometric analysis and histology characterization. All rabbits were sacrificed with an intravenous injection of 100 mg kg−1 sodium pentobarbital. Tibiae were fixed with 10% formalin for 48 h and stored in 70% EtOH for Micro-CT measurements.
2.14.2 Micro computed tomography (Micro-CT) analysis. Micro-CT scans were performed to quantify new bone for-mation and mineral density within the defect. The distal meta-physeal regions of all tibiae were scanned at 81 kV and 124 µA using a Skyscan1172 Micro-CT scanner. Specimens were scanned using a 0.25 mm aluminium-copper filter and under 305 ms exposure time. For each specimen, a series of 660 pro-jection images were obtained with a rotation step of 0.7 three-frame averages and a total rotation of 360°. Each scan was pre-ceded by flat field correction for a specific zoom and image format. A stack of two-dimensional X-ray shadow projections was reconstructed using NRecon software v1.6.9.4 (Skyscan) and morphometrically analyzed using CTAn software v1.14.4.1 (Skyscan). During reconstruction, dynamic image range, post-alignment value, beam hardening and ring-artifact reduction were optimized for each experimental set. The defect region was manually identified in each bone and defined as the general volume of interest (VOI).
2.14.3 Histological analysis. For histological investigation, tibiae samples were decalcified with 14% EDTA solution and then embedded in paraffin. Tissues were sectioned with a Leica microtome at 5 µm thickness. Sections were
Table 1 Primers used for qRT-PCR expression analysis
Gene Primer sequence: forward/reverse
GAPDH 5′-GTGCCAGCCTCGTCTCATA-3′ 5′-AACTTGCCGTGGGTAGAGTC-3′ Runx2 5′-GGACGAGGCAAGAGTTTCACT-3′ 5′-CCCTAAATCACTGAGGCGGT-3′ Collagen I 5′-TGACTGGAAGAGCGGAGAGT-3′ 5′-GGTCATGCTCTCTCCAAACC-3′ Osteopontin 5′-AGTTTGGCAGCTCAGAGGAG-3′ 5′-TGCTTGGAAGAGTTTCTTGCTT-3′
deparaffinized in xylene and rehydrated in serial ethanol solu-tions for hematoxylin and eosin (H&E) staining. Slides were assessed at 5× objective magnification for area analysis by using Image-J software. A 1 mm × 2 mm sized area including the defect site as the centre is drawn. Quantification was carried out by measuring the pink area percentage in the defined site of the bone defect area for every sample. For Masson’s trichrome staining, paraffin embedded slides were fixed in Bouin’s solution. After incubation in Weigert’s iron hematoxylin solution, the slides were stained with Biebrich Scarlet-Acid Fuchsin and aniline blue and dehydrated in ethanol and xylene. The samples were washed extensively between each staining. The collagen fibers were stained blue and the nuclei were stained black under this staining protocol. For Alcian blue staining, sections were stained for 30 min with Alcian blue solution (1 g of Alcian blue 8GX (Sigma, UK) dis-solved in 3% glacial acetic acid (Sigma, UK)), washed in running tap water for 2 min and counterstained with nuclear fast red stain (Sigma, UK) for 5 min. Finally, the slides were washed for 1 min in running tap water. All sections were imaged under microscopy.
2.15 Statistical analysis
All quantitative values are presented as mean ± SEM (standard error of mean), and all experiments were performed with at least three replicates. Two-way analysis of variance (ANOVA) was used for the statistical analysis of viability tests, quantifi-cation of mineral deposition and gene expression studies. Quantification of cortical bone formation results was analyzed using the Mann–Whitney U-test. A p value of less than 0.05 was considered statistically significant. All statistical tests were performed using Graph-pad Prism v5.0.
3.
Results
3.1 Characterization of peptide amphiphile (PA) molecules and self-assembled PA nanofibers
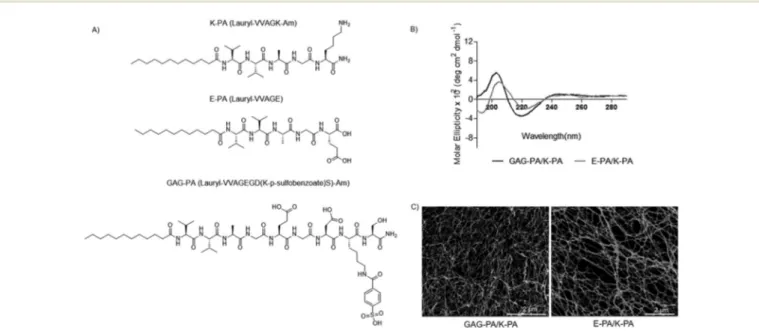
In this study, glycosaminoglycan-mimetic and control peptide amphiphile (PA) molecules were synthesized using the solid phase peptide synthesis method. GAG-PA (Lauryl-VVAGEGD(K-p-sulfobenzoate)S)-Am) was used to mimic sulfated glycosami-noglycans (GAGs) by presenting functional groups such as sul-fonate, hydroxyl and carboxylate moieties, while E-PA (Lauryl-VVAGE) was used to present carboxylate groups and had no sulfonate groups.20 K-PA, a positively charged molecule was used in order to induce nanofiber formation together with negatively charged PAs through electrostatic interactions (Fig. 1A). GAG-PA and E-PA molecules form nanofibers through self-assembly when mixed with K-PA. All PA molecules were characterized by liquid chromatography-mass spec-trometry (LC-MS) and purified by preparative HPLC (Fig. S1– S3†). For charge neutralization, GAG-PA was mixed with K-PA at a 1 : 3 ratio to form GAG-PA/K-PA nanofibers, while E-PA and K-PA were mixed at a 1 : 2 ratio to form E-PA/K-PA nanofibers. Porous nanofiber networks were formed upon mixing oppositely charged PA molecules, as demonstrated by SEM images (Fig. 1C). CD spectra were acquired to explore the secondary structures of self-assembled PA net-works, and suggest that the β-sheet structure with a chiral absorbance maximum at around 200 nm and minimum at around 220 nm, is the predominant secondary structure for both GAG-mimetic nanofibers and control nanofibers (Fig. 1B). The FT-IR spectra of all PAs exhibit amide I, amide II and amide A bands. The amide I band is uniquely useful for analysis of protein secondary structural composition and conformational changes.22 The bands in the regions of
Fig. 1 Design of peptide amphiphile molecules (PA). (A) Chemical structures of molecules. (B) CD measurements of the PA samples, demonstrating a predominance ofβ-sheets in the PA nanofibers. (C) SEM images show the nanofibrous network.
1640–1620 cm−1 and 1695–1690 cm−1 have been assigned to β-sheets.23,24In our study, all peptide nanofibers have amide I
peaks located between the 1630–1640 cm−1region, indicating β-sheet organization and validating our CD results (Fig. S4†). 3.2 Cell behavior and viability on PA nanofibers
The effect of GAG-mimetic peptide nanofibers on the viability of rMSCs was tested by calcein AM staining at varying time points (24, 48 and 72 h). The rMSCs were viable on all surfaces over the three days period. We did not observe any significant difference in the viability of cells on different peptide nano-fiber scaffolds and bare glass surfaces at varying time points (Fig. S5 and S6†). These results showed that peptide nano-fibers provide a biocompatible environment.
SEM imaging and actin staining revealed that rMSCs had spread and showed the characteristic fibroblast-like phenotype of MSCs (i.e. a spindle-like morphology) after 3 days of incubation on PA nanofibers25(Fig. 2). Phalloidin staining showed that the cells adhere on PA nanofibers and form cytoskeletal attach-ments. From day 7 onward, the cells on GAG-PA/K-PA nanofibers were found to cluster together and form bone like nodules, which is one of the indicators of osteogenic differentiation26 (Fig. S7†). In contrast to our GAG-PA/K-PA observations, no clus-tering or nodule formation was present on E-PA/K-PA or TCP. 3.3 Alkaline phosphatase activity and mineralization on bioactive peptide nanofibers
Osteoblasts are the cells responsible for secreting organic and mineral matrices during new bone formation in vivo. MSCs
express characteristic markers during their differentiation into the osteoblastic lineage, which can be quantified to determine the extent of the differentiation process. The osteo-genic differentiation of MSCs occurs in three stages in vitro.27 A peak in the number of cells is seen in the first stage (days one to four). This is followed by early cell differentiation from days 5 to 14, which involves the transcription and protein expression of ALP, an enzyme that promotes mineralization by providing inorganic phosphate.27–29 Therefore, we tested the ALP activity of rMSCs cultured on GAG-PA/K-PA, E-PA/K-PA and TCP surfaces after 7 and 14 days of incubation in osteogenic medium. Maximum ALP activity was observed on day 7 for GAG-PA/K-PA, and was found to have decreased at day 14 (Fig. 3A). ALP activity starts to decline after this stage, and the final phase of osteogenic differentiation com-prises the deposition of calcium and phosphate from days 15 to 28.27,30 These calcium deposits can specifically be stained using Alizarin red S, which chelates Ca2+ and is a commonly used dye for the evaluation of bone mineraliz-ation.30,31Cells cultured on GAG-mimetic peptide nanofibers in the presence of osteogenic supplements showed matrix mineralization with intense Alizarin red staining (Fig. 3B and C), in contrast to control cultures, which stained negatively for Alizarin red.
3.4 Gene expression profiles of osteogenic markers
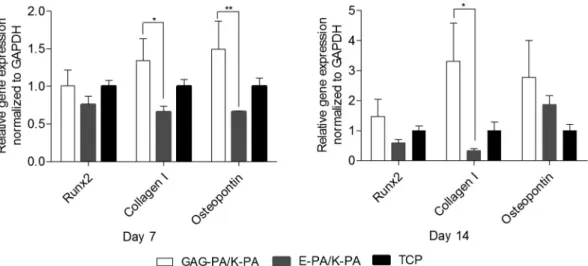
MSCs cultured in osteogenic media express markers also known to be expressed by bone-forming osteoblasts.32 To understand whether the GAG-mimetic peptide nanofiber systems were able to direct the differentiation of rMSCs towards the osteogenic lineage, the gene expression profiles of cells cultured on peptide nanofiber network coated and bare surfaces were analyzed and quantified. Expressions of the osteogenic markers Runt-related transcription factor 2 (Runx2), type I collagen (collagen I) and osteopontin were examined at the mRNA level on days 7 and 14 (Fig. 5). Runx2 is often referred to as the master switch of osteogenic di fferen-tiation33 and its expression is usually analyzed during the early phases of osteogenic differentiation. The expression of Runx2 was upregulated by∼1 and 1.5 fold, when rMSCs were cultured on GAG-PA/K-PA compared to the cells on TCP sur-faces on days 7 and 14, respectively. This value was also upre-gulated by ∼1.3 and 2.5 fold compared to the cells on E-PA/K-PA surfaces on days 7 and 14, respectively. The major organic component of bone ECM is type I collagen, which is secreted at an early stage of osteogenic differentiation, provid-ing a scaffold for mineral deposition.34,35 Osteopontin is a
highly phosphorylated sialoprotein that is a prominent com-ponent of the mineralized extracellular matrices of bones.36 Osteopontin expression was tested as a third osteogenic marker and found to be upregulated by∼1.5 and 2.8 fold for rMSCs cultured on GAG-PA/K-PA compared to the cells on TCP surfaces on days 7 and 14, respectively. This value was also significantly upregulated by ∼2.3 fold compared to the cells on E-PA/K-PA surfaces on day 7, and 1.5 fold on day 14. Studies on the temporal expression of osteopontin during
Fig. 2 Morphology of rMSCs on PA nanofibers and TCP after 3 days of incubation. Actinfilaments stained with phalloidin (green) and nuclei stained with TO-PRO-3 (blue) (A, C, and E). Scale bars are 20μm. SEM images of rMSCs on PA nanofibers and TCP (B, D, and F). Scale bars are 5μm.
the formation of bone in vitro and during the formation of intramembranous and endochondral bone in vivo have revealed a biphasic pattern in which osteopontin is produced early in the differentiation of bone cells, with higher levels expressed after mineralization has been initiated.36 More differences observed on day 7 are therefore consistent with previous studies. Mineralization can be initiated by the matrix vesicle budding from the plasma membrane of osteoblasts, which creates an environment suitable for the crystallization of calcium and phosphate.37Collagen can act as a template for this process, and may also initiate and propagate mineral-ization independent of the matrix vesicles.38In addition, this protein plays an important role in cell adhesion, proliferation, and differentiation into the osteoblast phenotype. Collagen I expression was significantly upregulated in the cells when they were cultured on GAG-PA/K-PA compared to TCP,
exhibit-ing an enhancement of ∼1.3 and 3.3 fold on days 7 and 14. This value was also upregulated by∼2 and 10 fold compared to the cells on E-PA/K-PA surfaces on days 7 and 14, respectively.
3.5 In vivo bone regeneration model
An ideal bone substitute should be tested both in vitro and in vivo prior to its evaluation in human beings to ensure its safety and effectiveness.39Tibial bone defect models are commonly used to study regeneration in long bones.40,41Rabbits are one of the most commonly used animal models, and rank first among all animals used for musculoskeletal research.42After testing our system in vitro, we checked the regeneration ability of GAG-mimetic peptide nanofibers using a rabbit tibial defect model. The non-bioactive (E-PA/K-PA) peptide nanofiber group did not enhance differentiation into the osteogenic lineage.
Fig. 3 Differentiation analyses of rMSCs on bioactive peptide nanofibers. (A) Impact of GAG-mimetic peptide nanofibers on alkaline phosphatase activity on days 7 and 14, *p < 0.05, ***p < 0.001. (B) Quantification of relative calcium deposition on peptide nanofibers and TCP on days 14 and 28, ***p < 0.001. (C) Biomineralization on peptide nanofibers and TCP on days 14 and 28 as demonstrated by Alizarin red staining. Scale bars are 100μm.
Therefore, the E-PA/K-PA group was not utilized in in vivo studies.
3.5.1 Quantification of bone formation by Micro-CT. We reconstructed three-dimensional images from Micro-CT data of the GAG-PA gel treated group and the physiological saline treated group for analyzing new bone formation (Fig. 7). The reconstructed 3-dimensional images showed that the GAG-PA gel treated group had more abundant cortical bone formation than the physiological saline treated group. In addition, the bone volume to total volume ratio (BV/TV), which indicates the portion of mineralized tissue, was assessed. In fact, the GAG-PA gel treated group has a statistically higher BV/TV than the physiological saline treated group (Fig. 6A). The BV/TV (%) value for the gel treated group was∼53%, while it was ∼19% for the physiological saline treated group (Fig. 6A). Bone mineral density (BMD) can be defined as the volumetric
density of calcium hydroxyapatite in a biological tissue in terms of g cm−3. In this study, Micro-CT quantifications have demonstrated that the animals receiving the GAG-PA gel treat-ment showed significantly higher BMD scores (∼1.03 g cm−3),
representing a 2.5 fold increase in the BMD score compared to the physiological saline treated group (∼0.41 g cm−3) (Fig. 6B).
3.5.2 Histological evaluation of regenerated bone. Histo-logical analyses were performed to investigate the regeneration process in tibial bone defects following GAG-PA gel and saline (control) treatment. The morphology of the damaged area and the formation of new bone ECM after surgery were examined by H&E staining. During bone healing, the soft, avascular carti-laginous callus is infiltrated by blood vessels and converted into woven bone, which is then gradually replaced by mature cortical bone.43 In our study, physiological saline-treated defects mostly exhibited woven bone formation with vascular
Fig. 5 Gene expression analysis of Runx2, collagen I, and osteopontin on days 7 and 14. The expression level of each gene was normalized against TCP and GAPDH was used as the internal control, *p < 0.05, **p < 0.01.
Fig. 6 Newly formed cortical bone analysis at the defect site of rabbit tibia after 4 weeks of GAG-PA gel treatment. (A) BV/TV (%). (B) BMD of cortical bone, *p < 0.05.
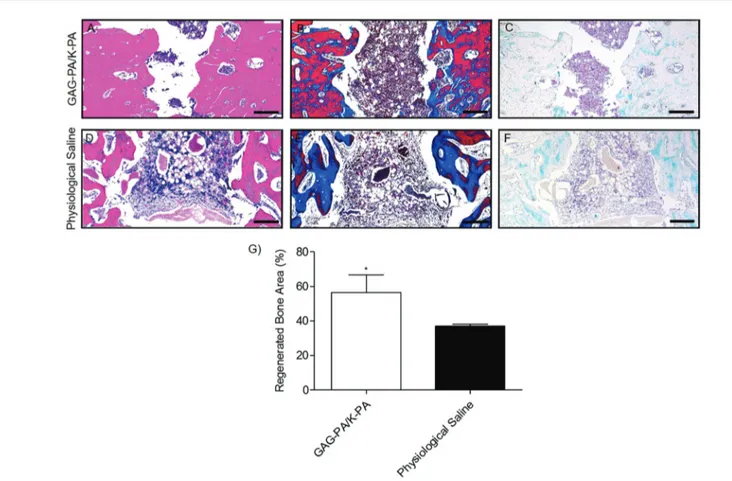
invasion, with a minor presence of lamellar bone formation (Fig. S8†). On the other hand, GAG-PA gel treatment largely enhanced the healing process resulting in the formation of cortical bone (Fig. 6A and S8†). Bone regeneration was also quantitatively evaluated by determining the percentage of regenerated area with respect to the original defect area using H&E results (Fig. 8G). On average, 56% of the initial defect was repaired in GAG-PA gel treated tibia, while this value was 37% for physiological saline. The measurements correlated with Micro-CT analysis which showed 54% new bone formation for the GAG-PA gel treated group on average. Masson’s trichrome staining studies showed that collagen deposition (as indicated by blue color) was prominent in tibial bone defects following both saline and GAG-PA gel treatments (Fig. 8B–E), indicating that the bone matrix is actively synthesized during the treat-ment period. In GAG-PA gel treated defects, the newly formed bone turned to a red color which shows that the new bone had undergone maturation.40Both defects also stained positive for Alcian blue (blue color, Fig. 8C–F); however, Alcian blue stain-ing was especially abundant in physiological saline treated defects (Fig. 8F), suggesting an association between bone regeneration and cartilage formation.40
Fig. 8 Histological evaluation of a tibial defect model after 4 weeks of GAG-PA gel treatment. Tissue sections of GAG-PA gel treated and physio-logical saline sham groups were stained with H&E (A, D) (black lines show regenerated area). Deposition of the bone matrix was confirmed by posi-tive staining of collagen with Masson’s trichrome staining (B, E). Endochondral ossification was observed by Alcian blue staining (C, F). Scale bars are 200 µm. Regenerated bone areas were quantified through the histological evaluation of H&E results (G), *p < 0.05.
Fig. 7 Representative Micro-CT images after 4 weeks of GAG-PA gel treatment. (A) Three-dimensional reconstruction images of one voxel of interest showing newly formed bone (grey color: the newly formed bone, black color: total defect volume). (B) NRecon images showing a defect site.
4.
Discussion
Scaffolds that mimic the structure and function of ECM com-ponents are able to improve cellular responses and show great promise in tissue engineering applications. Heparan sulfate (HS) is an important component of the bone ECM and assists in bone formation by providing structural support and control-ling the presentation of growth factors to cell surface recep-tors.44,45 This ability of HS makes it an attractive therapeutic agent for the treatment of bone defects, as HS is able to bind and present growth factors such as FGF and BMP that play critical roles in defect healing following fracture haematoma. However, the in vivo delivery of HS is not a well-controlled process. Consequently, we designed a synthetic scaffold, which mimics the structural and biochemical properties of sulfated glycosaminoglycans, and tested the efficiency of this system to assist in bone regeneration using an in vivo tibial bone defect model. The ability of self-assembled PA nanofibers to mimic natural ECM renders them attractive for regenerative medicine applications. PA nanofibers can be modified to meet the needs of a broad variety of tissues through the optimization of their functional peptide sequences. The PA molecules self-assemble into 1D nanostructures consisting of a fatty acid or a hydro-phobic moiety linked to a hydrophilic peptide sequence. High-aspect-ratio cylindrical nanofibers are observed when the peptide sequence includes amino acids with high β-sheet propensity. Screening of charged groups (by pH or ionic strength changes) results in a self-supporting gel formation, which is formed by a network of nanofibers with an enmeshed solvent.46 Hydrophobic collapse of alkyl groups and β-sheet formation between peptide molecules result in the formation of nanofibers in aqueous solutions, and short bioactive amino acid sequences can be presented at high densities on the surface of these nanofibers. Previously, we showed that heparin mimetic peptide nanofibers are able to bind BMP-2 better than E-PA/K-PA nanofibers, which may promote bone repair by increasing the local concentration of growth factors secreted by osteoblasts.20 A considerable difference was observed between the ALP activity of Saos-2 cells on GAG-PA/K-PA and E-PA/K-PA nanofibers, which is possibly due to the differentiative capacity of bioactive and non-bioactive PA networks to bind and present growth factors such as BMP-2.
During ossification, MSCs proliferate while staying in close proximity, which results in the formation of dense cellular aggregations or primary bone nodules. The MSCs in these nodules start to differentiate into osteoprogenitor cells and finally osteoblasts.26 MSCs on GAG-PA/K-PA gels start to aggregate from day 7 onwards and form bone nodules at day 14, as shown by phalloidin staining and SEM imaging (Fig. S7† and Fig. 4). MSCs have no extracellular calcium deposits, while differentiated osteoblasts are known to exten-sively deposit calcium crystals under both in vivo and in vitro conditions. Calcium deposits are therefore an indication of MSC towards osteoblast differentiation and in vitro bone for-mation. In this study, the cells cultured on GAG-mimetic peptide nanofibers in the presence of osteogenic
supple-ments showed higher matrix mineralization, suggesting that they were committed to the osteogenic lineage. On the other hand, the non-bioactive (E-PA/K-PA) peptide nanofiber group did not enhance differentiation into the osteogenic lineage. These results are consistent with our previous studies, in which GAG-mimetic peptide nanofibers were more effective in inducing osteogenic differentiation compared to the E-PA/K-PA group.20
In addition, ALP activity was considerably higher in the GAG-PA treated group compared to non-bioactive controls, and rMSCs undergoing differentiation on the GAG-PA nanofibers have revealed significant differences in the osteogenic gene expression profiles when compared to the E-PA group (Fig. 5), suggesting that the GAG-mimetic nanofiber scaffold had altered the differentiation pattern of the stem cells. This may be due to their ability to recruit growth factors such as BMP to increase the mRNA levels of downstream marker genes.47In addition, GAGs may facilitate osteoblast differentiation through Erk phosphorylation and Runx2 activity.
After testing our system in vitro, we checked the regener-ation ability of GAG-mimetic peptide nanofibers using a rabbit tibial defect model. Fracture healing is a regenerative process consisting of several phases, each involving the formation of a different type of tissue.43In the first phase, the inflammatory response facilitates the formation of a hematoma and granulation tissue. The second phase is characterized by the formation of a soft callus that consists of cartilaginous or chondroid tissue, while the third phase involves the ossifica-tion of the soft callus to form a hard or bony callus consisting primarily of woven bone tissue. Lastly, the final stage comprises a remodeling phase, in which the woven bone is gradually replaced by lamellar bone tissue. Although these four phases are temporally sequential, the healing process is not spatially uniform. Therefore, at any given time during healing, the fracture callus is composed of a highly hetero-geneous mixture of tissues.48 The regenerated tissue in GAG-PA gel-treated bone defects was predominated by cortical bone and had a greater mineral density compared to the physio-logical saline treated sham group, as shown by Micro-CT studies. It is therefore likely that the bioactive peptide matrix is able to increase the rate of bone mineralization and matu-ration. The rapid maturation rate of GAG-PA gel-treated tibial bone defects may be attributed to the ability of GAG-mimetic peptide nanofibers to enhance osteogenic differentiation, as our in vitro studies suggest that GAG-mimetic peptide nano-fibers induce significantly higher calcium deposition, osteo-genic marker gene expression and ALP activity in rMSCs. As Micro-CT analysis of bone tissue does not give full insight into cellular composition dynamics and the biochemical character-istics of newly formed bone, histological stainings were also performed to further characterize the repair process. Physio-logical saline-treated defects were mostly repaired with woven bone tissue, with small amounts of lamellar bone, as bone exhibits the capacity for self-renewal.40 On the other hand, GAG-PA gel treated defects were filled with a more compact form of bone, which indicates that the latter steps of bone
healing had taken place in bioactive gel-treated tibiae. In addition, Image J analysis of H&E staining results suggests that the defect gap is bridged to a greater extent in GAG-PA gel-treated gels (Fig. 8G), which supports our Micro-CT results (Fig. 6A). High growth factor (VEGF, BMPs, FGF-1 and TGF-β) binding capacity of the GAG-mimetic peptide nanofibers is a potential factor contributing to the efficacy of the GAG-PA gel treatment.19,20,49,50 The growth factor and nanofiber inter-action facilitates migration and invasion of multipotent MSCs originating from the periosteum, bone marrow, circulation, and the surrounding soft tissue.19,20,43 Thus, the enhanced growth factor binding ability and the nanofibrous morphology of the GAG-PA system are likely to be the cause of enhanced bone regeneration in the GAG-PA group compared to sham treatment.
Previously, Sawyer et al. showed bone healing within a rat calvarial defect by using polyε-caprolactone/tricalcium phos-phate (mPCL–TCP) scaffolds with recombinant human (rh) BMP-2. Semi-quantitative measurements of the traverse sec-tions demonstrated 30.6% ± 4.2 bone healing at 4 weeks.51 Hao et al. showed that rabbit radial defects were implanted with a combination of rabbit adipose-derived stem cells encap-sulated in collagen I gel with PLGA-β-TCP. After 8 weeks, the bone forming area was 44.2 ± 3.9%. After 16 weeks, the newly formed bone occupied 75.3 ± 2.6% of the total area and increased to 96.4 ± 2.3% eight weeks later.52Our model was able to induce 54% recovery within four weeks in a smaller defect; however, it should be noted that the present scaffold is cell-free and growth factor-free. Therefore, inclusion of cells and growth factors may further improve the success of the GAG-mimetic nanofiber system, which exhibits a high affinity for BMP-2 in particular. Further studies involving growth factor and cell encapsulation methods are therefore necessary to determine the full therapeutic potential of the present system.
5.
Conclusion
In summary, we have demonstrated that the GAG-mimetic peptide nanofiber system is able to provide a biocompatible and bioactive environment for promotion of osteogenic di ffer-entiation of stem cells. The rMSCs cultured on these peptide nanofibers exhibited enhanced alkaline phosphatase activity, calcium deposition, and osteogenic gene expression, which are the main indicators of bone-like mineralization. In addition, in vivo bone regeneration studies using this PA gel system demonstrated that GAG-PA gel treatment is associated with a rapid maturation rate, higher cortical bone formation and mineralization compared to the saline sham group. Therefore, the GAG-mimetic PA nanofiber gel is a promising candidate for the osteogenic differentiation of MSCs, and further studies regarding the in vivo efficiency of the PA nanofiber system may allow its use as an injectable scaffold to support the repair of bone defects in orthopedic applications.
Acknowledgements
We thank Z. Erdogan for her help in HPLC and MS. This work was funded by the Scientific and Technological Research Council of Turkey (TUBITAK) Grant No. 112T042 and 113S552. G. T. is supported by the TUBITAK-BIDEB (2211-C) Ph.D. fellowship. M. O. G. and A. B. T. acknowledge support from the Turkish Academy of Sciences Distinguished Young Scientist Award (TUBA-GEBIP).
References
1 K. Chaudhury, V. Kumar, J. Kandasamy and S. RoyChoudhury, Int. J. Nanomed., 2014, 9, 4153.
2 K. S. Griffin, K. M. Davis, T. O. McKinley, J. O. Anglen, T.-M. G. Chu, J. D. Boerckel and M. A. Kacena, Clin. Rev. Bone Miner. Metab., 2015, 13, 232–244.
3 C. J. Damien and J. R. Parsons, J. Appl. Biomater., 1991, 2, 187–208.
4 R. Langer and J. Vacanti, Science, 1993, 260, 920–926. 5 L. Zhang and T. J. Webster, Nano Today, 2009, 4, 66–80. 6 E. Arslan, I. C. Garip, G. Gulseren, A. B. Tekinay and
M. O. Guler, Adv. Healthcare Mater., 2014, 3, 1357– 1376.
7 J. B. Matson and S. I. Stupp, Chem. Commun., 2012, 48, 26–33.
8 M. Sever, B. Mammadov, M. O. Guler and A. B. Tekinay, Biomacromolecules, 2014, 15, 4480–4487.
9 S. Ustun Yaylaci, M. Sardan Ekiz, E. Arslan, N. Can, E. Kilic, H. Ozkan, I. Orujalipoor, S. İde, A. B. Tekinay and M. O. Guler, Biomacromolecules, 2015, 17, 679– 689.
10 T. Webster, in Nanostructured materials, ed. J. Y. Ying, Academic Press, California, 2001, p. 132.
11 S. Nath, in Advanced biomaterials: fundamentals, processing, and applications, ed. B. Basu, D. S. Katti and A. Kumar, John Wiley & Sons, New Jersey, 2010, ch. 3, pp. 57–58. 12 L. C. Palmer, C. J. Newcomb, S. R. Kaltz, E. D. Spoerke and
S. I. Stupp, Chem. Rev., 2008, 108, 4754–4783.
13 V. M. Mania, A. G. Kallivokas, C. Malavaki, A. P. Asimakopoulou, J. Kanakis, A. D. Theocharis, G. Klironomos, G. Gatzounis, A. Mouzaki and E. Panagiotopoulos, IUBMB Life, 2009, 61, 447–452.
14 M. R. van der Harst, P. A. Brama, C. H. van de Lest, G. H. Kiers, J. DeGroot and P. R. van Weeren, Osteoarthritis Cartilage, 2004, 12, 752–761.
15 C. W. Prince and J. M. Navia, J. Nutr., 1983, 113, 1576– 1582.
16 J. Salbach, T. D. Rachner, M. Rauner, U. Hempel, U. Anderegg, S. Franz, J.-C. Simon and L. C. Hofbauer, J. Mol. Med., 2012, 90, 625–635.
17 J. Taipale and J. Keski-Oja, FASEB J., 1997, 11, 51–59. 18 D. S. Benoit and K. S. Anseth, Acta Biomater., 2005, 1,
19 R. Mammadov, B. Mammadov, M. O. Guler and A. B. Tekinay, Biomacromolecules, 2012, 13, 3311–3319. 20 S. Kocabey, H. Ceylan, A. B. Tekinay and M. O. Guler, Acta
Biomater., 2013, 9, 9075–9085.
21 C. M. Kolf, E. Cho and R. S. Tuan, Arthritis Res. Ther., 2007, 9, 204.
22 G. Zandomeneghi, M. R. Krebs, M. G. McCammon and M. Fändrich, Protein Sci., 2004, 13, 3314–3321.
23 Y. Jiang, C. Li, X. Nguyen, S. Muzammil, E. Towers, J. Gabrielson and L. Narhi, J. Pharm. Sci., 2011, 100, 4631– 4641.
24 J. Kong and S. Yu, Acta Biochim. Biophys. Sin., 2007, 39, 549–559.
25 E. Alt, Y. Yan, S. Gehmert, Y. H. Song, A. Altman, S. Gehmert, D. Vykoukal and X. Bai, Biol. Cell, 2011, 103, 197–208.
26 E. R. Balmayor, in Mesenchymal Stem Cell Therapy, ed. L. G. Chase and M. C. Vemuri, Springer, New York, 2013, ch. 6, p. 102.
27 Z. Huang, E. R. Nelson, R. L. Smith and S. B. Goodman, Tissue Eng., 2007, 13, 2311–2320.
28 H. Orimo, J. Nippon Med. Sch., 2010, 77, 4–12.
29 J. E. Aubin, Rev. Endocr. Metab. Disord., 2001, 2, 81–94. 30 C. Hoemann, H. El-Gabalawy and M. McKee, Pathol. Biol.,
2009, 57, 318–323.
31 C. A. Gregory, W. G. Gunn, A. Peister and D. J. Prockop, Anal. Biochem., 2004, 329, 77–84.
32 E. Birmingham, G. Niebur and P. McHugh, Eur. Cells Mater., 2012, 23, 13–27.
33 P. Ducy, T. Schinke and G. Karsenty, Science, 2000, 289, 1501–1504.
34 S. Viguet-Carrin, P. Garnero and P. Delmas, Osteoporosis Int., 2006, 17, 319–336.
35 L. D. Quarles, D. A. Yohay, L. W. Lever, R. Caton and R. J. Wenstrup, J. Bone Miner. Res., 1992, 7, 683–692. 36 J. Sodek, B. Ganss and M. McKee, Crit. Rev. Oral Biol. Med.,
2000, 11, 279–303.
37 E. E. Golub, Biochim. Biophys. Acta, Gen. Subj., 2009, 1790, 1592–1598.
38 A. M. Ferreira, P. Gentile, V. Chiono and G. Ciardelli, Acta Biomater., 2012, 8, 3191–3200.
39 Y. Li, S.-K. Chen, L. Li, L. Qin, X.-L. Wang and Y.-X. Lai, J. Orthop. Transl., 2015, 3, 95–104.
40 J. Lim, J. Lee, H.-S. Yun, H.-I. Shin and E. K. Park, Tissue Eng. Regener. Med., 2013, 10, 336–340.
41 C. Balçik, T. Tokdemir, A.Şenköylü, N. Koç, M. Timuçin, S. Akin, P. Korkusuz and F. Korkusuz, Acta Biomater., 2007, 3, 985–996.
42 J. Neyt, J. A. Buckwalter and N. Carroll, Iowa Orthop. J., 1998, 18, 118.
43 A. Schindeler, M. M. McDonald, P. Bokko and D. G. Little, Semin. Cell Dev. Biol., 2008, 19, 459–466.
44 E. Luong-Van, L. Grøndahl, S. Song, V. Nurcombe and S. Cool, J. Mol. Histol., 2007, 38, 459–468.
45 C. Dombrowski, S. J. Song, P. Chuan, X. Lim, E. Susanto, A. A. Sawyer, M. A. Woodruff, D. W. Hutmacher, V. Nurcombe and S. M. Cool, Stem Cells Dev., 2009, 18, 661–670.
46 I. W. Fu, C. B. Markegard, B. K. Chu and H. D. Nguyen, Langmuir, 2014, 30, 7745–7754.
47 X. Wang, K. Harimoto, S. Xie, H. Cheng, J. Liu and Z. Wang, Biol. Pharm. Bull., 2010, 33, 1891–1897.
48 P. Leong and E. Morgan, Acta Biomater., 2008, 4, 1569– 1575.
49 L. C. Gerstenfeld, D. M. Cullinane, G. L. Barnes, D. T. Graves and T. A. Einhorn, J. Cell. Biochem., 2003, 88, 873–884.
50 M. M. Deckers, R. L. van Bezooijen, G. van der Horst, J. Hoogendam, C. van der Bent, S. E. Papapoulos and C. W. Löwik, Endocrinology, 2002, 143, 1545–1553.
51 A. Sawyer, S. Song, E. Susanto, P. Chuan, C. Lam, M. Woodruff, D. Hutmacher and S. Cool, Biomaterials, 2009, 30, 2479–2488.
52 W. Hao, L. Pang, M. Jiang, R. Lv, Z. Xiong and Y. Y. Hu, J. Orthop. Res., 2010, 28, 252–257.