Tar. Bil. Der.
Dergi web sayfası: www.agri.ankara.edu.tr/dergi
Journal homepage: www.agri.ankara.edu.tr/journal
Genetic Diversity and Population Structure of Fusarium oxysporum f. sp.
cepae
, the Causal Agent of Fusarium Basal Plate Rot on Onion, using
RAPD Markers
Harun BAYRAKTAR
Ankara University, Faculty of Agriculture,Department of Plant Protection, 06110 Ankara, TURKEY
ARTICLE INFO
Research Article Crop Production
Corresponding author: Harun BAYRAKTAR, e-mail: [email protected], Tel: +90(312) 596 12 70 Received: 24 May 2010, Received in revised form: 01 November 2010, Accepted: 10 November 2010
ABSTRACT
Fusarium basal plate rot caused by Fusarium oxysporum f. sp. cepae is an important disease of onion in many countries of the world. A total of 116 single spore isolates of Fusarium oxysporum f. sp. cepae representing seven populations from Turkey and one population from Colorado, USA were subjected to molecular marker analysis using Random Amplified Polymorphic DNA (RAPD) technique. Using eleven polymorphic primers, 110 RAPD fragments were obtained with an average of 10 polymorphic bands per primer. Cluster analysis with UPGMA revealed five distinct lineages at arbitrary level of 65% similarity. The majority of F. oxysporum f. sp. cepae isolates from Turkey were observed to derive probably from the same clonal lineage. Genetic estimates and population differences demonstrated that the isolates from Turkey were significantly distinct from Colorado isolates and that Bursa population was the most divergent among Turkish populations. Cluster analysis of Nei’s genetic distances supported populations grouping according to the geographical regions. Comparison of genetic differentiation estimates (HT:
0.140, HS: 0.124) revealed low levels of genetic differentiation among Turkish populations. Only, 11.4% of total
genetic diversity (GST) attributed to differentiation among the geographical populations. Analysis of molecular
variance (AMOVA) confirmed that there was low genetic differentiation among populations. The results suggest that RAPD-PCR is a useful method for analyzing genetic variation within and between populations of F. oxysporum f. sp. cepae.
Keywords: Fusarium basal rot; Genetic diversity; Onion; RAPD-PCR; Fusarium oxysporum f. sp. cepae
Soğanda Dip Çürüklüğü Etmeni Fusarium oxysporum f. sp. cepae’ daki
Genetik Farklılığının ve Popülasyon Yapısının RAPD Markörleri
Kullanılarak Đncelenmesi
ESER BĐLGĐSĐ
Araştırma Makalesi Bitkisel Üretim
Sorumlu Yazar: Harun BAYRAKTAR, e-posta: [email protected], Tel: +90(312) 596 12 70 Geliş tarihi: 24 Mayıs 2010, Düzeltmelerin gelişi: 01 Kasım 2010, Kabul: 10 Kasım 2010
ÖZET
Fusarium oxysporum f. sp. cepae’ nın sebep olduğu Fusarium dip çürüklüğü, dünyanın birçok ülkesinde soğan
T
A
R
IM
B
İL
İM
LE
R
İ
D
E
R
G
İS
İ
J
O
U
R
N
A
L
O
F
A
G
R
IC
U
LT
U
R
A
L
S
C
IE
N
C
E
S
16 ( 20 10 ) 13 9 -1 4 9
Fusarium oxysporum f. sp. cepae izolatı Random Amplified Polymorphic DNA (RAPD) tekniği kullanılarak moleküler markör analizi ile incelenmiştir. Kullanılan 11 polimorfik primer ile 110 RAPD fragmenti elde edilmiştir (10 polimorfik bant/primer). Elde edilen verilerin UPGMA ile cluster analizi % 5 benzerlik seviyesinde 5 farklı soy ortaya çıkarmıştır. Türkiye’den elde edilen Fusarium oxysporum f. sp. cepae izolatlarının büyük çoğunluğunun muhtemelen aynı klonal soydan türediği gözlemlenmiştir. Genetik değerlendirmeler ve popülasyon farklılıkları da Türkiye’ den elde edilen izolatların Colorado izolatlarından büyük ölçüde farklı olduğunu ve Bursa popülasyonunun Türkiye popülasyonları arasında en farklı popülasyon olduğunu göstermiştir. Nei’ nin genetik uzaklığına dayanan cluster analizi ise coğrafik bölgelere göre popülasyon gruplanmasını desteklemiştir. Genetik farklılık değerlerinin (HT:
0.140, HS: 0.124) karşılaştırılması ise Türkiye popülasyonları arasında düşük seviyelerde genetik farklılıklar ortaya
çıkarmıştır. Toplam genetik farklılığın sadece % 11.4’lük kısmının coğrafik popülasyonlar arasındaki farklılıklardan kaynaklandığı gözlemlenmiştir. Moleküler varyans analizi de (AMOVA) popülasyonlar arasındaki düşük genetik farklılıkları doğrulamıştır. Bu sonuçlar RAPD-PCR tekniğinin Fusarium oxysporum f. sp. cepae popülasyonları arasındaki ve içerisindeki genetik varyasyonun değerlendirilmesinde oldukça faydalı olduğunu göstermiştir.
Anahtar sözcükler: Fusarium dip çürüklüğü; Genetik farklılık; Soğan; RAPD-PCR; Fusarium oxysporum f. sp. cepae
© Ankara Üniversitesi Ziraat Fakültesi
1. Introduction
Onion (Allium cepa L.) is a crop of economic importance and widely grown in many countries. Turkey is a major onion producing country with a cultivated area of 95,000 ha and a production of 2
175,343 t yr-1 as dry and green onion (Faostat
2010). Fusarium oxysporum f. sp. cepae W.C Snyder & H.N Hansen, the causal agent of Fusarium basal rot is a common disease in onion growing regions worldwide, causing economically significant losses in both field and storage (Abawi & Lorbeer 1971; Sumner 1995). The pathogen infects the root and basal plate areas of onion plants. The disease symptoms include curving, wilting, yellowing, and eventually dying back of the leaves from the tips. In addition to onion, the pathogen can cause yield losses on other Allium species such as garlic, chive and shallot (Sumner 1995). Although F. oxysporum f. sp. cepae has a high degree of pathogenic variability on onion plants, the classification of different races has not been described yet (Sumner 1995; Özer et al 2004).
The most effective and economical strategy to control soil borne pathogens is the use of resistant cultivars. Some intermediate and long day onion cultivars have proved to be resistant to Fusarium basal rot while resistant short day cultivars are not developed. Also, several studies have been performed regarding the genetic structure of onion resistance, but have not exactly clarified the
resistance mechanism to the pathogen (Cramer 2000).
Genetic analysis of plant pathogen populations is fundamental to the improving of breeding programmes and disease management methods to control the pathogens. Different methods have been used to assess genetic variation within populations of F. oxysporum f. sp. cepae such as Vegetative
Compatibility Grouping (VCGs), Amplified
Fragment Length Polymorphisms (AFLPs),
Restriction Fragment Length Polymorphism
(RFLP) analysis of Internal Transcribed Spacer (ITS) and Intergenic Spacer (IGS) regions of rDNA (Swift et al 2002, Galván et al 2008; Dissanayake et al 2009, Bayraktar et al 2010). These studies have revealed that F. oxysporum f. sp. cepae, which includes different genetic lineages is a polyphyletic group. RAPD technique is a powerful genetic approach for population studies in fungi because it is simple, not expensive and easy to use. This method has been successfully used to resolve genetic variability within or between formae speciales of F. oxysporum (Assigbetse et al 1994; Bentley et al 1994; Cramer et al 2003). However, RAPD markers have not been used to detect phylogenetic groups within populations of this pathogen. Also, little information is known about the genetic complexity of F. oxysporum f. sp. cepae populations in Turkey and there is a gap for future studies to identify resistance sources to this pathogen.
The objective of the present study was to determine the geographical relationships and the extent of genetic diversity among isolates of F.
oxysporum f. sp. cepae using random amplified
polymorphic DNA markers.
2. Materials and Methods
2.1. Fungal isolates
One hundred isolates were recovered from infected onion bulbs collected from Bursa, Ankara, Eskişehir, Yozgat, Çorum, Tokat and Amasya provinces located in three regions of Turkey during 2007 surveys (Table 1 & Figure 1). The isolates were purified by single spore isolation and grown on potato dextrose agar (PDA) plates at 25°C in a 12 h dark/light cycle. Fungal cultures were preserved on filter papers at 8°C. Morphological identification was carried out according to Nelson et al (1983) and Leslie & Summerell (2006). Also, the identification was confirmed by PCR using species-specific FOF/R 1 primers, producing a single fragment of 340-bp (Mishra et al 2003). The pathogenicity of isolates was determined by seedling and bulb inoculation methods used in a previous study (Bayraktar et al 2010). Pathogenic variability among the isolates was found to vary from 1 to 5, most of them were highly virulent on onion plants. Also, the 16 Colorado isolates assigned into five VCG groups (Swift et al 2002) and provided by H. F. Schwartz at Colorado State University were included in this study (Table 1).
2.2. DNA extraction
Genomic DNA for PCR was extracted using a modified method of Reader & Broda (1985). Cultures were grown in 100 ml of potato dextrose broth medium on an orbital shaker (150 rpm) at 25°C for 7 days. Mycelia from cultures were collected on Miracloth by filtration and ground in liquid nitrogen. The powdered samples of mycelium were suspended in 500 µl of extraction buffer (200 mM Tris-HCl pH 8.5, 25 mM NaCl, 25 mM EDTA, 0.5% SDS) and incubated for 30 min at 65°C. After incubation, equal volume of phenol-chloroform-isoamylalcohol (25:24:1 v/v/v) was added into the mixture and centrifuged at 13 000 x
g for 15 min. The supernatant was incubated with
10 µl RNAse A (10 mg ml-1) to remove RNA at
37°C for 1 h. The suspension was re-extracted with chloroform-isoamylalcohol and centrifuged as above. The DNA was precipitated with isopropanol (1:1 v/v), rinsed with ethanol, suspended in TE buffer (10 mM Tris-HCl, 1mM EDTA, pH 8.0) and stored at -20°C until use.
2.3. Amplification conditions
RAPD analysis was performed in a total volume of 25 µl reaction containing 10x PCR buffer, 1.5 mM
of MgCl2, 0.32 µM of primer, 0.125 mM of dNTPs
and 0.6 unit of Taq DNA polymerase (MBI, Fermentas). Amplifications were carried out in a thermal cycler (Whatman-Biometra Model T1, Goettingen, Germany) programmed as follows: 40 cycles of 94°C 20 sec, 36°C 1 min, 72°C 1 min and followed by an extension step of 8 min 72°C. Thirty eight primers selected from different sets (Operon Technologies Inc. Alameda, CA.) were evaluated for their ability to produce polymorphic bands on a subset of 15 isolates.
The PCR products were separated
electrophoretically at 100 V on 1.4% agarose gels in 1xTAE (40 mm Tris-acetate and 1.0 mm EDTA) buffer (Sambrook et al 1989). The gels were stained with ethidium bromide and visualized by Gene Tools bio-imaging system from SynGene software (Cambridge, England). All experiments were repeated twice.
2.4. Data analysis
The presence or absence of a given RAPD fragment was determined for each isolate. All scored bands were assembled in a rectangular data matrix. The genetic similarity matrix was created with Jaccard’s coefficient of similarity and subjected to cluster analysis with an unweighted pair-grouped method with arithmetic average (UPGMA) to generate a dendrogram using NTSYS-pc numerical taxonomy package, ver. 2.0 (Rohlf 1998). Genetic diversity and population differentiation parameters were calculated using Popgene software ver. 1.32 (Yeh et al 1999). The estimates of Nei’s (1973) gene diversity (h), Shannon’s information index (I), polymorphic loci (%), genetic distance and genetic
identity, total gene diversity (HT), gene diversity
Table 1-Geographical origin and the number of Fusarium oxysporum f. sp. cepae isolates used in this study
Çizelge 1-Çalışmada kullanılan Fusarium oxysporum f. sp. cepae izolatlarının coğrafik orjinleri ve sayısı
Regions Populations Isolate code Total
Marmara Bursa s1, s7, s9, s13, s18, s20, s21, s23, s24, s25, s26, s27, s75, s79, s81, s82, s86, s87, s88, s103, s105 21 Çorum s2, s5, s6 (VCG 0423), s8, s10, s28, s29, s31, s32, s38, s74, s80, s93, s96, s101 15 Amasya s17, s19, s45, s48, s49, s51, s52, s53, s54, s56, s57, s58, s59, s60, s62, s63, s66, s69, s72, s73, s85, s92, s94, s97 24 Black Sea Tokat s4, s12, s14, s37, s30, s84, s90, s102 8 Ankara s64, s65, s67, s68, s70, s76, s77, s78, s104, s106 10 Eskişehir s3, s15, s16, s41, s42, s43, s46, s47, s91, s98, s100 11 Central Anatolia Yozgat s33, s34, s35, s36, s39, s40, s44, s71, s83, s89, s99 11 Coloradoa 22, 25, 27, 28, 201a, 201d, 204a 31, 32 41, 42, 47, 48, 50 21 23 VCG 0421 0422 0423 4 5
a Isolates from Colorado (Swift et al 2002) were provided by H. F. Schwartz at Colorado State University
Figure 1-Map showing locations of seven populations of Fusarium oxysporum f. sp. cepae sampled from Turkey
Şekil 1-Türkiye’ den örneklenen Fusarium oxysporum f. sp. cepae’ nın yedi popülasyonunun
yerlerini belirten harita
(GST), and gene flow (NM) were calculated among
populations of F. oxysporum f. sp. cepae. UPGMA cluster analysis of Nei’s (1972) genetic distances was generated to represent the relationships among
eight populations. Analysis of molecular variance (AMOVA) between and within populations was performed by the program Arlequin ver. 3.0 (Excoffier et al 2005) using 1023 permutations.
3. Results
3.1. Genetic diversity
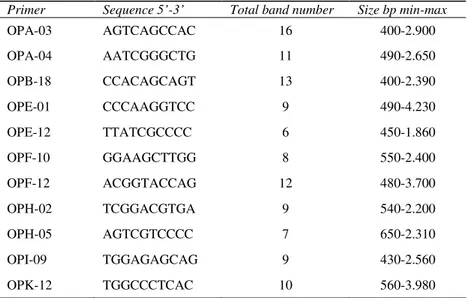
Among 38 primers tested on a subset of 15 isolates, the eleven primers that gave reproducible and scorable polymorphisms were used for molecular analysis of all isolates (Table 2). These primers produced a total of 110 reproducible fragments among the 116 isolates of F. oxysporum f. sp.
cepae, all of them were polymorphic, giving a ratio
of 10 polymorphic bands/primer. Among the eleven primers, the most informative primer was OPA-3, producing 16 polymorphic bands while primer OPE-12 was the least informative primer with 6 fragments. The size of RAPD fragments ranged from 400 to 4.230 bp.
RAPD analysis of genomic DNA from the pathogenic isolates revealed the presence of five lineages at the arbitrary level of 65% similarity (Figure 2). Lineage A consisted of two isolates, 22 (VCG 0421) and 23 from Colorado. Lineage B included all isolates representing VCG 0422 and VCG 0423 as well as isolate s20. Eight isolates from five provinces of Turkey clustered into lineage C together with VCG 0421 isolates and isolate 21 from Colorado. Lineage D was the largest cluster occupying 64.66% of total samples. Isolate s58 was the most divergent in this lineage. Lineage E consisted of 15 isolates from different provinces. However, there was no correlation between clustering in dendrogram, pathogenic variability and geographical origin of the tested isolates. The
cophenetic correlation coefficient between
Jaccard’s similarity matrices and the dendrogram of RAPD data was r=0.98, showing very good fit.
3.2. Population structure of F. oxysporum f. sp.
cepae
The polymorphic loci in each population ranged from 20.91% to 84.55% with an average of 51.36%
(Table 3). Colorado population showed the highest
percentage of polymorphic loci among all populations while Eskişehir population exhibited the lowest amount of polymorphism. Similarly, it was observed that the estimates of Turkish populations were much lower than Colorado population. The estimates of gene diversity (h) for all loci in each of the Turkish populations ranged
from 0.056 (Eskişehir) to 0.199 (Bursa). The value of Colorado population was 0.346. The gene diversity index calculated for all populations was 0.21. Similarly, the values of Shannon information index (I) were similar to Nei’s (1973) gene diversity index for all geographical populations, ranging from 0.089 to 0.498 among all populations.
The total gene diversity (HT) was 0.195 ±0.016
for all populations of F. oxysporum f. sp. cepae.
The mean within-population gene diversity (HS)
was 0.152±0.012, which accounted for 77.95% of the total genetic diversity (Table 3). The proportion of the total genetic diversity attributable to the
population differentiation (GST) was 0.223 over all
loci. When population structure was analyzed by excluding the Colorado population, the mean total
and within gene diversities (HT, HS) were
0.140±0.020 and 0.124±0.015 among all Turkish populations. Only, 11.4% of the total gene diversity
(GST) was attributed to differences among
populations.
Genetic analysis showed that the highest genetic identity (0.993) occurred between populations Eskişehir and Yozgat while the lowest genetic identity (0.799) was recorded between populations Eskişehir and Colorado (Table 4). The UPGMA dendrogram based on Nei’s genetic distances among populations is shown in Figure 3. Colorado population clustered separately from Turkish populations in dendrogram while all Turkish populations sampled from the same geographical regions clustered together in dendrogram. The populations of Çorum, Amasya and Tokat located in Black Sea region were clustered to each other at the level of 0.013 genetic distance while Bursa population was closely related to three populations of Black Sea region, but formed a distinct subgroup with genetic distance of 0.019. The populations of Ankara, Eskişehir and Yozgat located in Central Anatolia region were very closely related and formed a different cluster of dendrogram with a low level (0.010) of genetic distance.
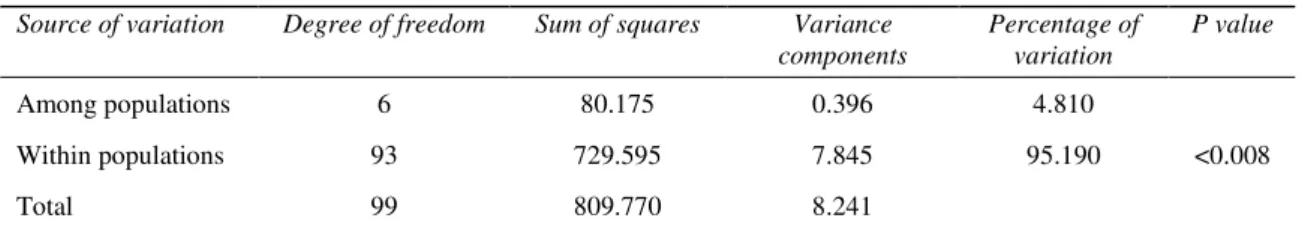
Results of AMOVA gave a nearly identical pattern of population differentiation; all RAPD variation was distributed among isolates (95.19%)
within populations (Table 5). Gene flow (NM) was
Table 2-Primers used and the number and size of bands obtained from Fusarium oxysporum f. sp. cepae isolates
Çizelge 2-Kullanılan primerler ve Fusarium oxysporum f. sp. cepae izolatlarından elde edilen bantların sayısı ve büyüklüğü
Primer Sequence 5’-3’ Total band number Size bp min-max
OPA-03 AGTCAGCCAC 16 400-2.900 OPA-04 AATCGGGCTG 11 490-2.650 OPB-18 CCACAGCAGT 13 400-2.390 OPE-01 CCCAAGGTCC 9 490-4.230 OPE-12 TTATCGCCCC 6 450-1.860 OPF-10 GGAAGCTTGG 8 550-2.400 OPF-12 ACGGTACCAG 12 480-3.700 OPH-02 TCGGACGTGA 9 540-2.200 OPH-05 AGTCGTCCCC 7 650-2.310 OPI-09 TGGAGAGCAG 9 430-2.560 OPK-12 TGGCCCTCAC 10 560-3.980
Table 3-Genetic diversity estimates within and among eight populations of Fusarium oxysporum f. sp. cepae
Çizelge 3-Fusarium oxysporum f. sp. cepae’ nın sekiz populasyonu arasındaki ve içindeki genetik farklılık tahminleri
Populations N Polymorphic loci, % h I
Bursa 21 77.27 0.199±0.184 0.312±0.251 Çorum 15 79.09 0.174±0.142 0.289±0.203 Amasya 24 51.82 0.143±0.172 0.224±0.252 Tokat 8 42.73 0.138±0.177 0.212±0.261 Ankara 10 30.91 0.095±0.160 0.147±0.236 Eskişehir 11 20.91 0.056±0.122 0.089±0.186 Yozgat 11 23.64 0.065±0.134 0.104±0.201 Colorado 16 84.55 0.346±0.195 0.498±0.260 Turkish populations HT: 0.140±0.020 HS: 0.124±0.015 GST: 0.114 All populations HT: 0.195±0.016 HS: 0.152±0.012 GST: 0.223
N: Number of isolates h: Nei’s (1973) gene diversity I: Shannon’s Information index (Lewontin 1972). HT: total gene
Figure 2-UPGMA dendrogram constructed for 116 isolates of Fusarium oxysporum f. sp. cepae sampled from Turkey and Colorado based on Jaccard’s coefficient of similarity
Şekil 2-Türkiye ve Colorado’ dan örneklenen Fusarium oxysporum f. sp. cepae’ nın 116 izolatı için Jaccard’ ın benzerlik katsayısı ile oluşturulan UPGMA dendogramı
0.0 0.3 0.5 0.7 1.0 22 23 31 32 48 42 50 s6 41 47 s20 25 27 28 201a 201d 204a s66 s73 s44 s90 s37 s57 s68 21 s27 s1 s47 s31 s2 s70 s19 s17 s72 s18 s41 s48 s77 s83 s34 s40 s7 s64 s8 s14 s10 s33 s39 s36 s15 s78 s97 s42 s94 s46 s100 s56 s52 s71 s98 s99 s85 s96 s101 s102 s79 s89 s35 s93 s87 s91 s106 s81 s3 s5 s16 s84 s28 s43 s24 s51 s67 s82 s86 s21 s30 s45 s32 s53 s104 s74 s12 s65 s103 s75 s59 s62 s76 s29 s60 s58 s4 s38 s9 s23 s25 s26 s13 s88 s80 s92 s69 s63 s54 s49 s105 Lineage A Lineage C Lineage D Lineage E Lineage B
Table 4-Genetic identity between pairwise combinations of Fusarium oxysporum f. sp. cepae populations
Çizelge 4-Fusarium oxysporum f. sp. cepae’ nın populasyon çiftleri arasındaki genetik benzerlik
Populations Bursa Çorum Amasya Tokat Ankara Eskişehir Yozgat
Çorum 0.983 Amasya 0.985 0.989 Tokat 0.974 0981 0.988 Ankara 0.967 0.987 0.986 0.981 Eskişehir 0.952 0.984 0.979 0.972 0.987 Yozgat 0.954 0.983 0.980 0.973 0.988 0.993 Colorado 0.841 0.846 0.821 0.824 0.814 0.799 0.806
Figure 3-Dendrogram based on Nei’s genetic distance showing relationships among the eight geographic populations of Fusarium oxysporum f. sp. cepae
Şekil 3-Fusarium oxysporum f. sp. cepae’ nın sekiz coğrafik popülasyonu arasındaki ilişkiyi
göstermek için Nei’ nin genetik uzaklığı ile oluşturulan dendogram
Table 5-The AMOVA results for seven populations of Fusarium oxysporum f. sp. cepae from Turkey
Çizelge 5-Fusarium oxysporum f. sp. cepae’ nın yedi Türkiye populasyonu için belirlenen AMOVA sonuçları Source of variation Degree of freedom Sum of squares Variance
components Percentage of variation P value Among populations 6 80.175 0.396 4.810 Within populations 93 729.595 7.845 95.190 <0.008 Total 99 809.770 8.241
P value, probability of obtaining equal or larger value determined by 1.023 permutations
Colorado Bursa Çorum Amasya Yozgat Tokat Eskişehir Ankara Regions Marmara BlackSea Central Anatolia
4. Discussion
In this study, genetic diversity within and among eight F. oxysporum f. sp. cepae populations sampled from Turkey and Colorado, USA was evaluated using RAPD markers. The RAPD procedure proved to be a useful tool for assessing genetic variability within this pathogen. Earlier to this, a high level of VCG diversity was observed among Turkish isolates, all isolates constituted unique VCGs except for one isolate. Also, a broad pathogenic and genetic diversity was detected among isolates of F. oxysporum f. sp. cepae. Restriction digests on IGS region of rDNA classified the isolates from Turkey and Colorado into 13 groups (Bayraktar et al 2010).
The results obtained in this study indicated a high degree of genetic variability within populations of F. oxysporum f. sp. cepae. All isolates clustered into five lineages in the dendrogram. A higher level of genetic diversity was observed among the isolates from Colorado than Turkish isolates. The sixteen isolates representing VCGs from 5 groups classified into three lineages related to VCG groups. However, no differences were detected among clustering in dendrogram of VCG 0422 and 0423 isolates, indicating that they were very closely related. VCG 0421 isolates clustered into two lineages, A and C. The Colorado isolates 21, 23, not assigned into VCG groups showed a high level of genetic similarity with VCG 0421 isolates, indicating that these isolates probably derived from the same lineages. The similar genetic relationships among RAPD analysis and VCGs were observed on populations of F. oxysporum from different hosts such as banana (Bentley et al 1994), common bean (Woo et al 1996), cucumber (Vakalounakis & Fragkiadakis 1999), and strawberry (Nagarajan et al 2006). Due to high level of VCG diversity among Turkish isolates, RAPD markers provided more satisfactory results in the evaluation of genetic diversity among the isolates. The isolates from seven provinces of Turkey grouped into four lineages. RAPD analysis proved that the majority of Turkish isolates were genetically homogeneous, and distinct from Colorado isolates. Ten isolates from different provinces shared the same lineages with Colorado
isolates, which may result from the introduction of different genetic groups to onion production areas in Turkey with the transportation of infected seeds and bulbs. Lineages D and E included isolates from Turkey only. However, RAPD analysis did not reveal a relationship between genetic and pathogenic variability of Turkish isolates. Similarly, Dissanayake et al (2009) separated F. oxysporum isolates obtained from Welsh onion into two genetic groups with 61.6% similarity, but not detected clear-cut relationship between clustering in the PCR-RFLP dendrogram and pathogenicity test. These results were in agreement with the previous studies which fail to provide a relationship between RAPD data and pathogenic groups of Fusarium
oxysporum (Hernandez et al 1999; Freeman &
Maymon 2000; Cramer et al 2003).
RAPD analysis revealed similar polymorphic patterns among most of the isolates from different provinces of Turkey, indicating that F. oxysporum f. sp. cepae has a homogeneous population structure across the country. For example, isolates s7 (Bursa) and s14 (Tokat) collected from 780 km apart from each other included in the same lineage. However, no relationship was found between genetic variability and geographical origin of the isolates. Similar results were obtained by Galván et al (2008) who classified 43 isolates of F. oxysporum f. sp. cepae representing various geographical regions into two groups based on AFLP markers from three primer combinations. They observed high genetic similarity among the isolates representing different countries, but not detected correlation between AFLP groups and the origins of isolates. The previous studies failed to show a positive correlation between geographical origin and DNA polymorphisms of Fusarium spp. (Migheli et al 1998; Gargouri et al 2003).
The estimates of population structure revealed a low, but significant level of genetic variability in each of Turkish populations. The similar levels of gene diversity were detected in the populations sampled from the same regions of Turkey. The genetic diversity was almost negligible especially in Ankara, Eskişehir, and Yozgat populations located in Central Anatolia region. The values of polymorphic loci and Shannon’s information indicated similar levels of genetic variability in
Turkish populations. In contrast to Turkish populations, high degrees of gene and genotype diversity were detected in Colorado population. The results of Swift et al (2002) supported high level of genetic diversity in the Colorado population which was placed into five VCGs.
The estimates of Nei’s (1972) genetic distance and identity between the populations provided a better understanding of genetic relationships. UPGMA analysis of genetic distances among the populations confirmed that the Turkish populations were genetically distinct from the Colorado population, and high degree of genetic similarity was present among Turkish populations separated by geographical distances. Bursa population is geographically closer to the populations of Central Anatolia, although genetically more similar to the populations of Black Sea, indicating that genetic variability among populations of F. oxysporum f. sp. cepae has developed regardless of geographical
distance in Turkey. The low GST and AMOVA
values revealed little evidence for geographical subdivision among seven populations. Similarly, low levels of genetic differentiation among geographic populations and high genetic variability have been reported on asexually reproducing fungi such as F. oxysporum f. sp. vasinfectum (Wang et al 2006), F. culmorum (Gargouri et al 2003) and
Aspergillus niger (Pekarek et al 2006). The values
of gene flow were adequate to prevent genetic differentiation among populations of F. oxysporum f. sp. cepae.
5. Conclusion
These results indicated that RAPD markers, revealing five clonal lineages among isolates of F.
oxysporum f. sp. cepae sampled from eight
geographical populations were well-suited for the clarification of genetic diversity within and among the pathogen populations. The estimates of genetic structure revealed that the populations from Turkey and Colorado were genetically different, and genetic differentiation among Turkish populations was low. The knowledge of population structure among geographical populations of F. oxysporum f. sp. cepae will be useful in breeding programmes for developing resistant onion cultivars to the pathogen
as well as providing more insights into the molecular evolution of this formae speciales.
Acknowledgements
This research was supported by Ankara University (Scientific Research Project). I am thankful to Prof. H. F. Schwartz (Department of Bioagricultural Sciences and Pest Management, Colorado State University, USA) for Colorado isolates.
References
Abawi G S & Lorbeer J W (1971). Reaction of selected onion varieties to infection by Fusarium oxysporum f. sp. cepae. Plant Disease Reporter 55: 1000-1004 Assigbetse K B, Fernandez D, Dubois M P & Geiger J P
(1994). Differentiation of Fusarium oxysporum f. sp.
vasinfectum races on cotton by Random Amplified
Polymorphic DNA (RAPD) analysis. Phytopathology
84: 622-626
Bayraktar H, Türkkan M & Dolar F S (2010). Characterization of Fusarium oxysporum f. sp. cepae from onion in Turkey based on vegetative compatibility and rDNA RFLP analysis. Journal of
Phytopathology 158: 691-697
Bentley S, Pegg K G & Dale J L (1994). Optimization of RAPD-fingerprinting to analyze genetic variation within populations of Fusarium oxysporum f. sp.
cubense. Journal of Phytopathology 142: 64-78
Cramer C S (2000). Breeding and genetics of Fusarium basal rot resistance in onion. Euphytica 115: 159-166 Cramer R A, Byrne P F, Brick M A, Panella L, Wickliffe
E & Schwartz H F (2003). Characterization of
Fusarium oxysporum isolates from common bean and
sugar beet using pathogenicity assays and random-amplified polymorphic DNA markers. Journal of
Phytopathology 151: 352–360
Dissanayake M L M, Kashima R, Tanaka S & Ito S I (2009). Pathogenic variation and molecular characterization of Fusarium species isolated from wilted Welsh onion in Japan. Journal of General
Plant Pathology 75: 37-45
Excoffier L, Laval G & Schneider S (2005). Arlequin ver. 3.0: An Integrated Software Package for Population Genetics Data Analysis: University of Berne Switzerland
Faostat (2010). Statistical database. Available: http://faostat.fao.org
the fungal Fusarium oxysporum f. sp. albedinis, causal agent of bayoud disease of date palm, using molecular techniques. Phytoparasitica 28(4): 341-348
Galván G A, Koning-Boucoiran C F S, Kopman W J M, Burger-Meijer K, González P H, Waalwijk C, Kik C & Scholten O E (2008). Genetic variation among
Fusarium isolates from onion and resistance to
Fusarium basal rot in related Allium species.
European Journal of Plant Pathology 121: 499-512
Gargouri S, Bernier L, Hajlaoui M R & Marrakchi M (2003). Genetic variability and population structure of the wheat foot rot fungus, Fusarium culmorum, in Tunisia. European Journal of Plant Pathology 109: 807-815
Hernandez J F, Posada M A & Arbelaez G (1999). Identification of molecular markers of Fusarium
oxysporum f. sp. dianthi by RAPD. Proceedings of
the International Symposium on cut flowers in the
Tropics, pp 123-131
Leslie J F & Summerell B A (2006). The Fusarium
laboratory manual. Blackwell, Ames, pp 388.
Lewontin R C (1972). The apportionment of human diversity. Evolutionary Biology 6: 381-398
Migheli Q, Briatore E & Garibaldi A (1998). Use of random amplified polymorphic DNA (RAPD) to identify races 1, 2, 4 and 8 of Fusarium oxysporum f. sp. dianthi in Italy. European Journal of Plant
Pathology 104: 49-57
Mishra P K, Fox R T V & Culham A (2003). Development of a PCR-based assay for rapid and reliable identification of pathogenic Fusaria. FEMS
Microbiology Letters 218: 329-332
Nagarajan G, Kang S W, Nam M H, Song J Y, Yoo S J & Kim H G (2006). Characterization of Fusarium
oxysporum f. sp. fragariae based on vegetative
compatibility group, random amplified polymorphic DNA and pathogenicity. The Plant Pathology
Journal 22(3): 222-229
Nei M (1972). Genetic distance between populations.
American Naturalist 106: 283-292
Nei M (1973). Analysis of gene diversity in subdivided populations. Proceedings of the National Academy of
Sciences USA 70: 3321-3323
Nelson P E, Toussoun T A & Marasas W F O (1983). Fusarium Species. An illustrated manual for
identification. Pennsylvania State University Press,
pp 193
Özer N, Koycu D, Chilosi D & Magro P (2004). Resistance to Fusarium basal rot of onion in
greenhouse and field and associated expression of antifungal compounds. Phytoparasitica 32: 388-394 Pekarek E, Jacobson K & Donovan A (2006). High
levels of genetic variation exist in Aspergillus niger populations infecting welwitschia mirabilis hook.
Journal of Heredity 97(3): 270-278
Reader U & Broda P (1985). Rapid preparation of DNA from filamentous fungi. Letters in Applied
Microbiology 1: 17-20
Rohlf F I (1998). NTSYS-pc. Numerical taxonomy and multivariate analysis system, version 2.0. Applied Biostatistics, New York, USA
Sambrook J, Fritsch E F & Maniatis T (1989). Molecular cloning: A laboratory manual, 2nd edn. Cold Spring Harbor Laboratory Press, New York, pp 1659 Sumner D R (1995). Fusarium basal plate rot, In:
Schwartz H.F. and Mohan S.K. (eds.). Compendium
of Onion and Garlic Diseases. St. Paul, MN, USA,
APS press, pp 10-11
Swift C E, Wickliffe E R & Schwartz H F (2002). Vegetative compatibility groups of Fusarium
oxysporum f. sp. cepae from onion in Colorado. Plant
Disease 86: 606-610
Vakalounakis D J & Fragkiadakis G A (1999). Genetic diversity of Fusarium oxysporum isolates from cucumber: differentiation by pathogenicity, vegetative compatibility, and RAPD fingerprinting.
Phytopathology 89: 161-168
Wang B, Brubaker C L, Tate W, Woods M J, Matheson B A & Burdon J J (2006). Genetic variation and population structure of Fusarium oxysporum f. sp.
vasinfectum in Australia. Plant Pathology 55:
746-755
Woo S L, Zoina A, Del Sorbo G, Lorito M, Nanni B, Scala F & Noviello C (1996). Characterization of
Fusarium oxysporum f. sp. phaseoli by pathogenic
races, VCGs, RFLPs, and RAPD. Phytopathology 86: 966-973
Yeh F C, Yang R C, Boyle T J, Ye Z H & Mao J X (1999). Popgene ver. 1.32, the user-friendly shareware for population genetic analysis. Molecular Biology and Biotechnology Centre, University of Alberta, Edmonton, Canada