Executive Summary
Deseasonalized non-farm employment and industrial production fell by 1.7 and 8 percent, respectively, in the 4th quarter of 2008 compared to the previous quarter. Forecasting the non-agricultural GDP by using the non-agricultural employment, industrial production and real foreign trade, we find that GDP contracted by 3.8 percent in the 4th quarter of 2008 on an annual basis. Since the share of agricultural production in GDP is quite low (around 8 percent), we conclude that Turkish economy shrank by around 4 percent in the 4th quarter on an annual basis.
Under the assumption of a contraction of 5 percent in the GDP for 2009, we foresee that the non-farm employment will decline by 2 percent (300 thousand), and the non-farm labor force will increase by around 3.7 percent (700 thousand). Under this scenario, there will be approximately 4 million unemployed at the end of the year, 1 million higher than the current level. Hence, the non-farm unemployment rate will reach 20 percent, breaking a record. Such a historic high in the labor market is likely to have important political implications.
Under an IMF agreement or alternatively a medium-term fiscal plan, the TL is expected to appreciate in the medium-term. Unlike the former exchange rate shocks, we do not expect the TL to revert to its overvalued level; since the global excess liquidity and the risk appetite has come to an end for many years to come. Assuming that an IMF agreement is signed, we predict that the TL will appreciate by 20 percent, going back to its normal trend. Furthermore, the foreign exchange basket (1 USD+1 EUR) is likely to fall to 3.4 TL. The exchange rate may decline to 1.55, if the EUR / USD parity stays constant.
Looking at the budget figures of January 2009, it is obvious that the 2009 budget realization will yield a deficit exceeding 9 billion TL which is the predicted figure in the budget plan. Our prediction is that the budget deficit will exceed 57 billion TL, and the primary balance will be negative. Taking into account the expected inflation rate of 7 percent, and the expected contraction of 5 percent of the GDP, we calculate the GDP level to be 981 billion TL in 2009 given that we expect the 2008 GDP to be 957 billion TL. Thus we predict a budget deficit / GDP ratio of 5.9 percent in 2009.
As for the inflation, we think that the inflation rate will recede to below 6 percent in the next 3 months due to a basis effect. CPI may have a further 2.5 point annual decrease in 2009.
Monetary policy is not capable of bolstering domestic demand by decreasing interest rates any more. Indeed, the real interest rate seems to be stuck at 8 percent, being lowered from 10 percent.
Assuming that there will be a compatible (and realistic) fiscal policy in effect in the near future, we expect the CBRT to keep decreasing the interest rates, taking into account a sharp
decrease in the inflation rate.
MACROECONOMIC OUTLOOK #002
Growth and Employment
We estimate a contraction of approximately 4 percent on an annual basis in the Turkish economy in the last quarter of 2008. We expect that there will be 4 million unemployed by the end of 2009, implying an increase of 1 million during the course of this year. In parallel, the non-farm unemployment rate will approach 20 percent, breaking a record.
In the first Macroeconomic Outlook, we conjectured that the Turkish economy had been driven into a slowdown. This conjecture has obviously been confirmed in the meantime. The slowdown has proved to be much deeper than we predicted and apparently the contraction still continues. Our moderate optimism about the extent of a slowdown originated from the foresight that the government would sign an agreement with IMF by February at the latest. Unfortunately, this has not happened, furthermore, there is still uncertainty regarding the signing of an agreement in the near future.
The 4th quarter growth figure is not available at the moment. In Turkey, the growth rates are
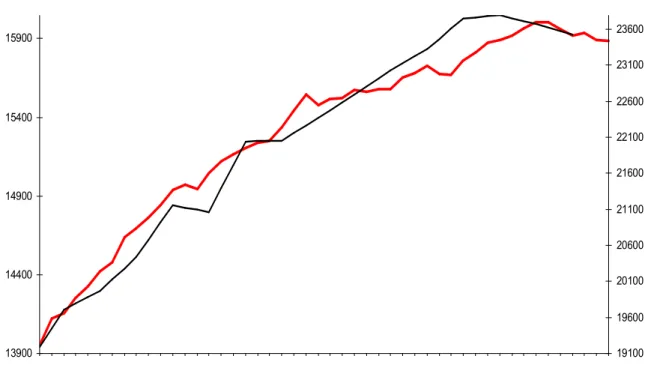
announced with an almost 3-month lag, which is clearly a serious delay. In December, we forecasted the 4th quarter growth rate to be -2 percent. We want to revise this forecast in light of new data. Figure 1 and 2 show two leading indicators of GDP, non-farm employment and industrial production.
Deseasonalized non-farm employment and industrial production decreased in the 4th quarter by 1.7 and 8 percent, respectively, compared to the previous quarter. Forecasting the non-farm GDP by using the non-farm employment, industrial production and real foreign trade, we find that GDP contracted by 3.8 percent in the 4th quarter of 2008 on an annual basis. It is difficult to estimate the agricultural growth, nevertheless, its share in GDP is already very low (around 8 percent). As a result, we predict that the Turkish economy will shrink approximately 4 percent on an annual basis in the last quarter of 2008.
Figure 1 Non-Agricultural Employment and Growth
13900 14400 14900 15400 15900 01-0 5 02-0 5 03-0 5 04-0 5 05-0 5 06-0 5 07-0 5 08-0 5 09-0 5 10-0 5 11-0 5 12-0 5 01-0 6 02-0 6 03-0 6 04-0 6 05-0 6 06-0 6 07-0 6 08-0 6 09-0 6 10-0 6 11-0 6 12-0 6 01-0 7 02-0 7 03-0 7 04-0 7 05-0 7 06-0 7 07-0 7 08-0 7 09-0 7 10-0 7 11-0 7 12-0 7 01-0 8 02-0 8 03-0 8 04-0 8 05-0 8 06-0 8 07-0 8 08-0 8 09-0 8 10-0 8 11-0 8 12-0 8 19100 19600 20100 20600 21100 21600 22100 22600 23100 23600
Non-agricultural employed (seasonally adjusted) Non-agricultural GDP (working day and seasonally adjusted)
Source: TURKSTAT and betam
We expect the contraction to continue during the first quarter of 2009. Industrial production fell by 21 percent on an annual basis in January 2009. Deseasonalized data indicates that the industrial production in January decreased by 1.5 percent compared to the previous month (Figure 2). In February, there were no positive changes in the domestic or in the global economy. In March, the TL depreciated by 10 percent due in part to the absence of an IMF agreement and in part to the
persistence of the recession in the US economy. Therefore, we think that the recession continued into the first quarter of 2009. Under the assumptions of 5 percent decrease in the private consumption, 40
percent contraction in private investments, 1.5 point and 4.5 positive contributions from the public expenditure and net exports respectively, we predict the size of the recession to be around 6 percent for the first quarter of 2009.
Our growth projection for 2009 depends for the most part on the pace of the recovery of US economy. However, no signs of recovery are expected before late 2009. If so, the foreign demand will be floating around its current low level in the course of 2009. Therefore, the contraction in domestic markets will be limited by a revival in the domestic demand, which requires both regaining confidence in the markets and devising a credible medium-term macroeconomic perspective. Assuming either an IMF agreement in Spring 2009 or alternatively a strong domestic fiscal plan, Turkey may be able to stop the deepening of recession through a moderate rise in domestic demand. However, the industrial production will not go back to the pre-crisis level earlier than 2010. If the recovery in the US economy starts in the last quarter of 2009, then the size of recession in Turkish economy will stay around 5 percent, which is much less than our previous estimation. Such a revision in the growth estimation requires a parallel revision in the expectations of the unemployment rate and the budget deficit. Figure 2 The Industrial Production and Growth
88 93 98 103 108 113 118 123 01-0 4 03-0 4 05-0 4 07-0 4 09-0 4 11-0 4 01-0 5 03-0 5 05-0 5 07-0 5 09-0 5 11-0 5 01-0 6 03-0 6 05-0 6 07-0 6 09-0 6 11-0 6 01-0 7 03-0 7 05-0 7 07-0 7 09-0 7 11-0 7 01-0 8 03-0 8 05-0 8 07-0 8 09-0 8 11-0 8 01-0 9
Industrial Production Index (seasonally adjusted)
Non-agricultural GDP (indexed to Industrial Production Index ,working day and seasonally adjusted)
Source: TURKSTAT and betam
Unemployment has been increasing tremendously. Two factors lie behind this massive rate of
unemployment. On one hand, the stagnation has been restricting the creation of new jobs, and on the other, the non-agricultural labor force has been increasing above its trend. This is due to the “added worker effect”. Able family members, who are not currently in the labor force, mostly women, are entering the labor force as breadwinners are facing higher probabilities of unemployment. As seen in Figure 3, the number of people in the labor force is increasing and the rise of employment is
decelerating.
In 2000, there were 1.3 million unemployed in the non-agricultural sector. After the 2001 crisis, this number increased by 1 million and stabilized around 2.3 million in spite of the high growth and employment rates. The unemployment rate did not decrease even though there was strong economic growth during the following period. This is due to the fact that the non-agricultural labor force
participation was growing even faster. In the last quarter of 2008, with the current slowdown, unemployment has again entered an upward trend. In the period from November 2008 to January 2009, the number of the non-agricultural unemployed increased to 3.3 million. Assuming a contraction of 5 percent in the GDP in 2009, we expect the non-agricultural employment to decrease by around 2 percent (300 thousand), and non-farm labor force to increase by around 3.7 percent (700 thousand).
We expect that there will be 4 million unemployed by the end of 2009, implying an increase of 1 million during the course of this year. Also, non-farm unemployment rate will be close to 20 percent, breaking a record. Undoubtedly, this would have important political implications.
Figure 3 Number of Employed and Unemployed in the Non-Agricultural Sector (Seasonally Adjusted, in Thousands) 13900 14400 14900 15400 15900 16400 16900 17400 17900 18400 18900 01-0 5 02-0 5 03-0 5 04-0 5 05-0 5 06-0 5 07-0 5 08-0 5 09-0 5 10-0 5 11-0 5 12-0 5 01-0 6 02-0 6 03-0 6 04-0 6 05-0 6 06-0 6 07-0 6 08-0 6 09-0 6 10-0 6 11-0 6 12-0 6 01-0 7 02-0 7 03-0 7 04-0 7 05-0 7 06-0 7 07-0 7 08-0 7 09-0 7 10-0 7 11-0 7 12-0 7 01-0 8 02-0 8 03-0 8 04-0 8 05-0 8 06-0 8 07-0 8 08-0 8 09-0 8 10-0 8 11-0 8 12-0 8 th o u s a n d s Employed Labor force Unemployed
Source: TURKSTAT and betam
Current Account Balance and Exchange Rate
Finalizing an IMF agreement can induce an appreciation of the TL by 20 percent, returning it to its normal trend. We think that the value of the foreign exchange basket (1 USD+1 EUR) will fall to around 3.4 TL, and the exchange rate will stabilize around 1.55 TL / USD under the current EUR / USD parity.
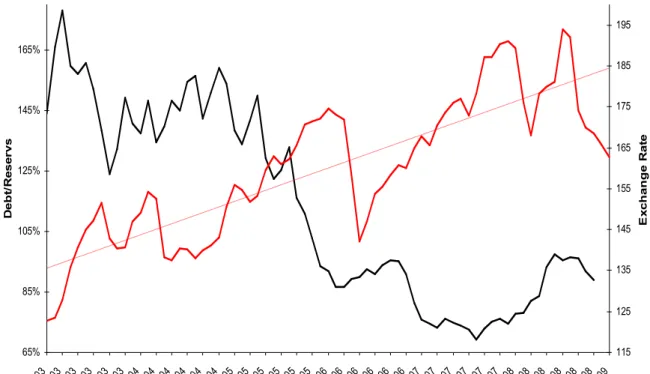
Before the crisis broke out, the value of the TL against the 1USD + 1 EUR basket was at its peak around 2.85 TL last August. Given its long-term tendency (Figure 5), TL was overvalued by 20 percent at this rate. However, by October 2008, the TL had depreciated by as much as 30 percent, and the basket remained relatively stable around 3.7 TL until March 2009. In late-February and early March, the TL depreciated by a further 10 percent against the currency basket, exceeding 4 TL, as a result of the delay in response to the crisis in the US financial sector and the failure to agree on an IMF
agreement. As this report is being written, the value of the basket is down to slightly below 4 TL due to many factors such as the intervention of the Central Bank of Republic of Turkey (CBRT) to the
exchange rate, the recovery in the foreign banks’ shares in the last months and the possibility of an IMF agreement to be signed after the local elections.
It is very difficult to predict the level of the exchange rate in the short run. In the absence of an IMF agreement or a strong medium-term fiscal plan, the volatility of the exchange rate will be high due to ever-changing expectations. CBRT’s daily sales of size 50 million USD, try to provide liquidity to the markets. However, the primary mechanism that can influence the exchange rate is a threat of a direct intervention by the CBRT. The credibility of such a threat may be tested by the markets. Without a credible medium-term fiscal perspective, CBRT may not be able to resist to the speculative attacks. On the other hand, the government can hardly sustain the current situation. We expect the
government to develop a feasible medium-term fiscal plan with or without IMF after the local elections to be held in late March.
Figure 4 Current Account Balance (monthly, seasonally adjusted, in millions USD) -6000 -5000 -4000 -3000 -2000 -1000 0 1000 07-05 09-05 11-05 01-06 03-06 05-06 07-06 09-06 11-06 01-07 03-07 05-07 07-07 09-07 11-07 01-08 03-08 05-08 07-08 09-08 11-08 01-09 m il . U S D
Source: CBRT, TURKSTAT and betam
Figure 5 CPI-based Real Exchange Rate and the Ratio of Total Short Term Debt to International Reserves 65% 85% 105% 125% 145% 165% 02-0 3 04-0 3 06-0 3 08-0 3 10-0 3 12-0 3 02-0 4 04-0 4 06-0 4 08-0 4 10-0 4 12-0 4 02-0 5 04-0 5 06-0 5 08-0 5 10-0 5 12-0 5 02-0 6 04-0 6 06-0 6 08-0 6 10-0 6 12-0 6 02-0 7 04-0 7 06-0 7 08-0 7 10-0 7 12-0 7 02-0 8 04-0 8 06-0 8 08-0 8 10-0 8 12-0 8 02-0 9 D e b t/ R e s e rv s 115 125 135 145 155 165 175 185 195 E x c h a n g e R a te
Total short term debt/net international reservs Real effective exchange rate
Source: Turkey Data Monitor and betam
With these concerns in mind, we think that the TL will appreciate in the medium term. Unlike the former exchange rate shocks, it seems unlikely that the TL will revert to its overvalued level. The most important reason behind this is the end of excess liquidity and the risk appetite in the international markets for many years to come. The level of the current account balance of Turkey is of critical importance at this point. As can be seen in Figure 4, the current account balance was negative
although decreasing up until January 2009, at which point the current account balance turned positive at 300 million USD. As a comparison, in January 2008, there was a current account deficit of 4 billion USD. Note that the last time that there was a current account surplus was in 2002, just after the 2001 crisis. A positive current account balance is a sign of the acuteness of the recession is in Turkey. On the other hand, it has eased the demand pressure on the foreign currencies.
In the 4th quarter of 2008, the structural change in the financing of the current account deficit was worrisome (Figure 6). Portfolio investments decreased further and the credit items turned negative. In 2009, we do not expect capital outflows to constitute a major concern given that we expect positive current account balances (assuming this year will not be particularly bad for tourism).
As mentioned above, if Turkey finalizes an agreement with IMF, we think the TL will get back to its trend appreciating by 20 percent under these circumstances. The foreign exchange basket (1USD+1 EUR) may go down to 3.4 TL and the exchange rate may stabilize around 1.55 TL/USD. Even without an IMF agreement, the government is likely to adopt a medium-term fiscal policy. Yet, it is impossible to foresee its timing and credibility. Without an IMF agreement, the demand pressure on the foreign currencies will probably continue in spite of the current account surplus. Moreover, the supply of foreign currencies will be provided by the domestic foreign currency holders, including the CBRT. The decision of switching from TL to foreign currencies will depend on the expectations. We expect the exchange rate to stabilize around 1.80 TL / USD under this scenario.
Figure 6 Financing of the Current Account Balance
-80% -60% -40% -20% 0% 20% 40% 60% 80% 100% 2006 (3) 2006 (4) 2007 (1) 2007 (2) 2007 (3) 2007 (4) 2008 (1) 2008 (2) 2008 (3) 2008 (4)
Foreign direct investment Portfolio investment Long term credits Short term credits
Source: CBRT and betam
Fiscal Policy
We predict that the ratio of the budget deficit to GDP will be 5.9 percent in 2009.
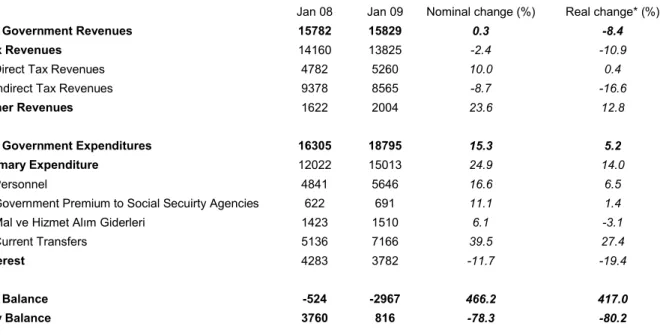
The current fiscal policy in Turkey is far from being realistic. The current budget is based on the revenue projections made in October 2008. At that time, the growth rate was assumed to be 4 percent in 2009. Moreover, the fiscal authorities were predicting a significant expansion in the tax base. These implied a 22 percent real increase in total tax revenues in the budget (Table 1). As a reality check, tax revenues declined by 11 percent in January 2009 (Table 2), implying a 30 percent difference between the expected and the planned tax revenues. Assuming a contraction of 5 percent in the GDP, we
expect a real decrease of 10 percent in the indirect and of 5 percent in the direct tax revenues in 2009. If so, the Central Administration Revenues will amount to 198 billion TL rather than to 250 billion TL which is the planned amount in the 2009 budget (Table 1).
2009 budget projected the government spending to be 259 billion TL. Yet, even in January, there was a real increase of 14 percent in primary spending. Undoubtedly, this spending pattern has continued in February and in March given that the local elections will be held at the end of March. Nevertheless, we expect a slowdown in spending after the local elections. The economic downturn will restrain the extent to which spending is cut. We expect the primary spending to increase to 205 billion TL at least compared to the 202 billion TL which was the planned amount. Moreover, we think that the interest spending will be around 50 billion TL, i.e. 13 percent less than planned.
Table 1 Central Government Budget Plan and estimations by betam (in millions TL)
2008 2009 (planned) % (real)* betam (estimated)*** betam estimated change -(%, reel)
Central Government Revenues 208,898 249,973 11.3 206810 -7.9
Tax Revenues 168,087 220,603 22.1 177240 -1.9
Direct Tax Revenues 59,021 74,105 16.8 63437 0
Indirect Tax Revenues 109,157 146,498 24.9 113804 -3
Other Revenues 40,811 29,570 -32.6 -
-Central Government Expenditures 225,967 259,156 6.7 262883 8.24
Primary Expenditure 175,309 201,656 7.0 205383 9
Personnel 48,825 57,211 9.0 -
-Government Premium to Social Secuirty Agencies 6,402 7,243 5.3 -
-Good and Services Procurements 31,525 34,407 1.5 -
-Current Transfers 70,116 87,956 16.7 -
-Capital Expendituıres 18,441 14,839 -25.1 -
-Interest 50,661 57,500 5.6 -
-Budget Balance -17,069 -9,183 -49.9 -56072 205.64
Budget Balance / GDP (estimated)** -1.8% -0.9% -52.5 -5.6% 188.61
Primary Balance 33,592 48,317 33.8 1428 -96.05
Primary Balance / GDP (estimated)** 3.5% 4.6% 22.3 0.14% -96.22
* Estimated budget figures for 2009 are deflated by CBRT's end-year target inflation rate (7.5%).
** Real GDP growth for 2009 is assumed to be 4% in the plan of Ministry of Finance. In this table, we use the IMF's last estimation which is -1.5%. Annual growth for 2008 is assumed to be 1%.
*** Items depicted as "-" reflects the figures in the plan of Ministry of Finance. Source: General Directorate of Budget and Fiscal Control and betam
In other words, the 2009 budget will bring about a deficit of much more than 9 billion TL which is the amount in the budget plan. Under the aforementioned assumptions, our prediction is that the budget deficit will exceed 57 billion TL and the primary balance will be negative. Taking into account the expected inflation rate of 7 percent, and the expected contraction of 5 percent in the GDP, we calculate the GDP level to be 981 billion TL in 2009 given that we expect the 2008 GDP to be 957 billion TL. Thus we predict a budget deficit / GDP ratio of 5.9 percent in 2009.
A budget deficit that large raises questions as to how it will be financed. If domestic funds are the primary sources, then there will be a significant upward pressure on the interest rates, rendering the loose monetary policy useless. Additionally, a decrease in the demand for durable consumption goods and a contraction in private investments might weaken the efficiency of already loose fiscal policy. At the same time, primary deficit may lead to a jump in the ratio of public debt to GDP. In this case, in order to prove the sustainability of public debt, the government must come up with a realistic medium term fiscal plan to curb the increasing debt ratio in 2010 and after. Otherwise, the worsening of expectations would unavoidably put pressure on the exchange rate, the interest rate and the inflation.
In this regard, the need for foreign financing is obvious. The source of foreign funds remains unclear in the absence of an IMF agreement.
Table 2 Central Government Budget Realizations in January (in Millions TL)
Jan 08 Jan 09 Nominal change (%) Real change* (%)
Central Government Revenues 15782 15829 0.3 -8.4
Tax Revenues 14160 13825 -2.4 -10.9
Direct Tax Revenues 4782 5260 10.0 0.4
Indirect Tax Revenues 9378 8565 -8.7 -16.6
Other Revenues 1622 2004 23.6 12.8
Central Government Expenditures 16305 18795 15.3 5.2
Primary Expenditure 12022 15013 24.9 14.0
Personnel 4841 5646 16.6 6.5
Government Premium to Social Secuirty Agencies 622 691 11.1 1.4
Mal ve Hizmet Alım Giderleri 1423 1510 6.1 -3.1
Current Transfers 5136 7166 39.5 27.4
Interest 4283 3782 -11.7 -19.4
Budget Balance -524 -2967 466.2 417.0
Primary Balance 3760 816 -78.3 -80.2
* For the calculation of real change, change in CPI between January 08 - January 09, is employed (9.5%). Source: Turkey Data Monitor and betam
Inflation
Inflation will recede to below 6 percent in the next 3 months because of a base year effect. CPI may have a further 2.5 point annual decrease in 2009.
We experience a serious disinflation due to both the global deflation and a deep economic downturn. The annual CPI has decreased to 7.7 percent. It will recede to below 6 percent at the end of the next 3 months because of a base year effect. In 2008, the 3-month inflation rate between March and May was above 4 percent. Even if we assume an inflation rate around 1.5 points for the same period in 2009, the annual CPI is likely to decline by 2.5 points.
It may be surprising that the inflation rate has been decreasing that fast despite the TL depreciation. However, the underlying reason is that the pass-through effect from the exchange rate to inflation has weakened under the current economic downturn. Changes in the exchange rates are reflected directly on energy prices. However, firms seem to bear the increasing production costs stemming from
depreciation of TL, by not reflecting them on prices due to weak demand. Note that there are two kinds of constraints on this type of price determination. First of all, firms can tolerate higher costs as long as the profits are at least zero. If the TL keeps depreciating, and there is no credible medium-term fiscal policy, the pass-through effect will strengthen and we would observe the inflationary effects of a weakening TL. Secondly, if there is amelioration in the demand, firms will reflect the accumulated costs on the prices. Taking these two channels into account, it would be impossible to prevent the inflationist effects of the depreciation of the TL in the medium term.
In the medium term, the inflation rate will depend on the exchange rate movements and the pace of the global recession. In the short run, an inflation rate below 6 percent would be a big opportunity. The monetary and fiscal policy should be in accordance in the medium term to keep inflation at this level.
Figure 7 Annual CPI and CPI H 0% 2% 4% 6% 8% 10% 12% 14% 08-0 6 09-0 6 10-0 6 11-0 6 12-0 6 01-0 7 02-0 7 03-0 7 04-0 7 05-0 7 06-0 7 07-0 7 08-0 7 09-0 7 10-0 7 11-0 7 12-0 7 01-0 8 02-0 8 03-0 8 04-0 8 05-0 8 06-0 8 07-0 8 08-0 8 09-0 8 10-0 8 11-0 8 12-0 8 01-0 9 02-0 9
CPI (annual change) CPI H (annual change) CPI I (annual change)
Source: TURKSTAT
Monetary Policy
Assuming that there will be a compatible (and realistic) fiscal policy in effect in the near future, we expect the CBRT to keep decreasing the interest rates, taking into account a sharp
decrease in the inflation rate.
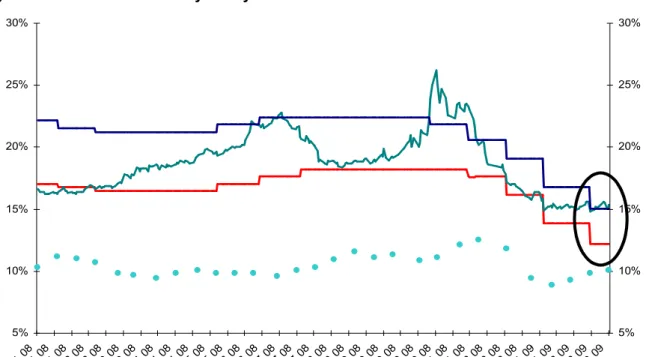
Since December 2008, the CBRT has made three serious reductions in the interest rate, of size 125, 200 and 150 basis points, successively, which ad up to 475 basis points (Figure 8). What played a role in these reductions was the expectation that the economic downturn would be much deeper than expected and, related to this, the expectation that the disinflation would accelerate. Clearly, the CBRT implemented the correct policy. The markets followed suit except in the last reduction. Market interest rates declined (Figure 9), and deposit rates and credit rates were also reduced.
However, the last reduction was controversial. Market rates did not follow the CBRT’s 150 basis point reduction, due to the worsening expectations concerning an IMF agreement, strong signs of loosening monetary policy and the continuation of the global financial crisis. Therefore, the benchmark interest rate remained above 15 percent (Figure 8).
In 2009, the policy interest rate is redefined as the midpoint of the distance between the lending and the borrowing rates. It is currently set at 12.75 percent. Therefore, the market rates should have fallen below 14 percent. As a result, there was a 150 basis point difference between the market rate and the policy rate, as TL depreciated further by 10 percent.
Monetary policy is not capable of bolstering domestic demand by decreasing interest rates any more. Indeed, the real interest rate seems to be stuck at 8 percent, being lowered from 10 percent (Figure 8). Assuming that there will be a compatible (and realistic) fiscal policy in effect in the near future, we expect the CBRT to keep decreasing the interest rates, taking into account a sharp decrease in the inflation rate. The size and effect of further reductions will depend on whether the government will lay out a medium-term fiscal perspective.
Figure 8 Indicators of Monetary Policy 5% 10% 15% 20% 25% 30% 02 0 1 08 15 0 1 08 28 0 1 08 10 0 2 08 23 0 2 08 07 0 3 08 20 0 3 08 02 0 4 08 15 0 4 08 28 0 4 08 11 0 5 08 24 0 5 08 06 0 6 08 19 0 6 08 02 0 7 08 15 0 7 08 28 0 7 08 10 0 8 08 23 0 8 08 05 0 9 08 18 0 9 08 01 1 0 08 14 1 0 08 27 1 0 08 09 1 1 08 22 1 1 08 05 1 2 08 18 1 2 08 31 1 2 08 13 0 1 09 26 0 1 09 08 0 2 09 21 0 2 09 06 0 3 09 5% 10% 15% 20% 25% 30%
CBRT's overnight borrow ing rate (comp.) Benchmark interest rate (comp.)
CBRT's overnight lending rate (comp.) Expected real interest rate*
Source: Turkey Data Monitor and betam*
Future of the IMF negotiations
We want to emphasize the importance of the negotiations with IMF. It is obvious that the easiest way of laying out a medium term fiscal plan is to sign an agreement with IMF. All the predictions in this report are closely related to an IMF agreement. The Turkish government and the IMF declared that they agreed at the macro level, indicating that an agreement has been achieved upon the crucial parameters such as the budget deficit and the primary deficit/surplus. According to the Prime Minister’s own declarations, the conflict lies in the change to make the institutional structure of tax collection more effective. The government seems to be unwilling to give up its political control on the administration of tax collection to an autonomous institution. Instead, it seems that the government is trying to convince the IMF that it can expand the tax base without building an autonomous institution for collecting taxes. Whether the government can convince the IMF remains unclear. On the other hand, the government seems to be aware of the possible destructive effects on the economy of the failure of an IMF agreement. Our prediction is that the parties will resolve the disagreement after the local elections at latest.
*
Expected real interest rate=
1
1
1
ei
(i = annual benchmark interest rate ande