ADENOSINE REGULATION OF DANGER
SIGNALING
A THESIS SUBMITTED TO
THE GRADUATE SCHOOL OF ENGINEERING AND SCIENCE OF BILKENT UNIVERSITY
IN PARTIAL FULFILLMENT OF THE REQUIREMENTS FOR THE DEGREE OF
MASTER OF SCIENCE IN
MOLECULAR BIOLOGY AND GENETICS
By İmran Akdemir
ADENOSINE REGULATION OF DANGER SIGNALING By İmran Akdemir
July 2017
We certify that we have read this thesis and that in our opinion it is fully adequate, in scope and in quality, as a thesis for the degree of Master of Science.
_____________________________________ Çağlar ÇEKİÇ (Advisor)
_____________________________________ Duygu SAĞ
_____________________________________ Serkan İsmail GÖKTUNA
Approved for the Graduate School of Engineering and Science:
____________________________________ Ezhan KARAŞAN
Abstract
ADENOSINE REGULATION OF DANGER SIGNALING
İmran AKDEMİR
M.S. in Molecular Biology and Genetics Advisor: Çağlar ÇEKİÇ
July, 2017
Metabolic and immune related activities converge as main triggers of adenosine accumulation in extracellular space. Adenosine by engaging adenosine A2A and A2B receptors strongly suppresses innate and adaptive immune responses. Although adenosine receptors are being targeted in preclinical and clinical studies, how different danger signals are regulated by adenosine is poorly understood. Here we showed that adenosine receptor stimulation strongly inhibited inflammatory responses while sparing Type-I interferon responses downstream of different danger signals in dendritic cells and macrophages. Mechanistically, danger signals associated with MyD88-dependent inflammatory pathways such as LPS and CpG but not the danger signals associated with IRF3/Type-I interferon pathways such as pA:U and cGAMP increase the expression of adenosine A2A and A2B receptors. Expression of anti-inflammatory NR4A1 was increased after adenosine receptor stimulation in the presence of TLR ligands known to activate MyD88 pathway but not in the presence of cGAMP and pA:U. Overall these results indicate that there is a differential modulation of danger signaling by adenosine rather than overall suppression. Our results have important implications for developing combinatorial approaches to target adenosine and danger signaling pathways to cure immune-related diseases.
Özet
ADENOZİNİN TEHLİKE SİNYALLERİNİ
REGÜLASYONU
İmran AKDEMİR
Moleküler Biyoloji ve Genetik, Yüksek Lisans Tez Yöneticisi: Çağlar ÇEKİÇ
Temmuz, 2017
Metabolik ve bağışıklıkla alakalı aktiviteler hücre dışında adenozin birikmesinin en büyük nedenleridir. Adenozin A2A ve A2B reseptörlerini harekete geçirerek hem doğal bağışıklığı hem de edinilen bağışıklığı güçlü bir şekilde baskılar. Adenozin reseptörleri klinik öncesi ve klinik aşamalarda hedeflenmesine rağmen tehlike sinyallerinin adenozin tarafından nasıl regüle edildiği bilinmemektedir. Biz bu tezde adenozinin dendritik hücre ve makrofajlarda, değişik tehlike sinyallerinin harekete geçirdiği inflamatuvar tepkileri güçlü bir şekilde baskılarken Tip-1 interferon tepkilerini etkilemedeğini gösterdik. Mekanik olarak, LPS ve CpG gibi MyD88’e bağlı sinyaller A2A ve A2B reseptörlerinin ekspresyonunu artırırken, pA:U ve cGAMP gibi IRF-3 ve Tip-1 interferonlar’la alakalı sinyaller bu reseptörlerin ekspresyonunu etkilemedi. Anti-inflamatuvar bir molekül olan NR4A1 ekspresyonu da MyD88’i aktive ettiği bilinen TLR sinyallerin varlığında artarken pA:U ve cGAMP varlığında artmadı. Genel olarak bu sonuçlar adenosinin farklı tehlike sinyalleri üzerinde genel bir baskılayıcı etkiden ziyade farklı türde modülasyonu olduğunu göstermektedir. Çalışmamız ileride bağışıklıkla alakalı hastalıkları tedavi etmek amacıyla tehlike reseptörlerini ve adenozin reseptörlerini hedefleyen birleşimsel yaklaşımlar geliştirilmesi adına önemli çıkarımlar içermektedir.
Acknowledgement
First, I would like to express my gratitude to my advisor, Asst. Prof. Dr. Çağlar Çekiç for giving me the opportunity to work in his lab and for his guidance, support and patience. Thanks to him I became more qualified both in terms of academics and technical skills.
I want to give my special thanks to Asst. Prof. Dr. Duygu Sağ and Asst. Prof. Dr. Serkan İsmail Göktuna for accepting to become members in my jury and sparing time to improve my thesis. I appreciate their valuable comments and suggestions.
I feel very lucky to be a member of CClab because we were not only labmates but also good friends. I thank, from the bottom of my heart, to my lab mates Altay Koyaş, Ali Can Savaş and Merve Kayhan for their friendship, support and every other thing I can’t fit in a sentence. It was a privilege to work with you all!
Other than CClab, I would like to thank all MBG family specially Gürsel Group members for always helping me and answering my questions. I also thank Gamze Aykut for helping me with animal experiments.
The most special thanks goes to my precious family for always supporting my dreams. I know very well that none of these things would come true without them. I’m very grateful to my mother Vahide and my father Mehmet and I love them so much. I also want to thank Sefa Kurak and Hasan Hüseyin Kurak since they are no different than parents to me. Last but not least I would like to thank my beloved boyfriend Anıl Sayal for always being there for me and for his love and support.
I would also like to thank to The Scientific and Technological Research Council of Turkey (TUBITAK), EMBO and TUBA for their financial support. I was financially supported by Bilkent University, Department of Molecular Biology and Genetics and TUBITAK (project no: 115Z170 and 215S729 ).
Table of contents
Abstract ... iii Özet ... iv Acknowledgement ... v Table of contents ... vi List of Figures ... ix List of Tables ... x Abbreviations ... xi Chapter 1 ... 1 Introduction ... 11.1 The Immune System ... 1
1.1.1 Innate Immunity... 2
1.1.1.1 Pathogen Recognition Receptors ... 2
1.1.1.1.1 Toll-Like Receptors ... 3 1.1.1.1.1.1 TLR1, TLR2 and TLR6 signaling ... 4 1.1.1.1.1.2 TLR3 signaling ... 4 1.1.1.1.1.3 TLR4 signaling ... 4 1.1.1.1.1.4 TLR9 signaling ... 4 1.1.1.1.2 STING signaling ... 5
1.1.1.2 Innate Immune Responses after Danger Signaling ... 6
1.1.1.3 Macrophages ... 6
1.1.1.4 Dendritic Cells ... 6
1.1.2 Adaptive Immunity ... 7
1.1.3 Integrated Immune Response... 7
1.2 Purinergic Signaling and Adenosine Receptors ... 9
1.2.1 Adenosine Signaling and Immune Response... 10
1.2.2 Therapeutic Targeting of Adenosine Receptors ... 11
1.3 Aim of the Study ... 12
Chapter 2 ... 14
Materials, Solutions and Buffers ... 14
2.1 Materials ... 14
2.1.2 PRR and Adenosine Receptor Ligands ... 15
2.1.3 BMDC and BMDM generation ... 15
2.1.4 ELISA ... 16
2.1.5 RNA Isolation, cDNA Synthesis, and qPCR ... 16
2.1.6 Flow Cytometry ... 17
2.2 Solutions and Buffers ... 18
2.2.1 Cell Culture Solutions ... 18
2.2.2. ELISA Buffers ... 19
2.2.3 Flow Cytometry Buffers ... 20
Chapter 3 ... 21
Methods ... 21
3.1 Cell Culture Procedures ... 21
3.2 Stem Cell Isolation from Bone Marrow ... 22
3.3 Generation of Bone Marrow Derived Dendritic Cells ... 22
3.4 Generation of Bone Marrow Derived Macrophages ... 22
3.5 Cell treatments for ELISA and Flow Cytometry ... 23
3.6 Cell treatments for qPCR ... 23
3.7 RNA Isolation with NucleoSpin® RNA kit ... 24
3.8 cDNA Synthesis ... 24 3.9 Quantitative-Real Time-PCR ... 25 3.10 ELISA... 26 3.11 Flow Cytometry ... 27 Chapter 4 ... 28 Results ... 28
4.1 Adenosine Receptors Expressions with or without the Danger Signals in BMDCs ... 28
4.2 Immunomodulatory Effects of Adenosine on BMDCs ... 31
4.2.1 Effect of Adenosine on Pro-Inflammatory Cytokine Secretion ... 31
4.2.2 Effect of Adenosine on Type-I Interferon Cytokine Secretion ... 32
4.2.3 Effect of Adenosine on Anti-Inflammatory Cytokine Secretion ... 33
4.2.4 Effect of Adenosine on cell surface activation markers on DCs ... 34
4.3 Effects of Adenosine on BMDCs at Transcriptional Level ... 36
4.3.1 Effect of Adenosine on mRNA Expression of Pro-Inflammatory Cytokines ... 37
4.3.2 Effect of Adenosine on mRNA Expression of Type-I Interferons ... 38
4.3.3 Effect of Adenosine on mRNA Expression of Anti-Inflammatory Cytokines ... 39
4.4 Adenosine Receptors Expressions with or without the Danger Signals in BMDMs .... 40
4.5 Immunomodulatory Effects of Adenosine on BMDMs ... 42
4.5.1 Effect of Adenosine on Pro-Inflammatory Cytokine Secretion ... 42
4.5.2 Effect of Adenosine on Type-I Interferon Secretion ... 43
4.5.3 Effect of Adenosine on TLR3 pathway in BMDMs ... 44
Chapter 5 ... 46
Discussion ... 46
Bibliography ... 51
List of Figures
Figure 1.1: Toll like receptor localization and signaling pathways ... 3
Figure 1.3: Integrated innate and adaptive immune responses ... 9
Figure 1.4: Purinergic signaling and its components ... 10
Figure 1.5: Adenosine receptor types related to different conditions ... 12
Figure 4.1: Danger signals increase the expression of A2A and A2B receptors ... 30
Figure 4.2: Adenosine receptor signaling decreases the secretion of pro-inflammatory cytokines in the presence of danger signals associated with MyD88 adaptor proteins ... 32
Figure 4.3: Adenosine receptor signaling decreases the secretion of Type-I Interferons in the presence of danger signals associated with MyD88 adaptor proteins ... 33
Figure 4.4: Adenosine receptor signaling increases IL-10 secretion in BMDCs stimulated with danger signals that can activate MyD88-dependent signaling events ... 34
Figure 4.5: Adenosine receptor signaling modulates the expression of co-stimulatory molecules in the presence of danger signals ... 35
Figure 4.6: Adenosine receptor signaling decreases the expression of activation markers in the presence of danger signals associated with MyD88 adaptor proteins ... 36
Figure 4.7: Adenosine receptor signaling decreases the mRNA expression of pro-inflammatory cytokines in the presence of danger signals associated with MyD88 adaptor proteins. ... 37
Figure 4.8: Adenosine receptor signaling has no effect on the mRNA expression of type-I Interferons in the presence of danger signals. ... 38
Figure 4.9: Adenosine receptor signaling increases the mRNA expression of IL-10 in the presence of danger signals associated with MyD88 adaptor proteins ... 39
Figure 4.10: Adenosine receptor signaling increases the mRNA expression of NR4A in the presence of danger signals associated with MyD88 adaptor proteins ... 40
Figure 4.11: Danger signals associated with MyD88 adaptor proteins increase the expression of A2A and A2B receptors ... 41
Figure 4.12: Adenosine receptor signaling decreases the secretion of pro-inflammatory cytokines in the presence of danger signals associated with MyD88 adaptor proteins ... 42
Figure 4.13: Adenosine receptor signaling does not have an effect on the secretion of type-I Interferons in the presence of danger signals. ... 43
List of Tables
Table 2.1: General materials used in laboratory and for cell culture. ... 15
Table2.2: PRR and adenosine receptor ligands used in experiments ... 15
Table2.3: K ODN used in experiments ... 15
Table2.4: Chemicals for BMDC and BMDM generation ... 16
Table2.5: Chemicals and materials used for ELISA experiments ... 16
Table2.6: Probes used for qPCR experiments ... 17
Table2.7: Antibodies used for flow cytometry experiments ... 17
Table 3.1: Ingredients and volumes of 2X master mix for cDNA synthesis per reaction. ... 24
Table 3.2: Program for cDNA synthesis ... 25
Table 3.3: Ingredients and volumes of master mix for taqman probes ... 25
Table 3.4: Ingredients and volumes of master mix for SYBR green protocol ... 25
Table 3.5: Program for Q-RT-PCR with taqman probes ... 26
Abbreviations
ACK Ammonium-Chloride-Potassium
ADA Adenosine deaminase
ADP Adenosine diphosphate
AMP Adenosine monophosphate
APC Antigen presenting cell
AR Adenosine receptor
ATP Adenosine triphosphate
BCR B cell receptor
BM Bone marrow
BMDC Bone marrow derived dendritic cell
BMDM Bone marrow derived macrophage
cAMP cyclic Adenosine monophosphate
CD Cluster of differentiation
cDC Conventional DC
CDN Cyclic dinucleotides
cDNA Complementary deoxyribonucleic acid
cGAMP
cyclic guanosine monophosphate-adenosine monophosphate
cGAS cyclic GAMP synthase
CXCL10 C-X-C motif chemokine 10
DAMPs Damage associated molecular patterns
DC Dendritic cell
ddH2O Double-distilled water
dH2O Distilled water
dsRNA Double-stranded RNA
DMSO Dimethyl sulfoxide
DNA Deoxyribonucleic acid
dNTP Deoxynucleotide triphosphate
EtOH Ethanol
FBS Fetal bovine serum
g gram
GAPDH Glyceraldehyde 3-phosphate dehydrogenase
GM-CSF Granulocyte macrophage colony-stimulating factor
GPCR G protein coupled receptor
HBSS Hank's balanced salt solution
HEPES 4-(2-hydroxyethyl)-1-piperazineethanesulfonic acid
IFN Interferon
IL Interleukin
ILC Innate Lymphoid Cell
IRF IFN-regulatory factor
L Liter
LPS Lipopolysaccharide
M Molar
MAP Mitogen-activated protein
M-CSF Macrophage colony-stimulating factor
mg Milligram
MHC Major histocompatibility complex
min Minute
mL Milliliter
mM Millimolar
mRNA Messenger ribonucleic acid
MyD88 Myeloid differentiation primary response gene 88
NECA 5' -N-Ethylcarboxamidoadenosine
NF- κB Nuclear factor- κB
N Normal
ng Nano gram
NK Natural killer
NLR NOD-leucine rich repeat receptors
NOD Nucleotide-binding oligomerization domain
NR4A Nuclear Receptor 4A
ODN Oligodeoxynucleotide
PAM PAM2CSK4
PAMP Pathogen associated molecular pattern
PBS Phosphate-buffered saline
PCR Polymerase chain reaction
pDC Plasmacytoid DC
PRR Pattern recognition receptor
Q-RT-PCR Quantitative real time polymerase chain reaction
RLR RIG-I like receptor
RNA Ribonucleic acid
Rpm Revolution per minute
RPMI Roswell Park Memorial Institute
RT Room temperature
STING Stimulator of Interferon Genes
TBK1 TANK-binding kinase 1
TCR T-cell receptor
TFH T follicular helper cell
TH T helper
TIR Toll/interleukin-1 receptor
TLR Toll-like receptor
TMB Tetramethylbenzidin
TNF𝛼 Tumor necrosis factor 𝛼
TRAF TNF receptor-associated factor
TRAM Translocating chain-associating membrane
Treg T regulatory cell
TRIF TIR-domain-containing adapter-inducing interferon-β
Chapter 1
Introduction
1.1 The Immune System
The immune system is the collection of defense mechanisms of the body, which protects the host from infectious agents, their toxins and the damage they cause. These defense mechanisms are composed of three levels: first anatomic and chemical barriers, second the innate immune system and last the adaptive immune system. The first level of defense – anatomic and chemical barriers – includes the skin, mucosal surfaces, and antimicrobial proteins [1]. The innate and adaptive immune systems include specialized cells called white blood cells or leukocytes, that arise from pluripotent hematopoietic stem cells of the bone marrow. If a pathogen could breach the anatomic and chemical barriers, it will encounter the components of innate immune defense first. This encounter will be sensed by receptors that are able to recognize a broad range of molecular patterns, found on innate immune cells. The response of innate immune defenses is fast and serve to induce inflammation by producing several cytokines and chemokines [2]. Although the innate immune cells can recognize a variety of molecular patterns thanks to their specialized receptors, their response is not antigen-specific, which is a limiting factor to their responses. At that point, the slower response of the adaptive immune system comes to aid, with its cells equipped with antigen-specific receptors and with a unique feature of generating immunological memory [2]. Despite the fact that the innate and adaptive responses are different in nature and how fast they are triggered, their integrated dynamics are crucial for a full and effective clearance of pathogens.
1.1.1 Innate Immunity
As mentioned before, innate immunity is the first line of immunological defense after a pathogen succeeds to evade the anatomical and chemical barriers. The innate responses are rapid as most of the invaders can be detected and cleared by innate immunity within minutes or hours. The innate defenses include antimicrobial enzymes and peptides, complement system and specialized cells such as macrophages, granulocytes, and dendritic cells [3]. These specialized cells are equipped with a variety of pattern recognition receptors (PRRs) that can detect pathogen-associated molecular patterns (PAMPs) or damage-associated molecular patterns (DAMPs) and then initiate an inflammatory response [3]. Each innate immune cell reacts to pathogens in a different and specialized way. Macrophages, granulocytes and DCs are all phagocytes, which means they are able to phagocyte a pathogen upon encountering with it. The greatest phagocytic activity is done by macrophages, which are the major phagocyte population in the normal tissues, and neutrophils, which are the rapid responders to inflammation. These cells are the scavengers of innate immunity, as they use phagocytosis with the purpose of killing. DCs, on the other hand, use phagocytosis with a special intend, to process proteins to generate peptide antigens and to present those antigens to T cells [4]. Therefore, dendritic cells are important bridges between innate and adaptive immune responses.
1.1.1.1 Pathogen Recognition Receptors
PRRs are composed of several innate sensor systems that are able to detect PAMPs and DAMPs [5]. They are classified into four groups based on their location and function: free receptors in serum; membrane-bound phagocytic receptors; membrane-bound signaling receptors, and cytoplasmic signaling receptors. Activation of a PRR in immune cells, such as macrophages or neutrophils, leads to secretion of several inflammatory cytokines and chemokines that serve to amplify the immune response [6]. Toll-like receptors (TLRs), NOD-like receptors (NLRs), RIG-1-NOD-like receptors (RLRs), and cytosolic DNA sensors such as STING are among several distinct classes of PRRs [7].
1.1.1.1.1 Toll-Like Receptors
Toll-like receptors (TLRs) are evolved to recognize distinct PAMPs [8]. There are 10 TLR subtypes in humans (TLR 1-10) and 12 (TLR1-9, TLR11-13) in mouse discovered so far [9]. They are well characterized as compared to other PRRs. They can be localized on cellular or endosomal membranes. Cell surface TLRs include TLR1, TLR2, TLR4, TLR5, TLR6, and TLR10 and they mainly recognize the membrane- or cell surface-associated patterns in pathogens. Whereas intracellular TLRs include TLR3, TLR7, TLR8, TLR9, TLR11, TLR12, and TLR13, which recognize nucleic acids derived from bacteria or viruses [5, 9, 10].
TLRs are composed of an ectodomain, which takes role in PAMP recognition, a transmembrane domain, and also a cytoplasmic domain, which contains a TIR (Toll-IL-1 receptor) domain that takes role in the initiation of downstream signaling [11]. The recognition of PAMPs leads to a signaling pathway that results in the activation of NF-KB, IRFs, or MAP kinases to regulate the expression of cytokines, chemokines, and type I IFNs. This is mediated by several adaptor proteins such as MyD88, TRIF, TIRAP/MAL, or TRAM [12-14]. MyD88 is utilized by all TLRs except for TLR3 and activates the transcription factor NF-KB that induces the expression of inflammatory cytokines. TRIF is utilized by TLR3 and TLR4, which leads to activation of IRF3 that induces the expression of type I IFNs [15, 16]. The overall scheme for TLR signaling can be found in figure 1.1.
1.1.1.1.1.1 TLR1, TLR2 and TLR6 signaling
TLR2 is a cell surface receptor, which recognizes a variety of PAMPs including lipoproteins and lipopeptides, peptidoglycan and lipoteichoic acid from mostly Gram-positive and some Gram-negative bacteria [18]. Ligand binding to TLR2 induces heterodimer formation with TLR1 or TLR6. This heterodimer formation is actually the reason for why there is a variety of PAMPs that can be recognized by TLR2 complexes [19]. This receptor is coupled to MyD88 adaptor protein that leads to NF-KB activation [16].
1.1.1.1.1.2 TLR3 signaling
TLR3 is an intracellular TLR expressed on endosomal surfaces and recognizes dsRNA, which is produced by viruses during replication [20]. One example for dsRNA viruses are rotaviruses that causes gastroenteritis in human. TLR3 is coupled to TRIF adaptor protein that leads to activation of IRF3 to induce synthesis of type I IFNs and exert anti-viral activities [21].
1.1.1.1.1.3 TLR4 signaling
TLR4 is a cell surface receptor and recognizes lipopolysaccharide (LPS) of Gram-negative bacteria such as E.coli and Salmonella. Unlike other TLRs, TLR4 utilizes the accessory proteins MD-2 and CD14 to recognize its ligand [22]. It is coupled to both MyD88 and TRIF leading to induction of both inflammatory cytokines and type I IFNs [23].
1.1.1.1.1.4 TLR9 signaling
TLR9 is an intracellular TLR expressed on endosomal surfaces and recognizes unmethylated CpG dinucleotides [24]. This receptor is primarily expressed on pDCs, which have a great capacity to produce type I IFNs [25]. Normally TLR9 is coupled to MyD88 adaptor protein that leads to NF-KB activation, but it can induce type I IFNs through IRF7 [26]. Presence of this receptors in intracellular compartments allow this interaction and activation of type-I interferon pathway unlike TLR2.
1.1.1.1.2 STING signaling
STING (stimulator of interferon genes) is a cytosolic sensor of infection, which recognizes bacterial cyclic dinucleotides (CDNs) [27]. CDNs are bacterial second messengers, which results in type I interferon production by leading to activation of TBK1 that activates IRF3 upon recognition by STING [28]. Besides, bacterial infection, STING also has a role in antiviral immunity. This antiviral immunity is mediated by the second messenger cGAMP (cyclic guanosine monophosphate-adenosine monophosphate), which is generated by the enzyme cGAS (cyclic GAMP synthase) upon DNA entry into the cells. These events leads to production of type I interferons [29]. The intracellular STING signaling is summarized in figure2.
1.1.1.2 Innate Immune Responses after Danger Signaling
As mentioned before, recognition of PAMPs and DAMPs via PRRs by innate immune cells leads to inflammation. Inflammatory responses after pattern recognition are further amplified by autocrine-paracrine recognition of secreted inflammatory cytokines and chemokines [2]. These cytokines include pro-inflammatory cytokines such as TNF-a, IL-1beta, and IL-6, and anti-viral cytokines such as type I interferons. The pro-inflammatory cytokines promote inflammation by means of activating lymphocytes, vascular endothelium, increasing vascular permeability and fluid drainage to lymph nodes [31]. Type I interferons on the other hand, help defend against viral infections by inducing a cellular cascade that results in the degradation of viral RNA, and inhibition of viral replication, and proliferation of infected or adjacent cells [32]. Besides the production of cytokines, PRR activation in macrophages and DCs also leads to induction of co-stimulatory molecules, which enables antigen presentation forming a link between innate and adaptive immunity. CD80 and CD86 are two important co-stimulatory molecules, which are recognized by co-co-stimulatory receptors expressed by adaptive immune cells [33].
1.1.1.3 Macrophages
Macrophages are phagocytic cells that can be found in almost all tissues. Because they are high in number and they show superior phagocytic activity as compared to other immune cells, they provide a first line of innate immune defense against pathogens [34]. Besides their phagocytic activity, they play a crucial role in the initiation of inflammation by releasing cytokines and also take role in the amplification of adaptive responses by promoting antigen presentation to T cells [35].
1.1.1.4 Dendritic Cells
Dendritic cells (DCs) are the professional antigen-presenting cells (APCs) of the innate immunity. There are two types of DCs: conventional DC (cDC), and plasmocytoid DC (pDC) [36]. The main function of cDCs is to process and present the antigens to T cells of adaptive immunity. They acquire these antigens via phagocytosis of pathogens or infected cells [37]. This makes them an important bridge between innate and adaptive immunity. pDCs on the
other hand, are specialized to produce type I interferons [38]. These two types of DCs can be distinguished with different cell-surface markers and transcription factors.
When a cDC encounter pathogen in the peripheral tissues, it is activated by PAMPs. This activation leads to processing of antigens, expression of co-stimulatory molecules and migration to lymphoid tissues, where naïve T cells reside. In the lymphoid tissues, DCs can prime both CD4 and CD8 T cells via their MHC class I, MHC class II, and co-stimulatory molecules. This priming leads to initiation of adaptive immune responses [38, 39].
1.1.2 Adaptive Immunity
While PRR recognition of PAMPs provides limited specificity to innate immune system, the adaptive immune system cells are equipped with a variety of antigen specific receptors, which results in more specificity and sensitivity [40]. There are two major classes of adaptive immune cells: B lymphocytes or B cells, and T lymphocytes or T cells. B cells are the source of antibodies, whereas T cells require the peptides from pathogens to be presented o MHC class I or MHC class II molecules by infected cells or APCs. T cells are further divided into 2 types: CD8 (cytotoxic) T cells, and CD4 (helper T cells). Once activated, CD4 T cells are further divided into subsets based on the signals they receive [2, 40, 41].
Adaptive immune responses are initiated in peripheral lymphoid tissues, where T and B cells can be activated by APCs or helper T cells. After activation they start losing signals for their homing to lymphoid organs, they exit the lymph nodes, and they clear the host of pathogens in an antigen specific manner [40, 42].
1.1.3 Integrated Immune Response
Immune system of the host resists infections in several ways. First step is the innate immune defenses, which is a very rapid process and involves the recognition of the pathogens with limited specificity via PRRs [3]. However, some pathogens are able to evade the innate immune defenses. In this case, the specialized cells of innate immunity should initiate the adaptive responses, which require several days to develop due to their requirement for antigen presentation, selection of right T and B cell clones and proliferation of antigen specific B and T cells [40]. Meanwhile, innate lymphoid cells (ILCs) and NK cells take the stage as they are intermediate between innate and adaptive cells and have unique mechanisms for recognizing
stresses and infected cells and also helping activation of other innate and adaptive immune cells by production of various cytokines [43].
Both subsets of T cells of the adaptive immunity require priming by DCs in lymphoid tissues to get activated. For this, CD4 T cells require the antigens to be presented on MHC class II molecules, whereas CD8 T cells require them to be presented on MHC class I molecules. The peptide antigen:MHC complexes are recognized by TCRs and the co-receptors (CD4 and CD8) of T cells. For naïve T cells to be primed, the interaction between co-stimulatory molecules on DCs and co-stimulatory receptors on T cells is crucial as well. After a T cell is primed however, it does not require interactions with co-stimulatory molecules to recognize the antigen [44-47]. The other signal that is required for activation of T cells is the cytokines. Cytokines leads to differentiation of CD4 T cells into subsets such as: TH1, TH2, TH17, TFH, and Treg cells [46]. All of these subsets require different combinations of cytokines to be generated and take role in defense against different types of pathogens and immune modulation [48]. In contrast to several different subsets of CD4 T cells, CD8 T cell activation results only in effector cytotoxic T cell formation, which is specialized in target specific elimination of infected cells [49].
B cells recognize the antigens via their B cell receptor (BCR), and don’t require APCs to present the antigens. They can both recognize the soluble antigens and antigens on antigen-presenting cells or on pathogens. However, after antigen recognition, they receive help from CD4 T cells to be able to expand and to produce higher affinity antibodies [50-52].
An effective and successful immune response, primed by innate immune responses, leads to a state of protective immunity. This state is achieved by the sensor cells, effector cells and molecules produced initially, and also immunological memory. This is enabled by the successful integration of innate and adaptive immune responses.
Figure 1.3: Integrated innate and adaptive immune responses [53].
1.2 Purinergic Signaling and Adenosine Receptors
As the name implies, purinergic signaling is a form of extracellular signaling induced by purine nucleotides or nucleosides such as ATP and adenosine. ATP, the energy currency of cells, can be released into extracellular environment from damaged or stressed cells. ATP can be absorbed by immune cells and activate inflammasome complex resulting in release of highly pro-inflammatory cytokine IL-1beta. Therefore, extracellular ATP acts as a danger signal and activates innate immune responses [54]. After its release to extracellular environment, ATP is hydrolyzed to ADP, AMP, and adenosine by ectonucleotidases such as CD39 and CD73. After this, extracellular adenosine is recognized by P1 receptors, which are specialized to sense adenosine [55, 56]. P1 receptors are GPCRs and divided into 4 subtypes: A1, A2A, A2B, and A3 receptors. A2A and A2B are Gs coupled receptors and their activation
leads to accumulation of cAMP levels in the cell. A1 and A3 receptors are Gi coupled
receptors and their activation decreases intracellular cAMP [56, 57]. The overall scheme for purinergic signaling can be found in figure 1.4.
Figure 1.4: Purinergic signaling and its components [56]
1.2.1 Adenosine Signaling and Immune Response
Immune cells express adenosine receptors on their cell surface, which makes them responsive to extracellular adenosine. This effect of adenosine on immune cells has reported to suppress their activation. This suppressive effect is most clearly observed in inflammatory conditions [58]. It has been shown that adenosine affects the cytokine production from macrophages and DCs through mainly A2A and A2B receptors [59]. Adenosine decreases the secretion of TNF-a in mTNF-acrophTNF-ages, TNF-and shifts the cytokine profile from pro-inflTNF-ammTNF-atory to TNF-anti-inflTNF-ammTNF-atory phenotype in DCs [57]. In DCs adenosine suppresses the production of IL-12, while increasing the production of anti-inflammatory IL-10. This shift in cytokine responses results in the reduced capacity to induce TH1 cells, whereas an increased capacity to induce TH2 or Treg cells [57]. Besides macrophages and DCs, effect of adenosine on neutrophils was also observed. Adenosine inhibits the recruitment of neutrophils to the site of inflammation via altering the expression of adhesive molecules on their cell surface [57]. Apart from its ability
lymphocytes. It was shown that adenosine exerts this effect mainly through A2A receptors [60]. Adenosine, by inhibiting IL-2 secretion, reduces the proliferation of activated CD4 T cells. It also suppresses the production of IL-4 and IFN-gamma produced by naïve or polarized CD4 T cells. It also results in upregulation of negative co-stimulatory molecules. Adenosine decreases IL-2 production by CD8 cells as well. It was shown that immunosuppressive Treg cells were dependent on adenosine to exert their immunosuppressive effects, as Tregs isolated from CD39 knock-out mice were not able to suppress proliferation of CD4 T cells [54, 56, 57, 60]. All these observations suggest that adenosine is generally viewed as an immunosuppressive molecule.
1.2.2 Therapeutic Targeting of Adenosine Receptors
Adenosine receptors are expressed by many tissues in a subtype-specific manner and play important roles in several different physiological processes. For instance, A1 and A2A receptors have a role in cardiovascular system such as reduction of heart rate or atrial contractility [61]. These receptors also have important effects on nervous system as they regulate the neurotransmitter secretion [62]. The most well-known antagonist for adenosine receptors to take role in the regulation of nervous system is caffeine. Besides these effects on several tissues, as described before, they take role in the regulation of several immune cells. Therefore, adenosine receptors are viewed as important drug targets for immune related conditions. The receptor types and targeting strategies to different types of diseases and conditions can be found in figure 1.5.
Other than the conditions summarized in figure 1.5, there is a great evidence that adenosine accumulates in tumor microenvironment and form an immunosuppressive shield against infiltrating immune cells while promoting angiogenesis [58]. Since adenosine receptors are also expressed on cancer cells, adenosine can directly regulate cancer survival and metastasis. These effects on cancer cells and tumor microenvironment make adenosine receptors a potential target or cancer therapies.
Figure 1.5: Adenosine receptor types related to different conditions [62].
1.3 Aim of the Study
In summary immunological danger signals come in different forms, can be from endogenous or exogenous resources, and recognized by antigen presenting cells (APCs) and phagocytes via their pattern recognition receptors (PRRs). PRRs recognize danger associated molecular patterns (DAMPs) and pathogen associated molecular patterns (PAMPs) [5,6]. They are found on cytoplasmic membrane, endosomal membranes or in the cytosol. Toll like receptors (TLRs) are a type of PRRs that can recognize a variety of PAMPs and can induce different responses via different adaptor proteins. These are MyD88, which leads to production of inflammatory cytokines, and TRIF that mainly leads to production of type-I interferons [12,15]. Other than TLRs, STING is a recently discovered DNA-sensing pathway that can induce expression of type-I interferons, when activated by the cytosolic second messenger
cGAMP [28]. ATP is released into extracellular environment from cells in stressed conditions, which makes it an indicator of stress and thus stimulates immune response. ATP is hydrolyzed to adenosine in the extracellular environment by CD39 and CD73 enzymes. Adenosine is known to act as an immunosuppressive metabolite as a negative feedback [54-56].
This thesis investigates the role of adenosine on different danger signaling pathways, particularly on TLR-2, TLR-3, TLR-4, TLR-9 and STING pathways. These receptors are chosen based on their locations and adaptor proteins they utilize to cause immunological responses. TLR-2 and TLR-4 are located on cellular membrane, whereas TLR-3 ad TLR-9 are located on endosomal membranes, and STING is a cytosolic sensor. TLR-2 and TLR-9 are MyDD8-dependent pathways, whereas TLR-3 is TRIF-dependent. TLR-4 is dependent on both MyD88 and TRIF. Although adenosine is known to suppress immune responses, basal level of adenosine in extracellular space is sufficient to activate all major adenosine receptors. Yet both innate and adaptive immune responses can take place even in the presence of extracellular adenosine suggesting that adenosine can be permissive to certain aspects of danger signaling. This study investigates if adenosine signaling particularly affects one danger signaling more than the other. Targeting aforementioned TLRs with known signaling patterns and using key cytokines as readouts downstream of these signaling pathways we tried to answer this important question, which also has very important implications in targeting adenosine receptors to develop novel immunotherapies or to formulate new vaccines.
Chapter 2
Materials, Solutions and Buffers
2.1 Materials
2.1.1 General Laboratory and Cell Culture Reagents and Materials
The materials for general usage and cell culture studies can be seen in Table 2.1. All plastic materials for cell culture usage such as flasks, multi-well plates and cryovials were purchased from Greiner Bio-One GmbH, Austria.
Material Catalog No Brand
ADA (Adenosine Deaminase) 10102105001 Roche, USA
HBSS BE10-547F Lonza, Switzerland
RPMI 1640 medium 21875-034 Gibco, USA
Sodium Pyruvate (100 mM) S8636 Sigma, USA
Accutase SCR005 Merck Millipore, Germany
Penicillin-Streptomycin 17-745E Lonza, Switzerland
Trypsin BE17-161E Lonza, Switzerland
FBS S181G-500 Biowest, USA
AccuGENE molecular biology water BE51200 Lonza, Switzerland
DMSO D12345 Life Technologies, USA
Stericup-GP 0.22um Filter SCGPU05RE Merck Millipore, Germany Freezing container, Nalgene® Mr. Frosty NG-5100-0001 Nalgene, USA
Table 2.1: General materials used in laboratory and for cell culture.
2.1.2 PRR and Adenosine Receptor Ligands
Ligands used to stimulate PRRs and adenosine receptors can be seen in Tables 2.2 and 2.3. K ODN was a kind gift from Gürsel lab.
Material Catalog No Brand
Ultrapure LPS from Salmonella minnesota R595
tlrl-smlps Invivogen, USA
Pam2CSK4 tlrl-pm2s-1 Invivogen, USA
Poly(A:U) tlrl-pau Invivogen, USA
2’3’-cGAM(PS)2 (Rp/Sp) (Sting ligand) tlrl-cga2srs Invivogen, USA
NECA 35920-39-9 TOCRIS Bioscience,
Bristol, UK
Table2.2: PRR and adenosine receptor ligands used in experiments
Material Sequence Brand
K23-PS TCGAGCGTTCTC Alpha-DNA, Canada
Table2.3: K ODN used in experiments
2.1.3 BMDC and BMDM generation
Chemicals and other reagents used for BMDC and BMDM generation can be found in table 2.5
Chemical Catalog No Brand
Recombinant Mouse GM-CSF 576306 Biolegend, USA
Recombinant Mouse M-CSF 576404 Biolegend, USA
HEPES solution H0887-100ML Sigma Aldrich, USA L929 cell line
Table2.4: Chemicals for BMDC and BMDM generation
2.1.4 ELISA
Materials and chemicals used for ELISA experiments can be found in table 2.6.
Chemical Catalog No Brand
Mouse IL-12 (p40) ELISA MAX™ Standard 431602 Biolegend, USA
Mouse TNF-α ELISA MAX™ Standard 430902 Biolegend, USA
Mouse IL-10 ELISA Kit with Pre-Coated Plates 431418 Biolegend, USA Mouse IFN-β ELISA Kit with Pre-coated Plates 439408 Biolegend, USA Nunc-Immuno™ MicroWell™ 96 well solid plates M9410-1CS Sigma Aldrich, USA
TMB substrate set 421101 Biolegend, USA
Table2.5: Chemicals and materials used for ELISA experiments
2.1.5 RNA Isolation, cDNA Synthesis, and qPCR
For RNA isolations, NucleoSpin® RNA kit (Cat. No: 740955.50) from Macherey-Nagel is used. cDNA from RNA is synthesized by High-Capacity cDNA Reverse Transcription Kit (Cat. No: 4368814) from Applied Biosystems, USA. SUPERase In™ RNase Inhibitor (Cat. No: AM 2694) was used from Life Technologies, USA as RNase inhibitor in cDNA synthesis experiments. Quality control of RNAs and cDNAs is done with the Thermo Scientific™ NanoDrop™. qPCR from cDNAs is performed by using TaqMan® Universal Master Mix II, no UNG (Cat. No: 4440040) from Thermo Scientific, USA. For some genes, SYBRgreen Fast Mix (Cat. No: P/N84067) from Quanta Biosciences, USA is used as well. Probes used for qPCR experiments can be found in table 2.7.
Chemical Catalog No Brand
Mm01308023_m1 (Adora1) 4331182 Life Technologies, USA
Mm00802075_m1 (Adora2a) 4331182 Life Technologies, USA
Mm01296602_m1 (Adora 3) 4331182 Life Technologies, USA
Mm00443258_m1 (TNFa) 4331182 Life Technologies, USA
Mm00434174_m1 (IL-12 p40) 4331182 Life Technologies, USA
Mm00439552_s1 (interferon beta 1) 4331182 Life Technologies, USA
Mm00439614_m1 (IL-10) 4331182 Life Technologies, USA
Mm00607939_s1 (beta actin) 4331182 Life Technologies, USA
Mm01300401_m1 (NR4A1) 4331182 Life Technologies, USA
Mm00443060_m1 (NR4A2) 4331182 Life Technologies, USA
Mm00450074_m1 (NR4A3) 4331182 Life Technologies, USA
CXCL10 primer QT00093436 Qiagen, Germany
GAPDH primer QT01658692 Qiagen, Germany
Table2.6: Probes used for qPCR experiments
2.1.6 Flow Cytometry
The antibodies used for flow staining can be found in table 2.8
Chemical Catalog No Brand
Mouse Anti-CD86 PE 12-0861-83 Ebiosciences, USA
Mouse Anti-CD80 APC
Mouse Anti-MHCI AF647 116512 Biolegend, USA
Mouse Anti-MHCII PECy5
Mouse Anti-CD16/CD32 14-061-85 Ebiosciences, USA
LIVE/DEAD® Fixable Green Dead Cell Stain Kit
L34970 Life Technologies, USA.
2.2 Solutions and Buffers
2.2.1 Cell Culture Solutions
All solutions for cell culture are stored at 4 oC.
RPMI-1640 (with L-Glutamine)
10% FBS (heat inactivated at 55 °C and filtered) 5 ml Penicillin/Streptomycin
5 mL Na Pyruvate
Freezing Medium
10% DMSO in FBS (heat inactivated at 55 °C and filtered)
BMDC Medium Complete RPMI 50 M 2-mercaptoethanol 5 ng/ml GM-CSF BMDM Medium Complete 5% RPMI 10mM HEPES 10ng/mL M-CSF, 30% L929 conditioned medium.
ACK Lysis Buffer 8.3g NH4Cl
1g KHCO3
1L double distilled water pH adjusted to 7,4
2.2.2. ELISA Buffers Coating Buffer: 8.4g NaHCO3 3.56g Na2CO3 1L ddH2O pH adjusted to 9.5 Stored at 4 oC. Assay Diluent
10% FBS (Heat inactivated at 55 oC and filtered) in PBS Stored at 40C
Wash Buffer
0.05% Tween20 in PBS Stored at room temperature.
10X PBS (Phosphate Buffered Saline) 80 g NaCl 2 g KCl 15,2 g Na2HPO4. H2O 2,4 g KH2PO4 1 L ddH2O pH adjusted to 7.4 Sterile filtered
Stored at room temperature.
Stop Solution 2N H2SO4 in dH2O
2.2.3 Flow Cytometry Buffers
FACS Buffer
2% FBS and 0.25% Sodium Azide in HBSS Stored at +4 °C
Chapter 3
Methods
3.1 Cell Culture Procedures
Cell Counting: After cells are collected via centrifugation, they are solved in appropriate volume of medium according to their confluency. Then 10 μl of this solution is mixed with 10 μl of tryphan blue. 10 μl of this mix is placed on hemocytometer and all 4 corners are counted. The cell number is found by dividing the result with 4, multiplying with 2, volume of medium (as mL) and 104.
Freezing of Cells: Cells should reach to an optimum confluency. They are washed twice with HBSS. Detached by appropriate method (Accutase/trypsin treatment or scraping). Collected into a 15-mL falcon and centrifuged at 1500 rpm for 5 minutes. Supernatant is aspirated and suspended in 1 mL FBS (heat inactivated, filtered). They are counted with hemocytometer and distributed into cryovials so that each cryovial will contain 5x10⁶ cells. The volume of the FBS in the vials are adjusted to 500 μl. Finally, 500 μl of 20% freezing medium is added into vials, so that the final concentration of DMSO will be 10% in freezing medium. The cryovials are placed in -80oC freezer within the Mr. Frosty container. For long term storage, the vials are transferred to liquid nitrogen.
Thawing of Cells: The vials are placed in 37oC water bath as soon as they are taken from
liquid nitrogen tanks. They are thawed rapidly. Partially melted vials are solved with cold medium and transferred into 15-mL falcon containing cold medium. Centrifuged at 1500 rpm
for 5 minutes at 4oC. Supernatant is aspirated and cells are solved in 37oC medium and
transferred to appropriate vial.
3.2 Stem Cell Isolation from Bone Marrow
Appropriate number of C57/BL6 mice are sacrificed. Femur and tibia are taken, placed into a falcon containing ice cold HBSS. One edge of the bones is cut and placed into 0.6 mL tubes with wholes at the bottom, the cut edge of the bones facing the whole. These 0.6 mL tubes are placed in 1.5 mL tubes. Centrifuged at 7000 rpm for 30 seconds. The cells collected at the bottom of 1.5 mL tube are suspended with 0.5 mL HBSS and transferred into 50 mL falcons. 3 mL of ACK lysis buffer is added and incubated for 3 minutes at room temperature. The rest of the falcon is filled with HBSS and centrifuged at 1200 rpm for 5 minutes. Supernatant is aspirated and cells are solved in appropriate volume of appropriate medium. They are counted and used either for BMDC or BMDM generations.
3.3 Generation of Bone Marrow Derived Dendritic Cells
On day 0, After stem cells isolated from bone marrows are counted, they are placed in bacterial petri dishes in 10 mL of BMDC medium containing 2x10⁶ cells. They are placed in 37oC cell culture incubators. On days 3 and 8, the dishes are supplemented with further 10 mL
of BMDC medium. On day 6, 10 mL from the dishes are taken into 50 mL falcons and centrifuged at 1200 rpm for 5 minutes. Supernatant is aspirated, cells are solved in new 10 mL BMDC medium and placed into dishes again. On day 10, the suspension cells and poorly adherent cells are collected by pipetting. They are taken into 50 mL falcons and centrifuged at 1200 rpm for 5 minutes. After that cells can be used in an experiment or can be frozen. Some of the cells are taken for quality control and stained with CD11b, CD11c, Gr1, Live-dead antibodies according to flow cytometry protocol.
3.4 Generation of Bone Marrow Derived Macrophages
On day -1, after the stem cells isolated from a mouse, they are placed in a cell culture dish in 10 mL of BMDM medium without L929 medium addition. The dish is placed in a 37oC cell
culture incubator. On day 0, 15 mL BMDM medium that contains 50% L929 medium is mixed with the medium that contains non-adherent cells from day -1. This mixture is distributed into 6-well low attachment plate as 4 mL per well. On days 3 and 5, 1.5 mL of BMDM medium is added to wells. On day 7, the cells are collected into 50 mL falcons from the wells by pipetting. They are washed twice with HBSS by centrifugation at 1200 rpm for 5 minutes. They are either frozen or used in an experiment after they are pre-incubated overnight.
3.5 Cell treatments for ELISA and Flow Cytometry
Fresh or thawed cells are seeded into 96-well plates in 100 μl RPMI medium. For DCs, 300.000 cells per well is used, whereas for macrophages 100.000 cells per well is used. Cells are pre-incubated for 2 hours and the medium is discarded. 100 μl of fresh medium with ADA (1 unit) is added into wells. Cells are incubated for 1 hour. Cells are stimulated with 50 μl medium that contains PRR ligands and 50 μl medium that contains NECA. For wells that do not contain NECA, medium containing same volume of DMSO is added. Cells are incubated overnight. After that, the plate is centrifuged at 1000 rpm for 5 minutes. Supernatant is taken into new plate and it is either used in ELISA experiment or stored at -20oC. The cells are detached by cold HBSS and Accutase treatment and used in flow staining.
3.6 Cell treatments for qPCR
Fresh or thawed cells are placed into 50 mL falcon in 20 mL RPMI medium. They are pre-incubated for 2 hours while the lid of the falcon is partially closed and placed inclined. They are centrifuged at 1200 rpm for 5 minutes. The medium is aspirated and cells are solved in fresh medium that contains 1 unit ADA. They are distributed into round bottom polystyrene tubes in 200 μl medium so that each tube contains 1x10⁶ cells. They are incubated for 1 hour.
Cells are stimulated with 100 μl medium that contains PRR ligands and 100 μl medium that contains NECA. For tubes that do not contain NECA, medium containing same volume of DMSO is added. They are incubated for appropriate times. After that the tubes are placed on ice and washed twice with HBSS by centrifugation at 1400 rpm for 5 minutes. They are lysed with 350 μl of RNA isolation kit component RA1 buffer. 3.5 μl of B-mercaptoethanol is
added into tubes. After that either RNA isolation is performed or the samples are stored at -80oC.
3.7 RNA Isolation with NucleoSpin® RNA kit
Isolation is done according to manufacturer’s guide. The only exception is the last step, which is done in 2 steps by using 20 μl of nuclease free water in each step. Thus the final volume in which the RNA eluted is 40 μl. The isolated RNAs are kept at -80oC until the cDNA synthesis is done.
3.8 cDNA Synthesis
cDNA synthesis is done with the High-Capacity cDNA Reverse Transcription Kit. Master mix ingredients and volumes can be seen in table 3.1.
2X Master mix (for 1 reaction)
Components Volume (l) per Reaction
10X RT Buffer 2 25X dNTP Mix (100mM) 0,8 10X RT Random Primers 2 Reverse Transcriptase 1 Rnase Inhibitor 1 Nuclease-free Water 3,2
Total per Reaction 10
Table 3.1: Ingredients and volumes of 2X master mix for cDNA synthesis per reaction.
After the master mix is prepared, 10 l of master mix is distributed into PCR tubes. 10 l of RNA sample is added into corresponding tube. The tubes are spun down. Then they are placed in PCR machine and the program seen in table 3.2 is applied. After the program is
completed, quality assessment is done and they are diluted 1:5 with nuclease free water. For long term storage, they are placed at -20oC.
Step 1 Step 2 Step 3 Step 4
Temperature 25 37 85 4
Time 10 min 120 min 5 min ∞
Table 3.2: Program for cDNA synthesis
3.9 Quantitative-Real Time-PCR
To measure the relative mRNA expressions, Q-RT-PCR is used. For most of the genes Taqman probes are used. The ingredients for master mix prepared for taqman probes can be seen in table 3.3. For SYBR green mixture, see table 3.4
Components Volume per 10 l Reaction (l)
20X Taqman Gene Expression Assay 0.5 2X Taqman Gene expression Master Mix 5
cDNA Template 2
RNase free water 2.5
Table 3.3: Ingredients and volumes of master mix for taqman probes
Components Volume per 10 l Reaction (l) 20X Taqman Gene Expression Assay 1
2X PerfeCTa SYBR Green FastMix 5
cDNA Template 2
RNase free water 2
The mix is prepared without the cDNA template and 8 μl of it is distributed into the wells of PCR plate. cDNA is added into corresponding wells. The plate is sealed and centrifuged at 1000 rpm for a minute. Then it is placed in PCR machine. For taqman probes, the program seen in table 3.5 is applied. For SYBR green, the program seen in table 3.6 is applied.
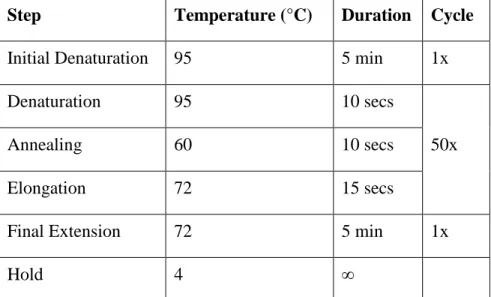
Step Temperature (°C) Duration Cycle
Initial Denaturation 95 5 min 1x
Denaturation 95 10 secs
50x
Annealing 60 10 secs
Elongation 72 15 secs
Final Extension 72 5 min 1x
Hold 4 ∞
Table 3.5: Program for Q-RT-PCR with taqman probes
Step Temperature (°C) Duration Cycle
Initial Denaturation 95 3 min 1x
Denaturation 95 15 secs
40x
Annealing 60 60 secs
Final Extension 72 5 min 1x
Hold 4 ∞
Table 3.6: Program for Q-RT-PCR with SYBR green
3.10 ELISA
IFN-b and IL-10 detections: ELISA protocols are done according to manufacturer’s guide. TNF-a and IL-12 detections: ELISA protocols are done according to manufacturer’s guide with few exceptions. Coating and detection antibodies, TMB substrate and stop solution is
used 50 μl per well instead of 100 μl. The highest standard concentration is 1000 pg/mL instead of 500 pg/mL, which is followed by 6 two-fold serial dilutions.
3.11 Flow Cytometry
All steps of flow cytometry protocol are performed on ice. Cells are taken into v-bottom plates. They are washed twice with 200 μl FACS buffer by centrifugation at 1400 rpm for 5 minutes. Samples are resuspended in 50 μl FACS buffer containing 1:50 diluted Fc block (Anti-CD16/CD32 antibody). They are incubated at dark for 5 minutes. 50 μl FACS buffer containing 1:200 diluted antibody cocktail is added. Samples are incubated for 30 minutes at dark. They are washed with 200 μl FACS buffer by centrifugation at 1400 rpm for 5 minutes. Samples are suspended in 150 μl FACS buffer and transferred into flow tubes. 120 μl of each sample is read.
Chapter 4
Results
4.1 Adenosine Receptors Expressions with or without the Danger Signals in BMDCs
Previous studies including ours have demonstrated the importance of adenosine receptor signaling in antigen presenting cells. In this study we aimed to test if the effect of adenosine on antigen presenting cells changes based on the nature of danger signaling. For this aim we used bone marrow-derived dendritic cells (BMDCs) as a primary professional antigen presenting cells type because: 1. These cells can represent inflammatory dendritic cells while having antigen cross-presentation capability, 2. Very high numbers of these cells can be obtained to do biochemical and cellular analysis [63, 64]. To mimic adenosine receptor signaling we used NECA, a cell impermeable and stable adenosine analog [65]. This way we were sure the effects we observed is not through adenosine’s potential effects through other intracellular pathways than receptor signaling. We pretreated the cells with the enzyme ADA (Adenosine deaminase), which breaks done the adenosine molecules, to eliminate the effect of endogenous adenosine. As danger signals we used 1. ultrapure S. Minnesotta LPS, which activates only TLR4 [66], which occurs especially during gram negative bacterial infections or during tumor release of HMGB1, an endogenous signal for TLR4 [67], 2. PAM2CSK4
(PAM) a synthetic peptide that mimics lipoproteins on both gram positive and gram negative bacteria and activates TLR2 pathway [68], 3. Stable cGAMP which activates STING/IRF3/type I interferon pathway during auto-inflammatory or sterile inflammatory conditions as a danger signal [69], 4. CpG DNA, which is prevalent among bacterial DNA and activates TLR9 [70]. In some experiments we used pA:U, which is a TLR3 ligand and activates only the TRIF pathway [71]. For the experiments in which pA:U was used, we had
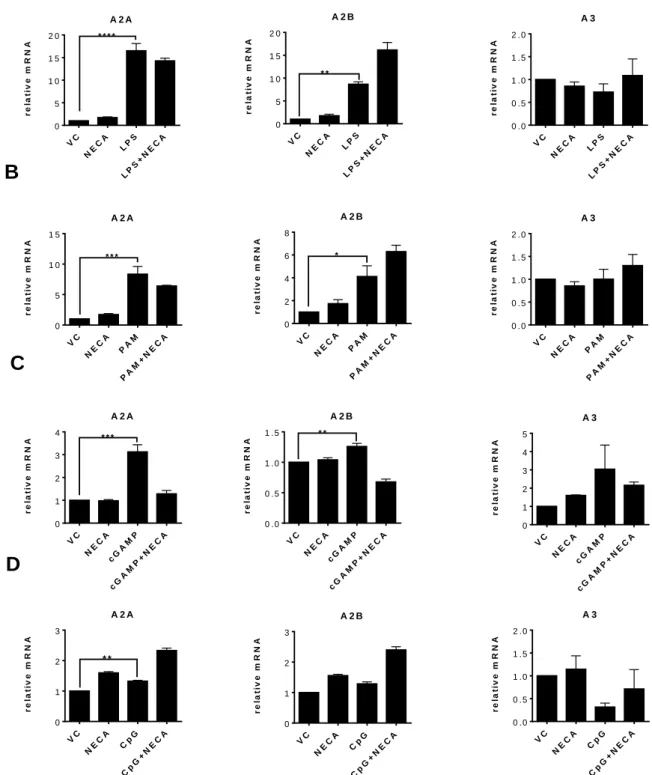
to switch to bone marrow-derived macrophage (BMDM) system because BMDCs were not responsive to pA:U. Before testing the effect of adenosine signaling on these danger signals we optimized the concentrations of these chemicals. We performed dose response experiments to see the optimum dose in which the danger signals can lead to highest secretion of their corresponding cytokines. We saw that the following concentrations were optimum for these chemicals in BMDCs: LPS: 300 ng/ml, Pam2CSK4: 10 ng/mL, cGAMP: 1g/ml, CpG: 3 M, pA:U: 30 g/ml, and NECA: 3 M (Data not shown). Next we tested the expression of all adenosine receptor types in response to danger signals in the presence or absence of NECA in BMDCs to test what adenosine receptor subtypes are affected by danger signaling and if the presence of adenosine influences the expression of adenosine receptor subtypes. Our results indicated that A2A, A2B, A3 but not A1 adenosine receptors are expressed in BM-DCs (Figure 4.1). All the danger signals were able to increase expression of both A2A and A2B receptor. Among all the danger signals the ones activating the cell surface TLRs, TLR4 and TLR2, were the most potent in increasing adenosine receptor expression (Figure 4A. and B.). A3 receptor expression did not change after BMDC stimulation. Addition of NECA slightly increased especially A2B receptor expression after LPS, PAM and CpG but not the other adenosine receptors. NECA alone did not have any significant effect on adenosine receptor expression (Figure 4.1).
VC NE CA LPS LP S+ NE CA 0 5 1 0 1 5 2 0 r e la ti v e m R N A A 2 A * * * * VC NE CA LPS LP S+ NE CA 0 5 1 0 1 5 2 0 r e la ti v e m R N A A 2 B * * VC NE CA LPS LP S+ NE CA 0 .0 0 .5 1 .0 1 .5 2 .0 r e la ti v e m R N A A 3 VC NE CA PA M PA M+ NE CA 0 5 1 0 1 5 r e la ti v e m R N A A 2 A * * * VC NE CA PA M PA M+ NE CA 0 2 4 6 8 r e la ti v e m R N A A 2 B * VC NE CA PA M PA M+ NE CA 0 .0 0 .5 1 .0 1 .5 2 .0 r e la ti v e m R N A A 3 VC NE CA cG AM P cG AM P+ NE CA 0 1 2 3 4 r e la ti v e m R N A A 2 A * * * VC NE CA cG AM P cG AM P+ NE CA 0 .0 0 .5 1 .0 1 .5 r e la ti v e m R N A A 2 B * * VC NE CA cG AM P cG AM P+ NE CA 0 1 2 3 4 5 r e la ti v e m R N A A 3 VC NE CA Cp G Cp G+ NE CA 0 1 2 3 r e la ti v e m R N A A 2 A * * VC NE CA Cp G Cp G+ NE CA 0 1 2 3 r e la ti v e m R N A A 2 B VC NE CA Cp G Cp G+ NE CA 0 .0 0 .5 1 .0 1 .5 2 .0 r e la ti v e m R N A A 3
A
B
C
D
Figure 4.1: Danger signals increase the expression of A2A and A2B receptors. ADA pretreated
BMDCs stimulated with LPS (A), Pam2CSK4 (B), cGAMP (C), and CpG ODN (D) for 3 hours (LPS: 300 ng/ml, Pam2CSK4: 10 ng/mL, cGAMP: 1g/ml, CpG: 3 M, NECA: 3 M). mRNA quantification is done with taqman probes. For statistical analysis, one-way ANOVA was used. * p<0,05, **p<0,01, ***p<0,001, ****p<0,0001. Results are from 2 or more independent experiments with similar results. (n=3)
4.2 Immunomodulatory Effects of Adenosine on BMDCs
After the investigation of the effect of danger signaling on adenosine receptor expression in BMDCs, we tested the effect of adenosine on cytokine secretion in BMDCs. We used TNF-alpha and IL-12p40 as immuno-modulatory and pro-inflammatory cytokines as readouts. We also tested IFN-beta, and IP-10 as an indication for activation of Type-I interferon pathway downstream of LPS, cGAMP and CpG signaling but not PAM signaling since TLR2 activation weakly stimulates type-I interferon production and TLR2-induced IP-10 expression does not rely on TRIF or IRF3 signaling [72]. IL-10 was tested to show the effect of adenosine receptor singling on generation of anti-inflammatory phenotype.
4.2.1 Effect of Adenosine on Pro-Inflammatory Cytokine Secretion
We observed a significant suppression by adenosine of both TNF-alpha and IL-12p40 secretion with the danger signals associated with MyD88. Interestingly, no significant modulation of these cytokines by adenosine is observed with cGAMP signaling, which primarily stimulates IRF3 signaling suggesting that adenosine receptor signaling may more strongly affect MyD88-dependent outcomes. (Figure 4.2).
VC NE CA LPS LP S+ NE CA 0 5 1 0 1 5 n g /m L T N F * * * * VC NE CA PA M PA M+ NE CA 0 5 0 0 1 0 0 0 1 5 0 0 p g /m L T N F * * * * VC NE CA cG AM P cG AM P+ NE CA 0 1 0 0 2 0 0 3 0 0 4 0 0 5 0 0 p g /m L T N F VC NE CA Cp G Cp G+ NE CA 0 1 0 0 0 2 0 0 0 3 0 0 0 p g /m L T N F * * * * VC NE CA LPS LP S+ NE CA 0 2 4 6 8 n g /m L I L 1 2 p 4 0 * * * VC NE CA PA M PA M+ NE CA 0 2 0 0 4 0 0 6 0 0 8 0 0 p g /m L I L 1 2 p 4 0 * * * * VC NE CA cG AM P cG AM P+ NE CA 0 5 0 1 0 0 1 5 0 2 0 0 p g /m L I L 1 2 p 4 0 A B C D VC NE CA Cp G Cp G+ NE CA 0 2 0 0 0 4 0 0 0 6 0 0 0 8 0 0 0 1 0 0 0 0 p g /m L I L 1 2 p 4 0 * * *
Figure 4.2: Adenosine receptor signaling decreases the secretion of pro-inflammatory cytokines in the presence of danger signals associated with MyD88 adaptor proteins. ADA pretreated
BMDCs stimulated with LPS (A), Pam2CSK4 (B), cGAMP (C), and CpG ODN (D) for overnight (LPS: 300 ng/ml, Pam2CSK4: 10 ng/mL, cGAMP: 1g/ml, CpG: 3 M, NECA: 3 M). Cytokine secretion is detected from media. For statistical analysis, one-way ANOVA was used. * p<0,05, **p<0,01, ***p<0,001, ****p<0,0001. Results are from 2 or more independent experiments with similar results. (n=3)
4.2.2 Effect of Adenosine on Type-I Interferon Cytokine Secretion
After pro-inflammatory cytokines, we next tested the modulation of Type-I interferon pathways using IFN-beta and IP-10 as a readout because secretion of these cytokines are mediated mostly by MyD88-independent fashion except for IP-10 downstream of TLR2 as indicated earlier. CpG DNA also use MyD88 as an adaptor but it can activate IRF7 signaling and downstream type I interferon responses as being an endosomal danger sensor [26]. Our results indicated that adenosine receptor signaling decreased IFN-beta and IP-10 secretion, but it was not as strong as that of pro-inflammatory cytokines (Figure 4.3A). TLR2 activation by PAM activates only the MyD88-dependent pathway on the cell surface of dendritic cells; therefore, fails activating type I interferon pathway [73]. Accordingly, Figure 4.3B shows no increase in IFN-beta secretion after TLR2 activation. However, TLR2 strongly increased IP-10 secretion and this was suppressed by adenosine receptor signaling. cGAMP increased both IFN-beta and IP-10 and this increase is not affected by adenosine receptor stimulation (Figure 4.3C). Similarly, CpG DNA increased both IFN-beta and IP-10 secretion and this was not influenced by adenosine receptor stimulation (Figure 4.3D). Overall these results suggest that the effect of adenosine receptor signaling on pathways causing type I interferon activation is not as prominent as that of pro-inflammatory cytokines.
VC NE CA LPS LP S+ NE CA 0 2 0 4 0 6 0 p g /m L IF N * * VC NE CA PA M PA M+ NE CA 0 2 0 4 0 6 0 p g /m L IF N VC NE CA cG AM P cG AM P+ NE CA 0 5 0 1 0 0 1 5 0 p g /m L IF N VC NE CA Cp G Cp G+ NE CA 0 5 1 0 1 5 p g /m L IF N VC NE CA LPS LP S+ NE CA 0 5 0 0 1 0 0 0 1 5 0 0 2 0 0 0 2 5 0 0 p g /m L I P 1 0 * VC NE CA PA M PA M+ NE CA 0 5 0 0 1 0 0 0 1 5 0 0 2 0 0 0 p g /m L I P 1 0 * * * VC NE CA cG AM P cG AM P+ NE CA 0 1 0 0 0 2 0 0 0 3 0 0 0 4 0 0 0 5 0 0 0 p g /m L I P 1 0 VC NE CA Cp G Cp G+ NE CA 0 2 0 0 4 0 0 6 0 0 p g /m L I P 1 0 A B C D
Figure 4.3: Adenosine receptor signaling decreases the secretion of Type-I Interferons in the presence of danger signals associated with MyD88 adaptor proteins. ADA pretreated BMDCs
stimulated with LPS (A), Pam2CSK4 (B), cGAMP (C), and CpG ODN (D) for overnight (LPS: 300 ng/ml, Pam2CSK4: 10 ng/mL, cGAMP: 1g/ml, CpG: 3 M, NECA: 3 M). Cytokine secretion is detected from media. For statistical analysis, one-way ANOVA was used. * p<0,05, **p<0,01, ***p<0,001, ****p<0,0001. Results are from 2 or more independent experiments with similar results. (n=3)
4.2.3 Effect of Adenosine on Anti-Inflammatory Cytokine Secretion
After testing the modulation of pro-inflammatory cytokines and Type-I interferons by adenosine, we next tested the effect adenosine signaling on secretion of anti-inflammatory cytokine IL-10. Addition of NECA with all MyD88-coupled danger signals significantly increased IL-10 secretion (Figure 4.4A, 4.4B, 4.4D). However, adenosine receptor signaling significantly decreased IL-10 secretion by cGAMP. This data again suggests that adenosine signaling polarize DCs into an anti-inflammatory phenotype when there is MyD88-coupled danger signals, whereas it may not have such an effect on IRF3 related pathways such as cGAMP signaling (Figure 4.4C).
![Figure 1.1: Toll like receptor localization and signaling pathways[17].](https://thumb-eu.123doks.com/thumbv2/9libnet/5550995.108158/16.892.207.682.698.1102/figure-toll-like-receptor-localization-signaling-pathways.webp)
![Figure 1.2: STING signaling cascade [30].](https://thumb-eu.123doks.com/thumbv2/9libnet/5550995.108158/18.892.115.840.475.1025/figure-sting-signaling-cascade.webp)
![Figure 1.3: Integrated innate and adaptive immune responses [53].](https://thumb-eu.123doks.com/thumbv2/9libnet/5550995.108158/22.892.106.790.102.598/figure-integrated-innate-and-adaptive-immune-responses.webp)
![Figure 1.4: Purinergic signaling and its components [56]](https://thumb-eu.123doks.com/thumbv2/9libnet/5550995.108158/23.892.108.790.145.544/figure-purinergic-signaling-components.webp)
![Figure 1.5: Adenosine receptor types related to different conditions [62].](https://thumb-eu.123doks.com/thumbv2/9libnet/5550995.108158/25.892.114.767.102.644/figure-adenosine-receptor-types-related-to-different-conditions.webp)