Evangelia Pippa
Dep. of Computer Engineering andInformatics University of Patras
Greece [email protected]
Evangelia I. Zacharaki
Dep. of Computer Engineering andInformatics University of Patras
Greece [email protected]
Ahmet Turan Özdemir
Dep. of Electrical and ElectronicsEngineering Erciyes University
Turkey [email protected]
Billur Barshan
Dep.of Electrical and ElectronicsEngineering Bilkent University
Turkey [email protected]
Vasileios Megalooikonomou
Dep. of Computer Engineering andInformatics University of Patras
Greece [email protected]
ABSTRACT
1The aim of this paper is to investigate feature extraction and fusion of information across a number of sensors in different spatial locations to classify temporal events. Although the common feature-level fusion allows capturing spatial dependencies across sensors, the significant increase of feature vector dimensionality does not allow learning the classification models using a small number of samples usually available in practice. In decision-level fusion on the other hand, sensor-specific classification models are trained and subsequently integrated to reach a combined decision. Recent work has shown that decision-level fusion with a global (common for all sensors) classification model, is more appropriate for generalized events that show a (weak or strong) manifestation across all sensors. Although we can hypothesize that the choice of scheme depends on the event type (generalized vs focal/local), the prior work does not provide enough evidence to guide on the choice of fusion scheme. Thus in this work we aim to compare the three data fusion schemes for classification of generalized and non-generalized events using two case scenarios: (i) classification of paroxysmal events based on EEG patterns and (ii) classification of falls and activities of daily living (ADLs) from multiple sensors. The results support our hypothesis that feature level fusion is more beneficial for the characterization of heterogeneous data (based on an adequate number of samples), while sensor-independent classifiers should be selected in the case of generalized manifestation patterns.
Permission to make digital or hard copies of all or part of this work for personal or classroom use is granted without fee provided that copies are not made or distributed for profit or commercial advantage and that copies bear this notice and the full citation on the first page. Copyrights for components of this work owned by others than ACM must be honored. Abstracting with credit is permitted. To copy otherwise, or republish, to post on servers or to redistribute to lists, requires prior specific permission and/or a fee. Request permissions from [email protected]. SETN '18, July 9–12, 2018, Patras, Greece © 2018 Association for Computing Machinery. ACM ISBN 978-1-4503-6433-1/18/07 $15.00
https://doi.org/10.1145/3200947.3201034
CCS CONCEPTS
• Computing methodologies → Supervised learning by classification; • Information systems → Retrieval models and ranking; Combination, fusion and federated search
KEYWORDS
Multi-dimensional time series, feature-level fusion, decision-level fusion, pattern analysis, classification
1 INTRODUCTION
Recent advances in data collection and data storage technologies have made it possible to collect large amounts of multi-dimensional time series data, which simultaneously evolve in time and are captured by different sensor units. A typical example of multi-dimensional time series is electroencephalography (EEG) which has been widely used for analyzing the cognitive activity of the brain and diagnosing potential mental and neurological health problems by classification of captured events [1]. Electrodes, which act as sensors detecting the electrical activity of the brain, are attached to the surface of the cerebral cortex and provide both spatial and temporal information. Multi-dimensional time series can also result from human motion monitoring applications where multiple sensor units including devices, such as accelerometers, gyroscopes and magnetometers, are placed to different body parts of the subject, such as the head, chest, wrist, etc., to acquire data useful for automated human motion identification or fall detection [2].
Events classification from such multi-dimensional data is an important machine learning problem with a wide variety of applications, such as seizure classification from EEG or fall detection from motion sensor data. There are two main approaches for fusing data from different sensor units/dimensions: feature-level fusion and decision-level fusion [3]. In feature-level fusion, which is commonly used to exploit the dependencies
across dimensions [4][5], data are fused directly after feature extraction. Feature vectors from each sensor unit/dimension are fused and events are classified by one global classifier. On the other hand, in decision-level fusion, events are classified for each sensor unit/dimension by its local (sensor dependent) classifier and the results from these local classifiers are later fused in the decision layer [3].
Analysis of multi-sensor data is very complex and difficult to summarize with a small number of variables extracted from multi-dimensional signals. Thus, analysis is usually accompanied by extraction of high-dimensional feature vectors. The dimensionality is further increased in feature-level fusion approaches aiming to exploit the information across sensor units/dimensions, where already high-dimensional feature vectors from several sensor units are combined into a single large feature vector. The problem of high dimensionality coupled with limited number of samples usually available in practice, makes the analysis of multi-dimensional signals a challenging task. In order to deal with this problem an alternative decision-level fusion scheme was proposed in [6], which combines information from all sensor units to train a single classification model and thus is sensor-independent. This decision-level fusion scheme keeps the dimensionality quite low, while the incorporation of a global training model allows the use of more training samples (by combining all sensor units).
Comparison of the three approaches in [6] showed superiority of the decision-level scheme with a global model for discrimination of paroxysmal episodes (generalized epileptic seizures [7], psychogenic non-epileptic seizures [8] and vasovagal syncopes [9]) from EEG recordings. However, such an observation cannot be generalized for any problem, since performance depends on the pattern of manifestation of the events across sensors, as well as the power of the data in respect to inference. Thus in this study, we aim to investigate the thee fusion approaches by relaxing the uniformity assumption of the temporal signals across channels. This is the case for example when the signals come from different modalities (e.g. accelerometer and ECG) or they come from the same modality but measure different quantities due to sensor placement in different spatial locations (e.g. accelerometer placed in wrist or head), or the event to be detected is local in a very small scale (e.g. multiple electrodes placed on the head to identify focal epilepsy). Αs a counter-example to previous work using generalized manifestation patterns of the same sensor type (i.e. EEG) [6], here we choose (as application data) heterogeneous multi-sensor recordings from different sensors, such as tri-axial accelerometer, gyroscope and magnetometer devices included in sensor units fitted to several body parts, and use them for classification of falls and activities of daily living.
The rest of this paper is organized as follows. In section 2, the different fusion schemes for the combination of information across dimensions (sensor units) are reviewed and the experimental setup is described. In addition, details are provided for the data pre-processing, feature extraction and classification steps for each of the two application problems. In section 3, the evaluation protocol is presented and the obtained results are
discussed. Finally, we conclude the paper with a short discussion on current limitations and future work.
2 EXPERIMENTAL AND COMPUTATIONAL
DETAILS
The presented methodology performs (i) short time analysis in the multi-dimensional time series data (each dimension corresponds to data acquired by one sensor unit), (ii) fusion based on different schemes, and (iii) binary classification using machine learning. The multi-dimensional time series data are initially pre-processed and frame blocked to extract frames of constant length w. Thus, each data sample is represented by a × matrix, where N is the number of sensor units.
After preprocessing, temporal and spectral analysis is performed for each frame resulting in a feature vector of fixed dimensionality for each of the N sensor units. During the training phase, a set of training data, manually annotated by a domain expert, is used to build a classification model. During the test phase, the newly acquired multi-dimensional data are preprocessed and parameterized with the same setup as in the training phase. Each produced feature vector is introduced into the trained classification model and a class label is assigned to each frame, indicating the type of event. The classification algorithms by the WEKA machine learning toolkit software [10] are used for training and testing.
2.1 Data fusion schemes
2.1.1 Feature-level fusion. In the feature-level fusion, data recorded from each one of the available sensor units from each frame are processed by a dedicated feature extraction algorithm. The estimated feature vectors from each sensor are concatenated into a single feature vector. Therefore, the training set is a data matrix × ( ⋅ ) , where M is the number of frames in the training set, N is the number of sensor units, and f the number of features extracted from each sensor unit. The feature-level scheme is illustrated in Fig. 1. Such a scheme leads to a feature vector of high dimensionality, imposing the need either for feature selection before classification [11] or data transformation in a lower dimensional space [12].
Figure 1: Feature-level fusion scheme.
2.1.2 Decision-level fusion with sensor-dependent (local) training models. In the decision-level fusion with local (sensor dependent) training models, a separate classification model is built for each sensor unit. Each one of the available sensor units is
Figure 2: Decision-level fusion scheme with sensor-dependent training models.
processed by the feature extraction algorithm and the estimated feature vectors are used to form N training sets, one for each sensor unit. The data matrix of each training set is × here. For each epoch, N decisions are made by each one of the N local classifiers. A final decision is reached by combining the N output class labels using a fusion rule, such as majority voting. The decision-level with local training models fusion scheme is illustrated in Fig. 2. In decision-level fusion the dimensionality of the feature vector is smaller than in feature-level fusion.
2.1.3 Decision-level fusion with a sensor-independent (global) training model. In the decision-level fusion scheme with global (sensor-independent) training model, a common classification model is used for the feature vectors extracted from the different sensor units [6]. The data matrix of the training set is now ( ⋅ ) × and is constructed by merging all training sets from each sensor. The decision-level fusion approach is based on the assumption that the variation across dimensions is small - thus a global (common for all sensors) training model can be used. In this scheme, the number of training samples is larger since each data frame appears in the training set N times, one time for each one of the available sensor units. During the test phase, for each frame N decisions are taken by introducing the signature from each sensor unit to the global classification model. A final decision is reached at a score level by combining the N output class labels using a fusion rule (e.g., majority voting) as before. The scheme is illustrated in Fig. 3. Although this scheme is less specific, it handles better the high dimensionality, by keeping the size of the feature vector N-times lower than in feature-level fusion. It also deals better with the problem of small number of training instances by repeating each frame from the different sensor units in the data matrix and treating all of them as independent training samples.
In the following, the two application studies are presented regarding seizure detection using EEG and fall detection based on multisensor recordings.
2.3 EEG dataset and analysis framework
The EEG data used in this study include epileptic and non-epileptic events extracted from multi-parametric recordings of 11 patients as part of the ARMOR project [13][14]. The recordings were acquired in the Department of Clinical Neurophysiology and
Figure 3: Decision-level fusion scheme with a sensor-independent training model.
Epilepsies in St. Thomas’ Hospital in London. The epileptic group consisted of patients with known diagnosis of idiopathic generalized epilepsy, manifested clinically with generalized spike wave discharges (GSW) on the EEG. The non-epileptic group included patients that had sustained a vasovagal syncope (VVS) (two participants) or a psychogenic non-epileptic attack (PNES) (five participants). The selected EEG channels were Fp2, F8, F4, T4, C4, A2, P4, T6, O2, Fp1, F7, F3, A1, C3, T3, P3, T5, O1, Fz, Cz, Pz. Neurological experts of the King College London manually annotated the recordings. Only epochs (frames) during the seizure duration were considered for training and for testing. The number of epochs that were extracted for all subjects during the recorded episodes is = 205 (123 GSW, 19 PNES, 63 VVS).
The EEG signal from each channel was pre-processed and parameterized as in [4][6]. In particular, pre-processing consisted of notch filtering, baseline correction, re-sampling (in order to obtain a common resolution level for all data) and frame blocking of the incoming EEG streams to frames of constant length with constant time-shift and without time-overlap between successive frames. After pre-processing, time and frequency-domain features were extracted from each frame for each one of the electrodes. The extracted feature vector had a dimensionality equal to 55 for each of the N=21 EEG channels. In our previous work [4], the ability of the above features to discriminate between epileptic and non-epileptic frames was evaluated by the examination of several classification algorithms implemented by the WEKA machine learning toolkit [11]. Since the overall highest accuracy was achieved by BayesNet classifier, we evaluated the previously described fusion schemes with respect to BayesNet classification [15]. The epileptic group is considered as the positive class and the non-epileptic group (PNES or VVS) as the negative class.
2.4
Falls dataset and analysis framework
With Erciyes University Ethics Committee approval, seven male and seven female healthy volunteers participated in the study. Six wireless sensor units were tightly fitted with special straps to the subjects’ head, chest, waist, right wrist, right thigh, and right ankle. Each unit comprises three tri-axial devices (accelerometer, gyroscope, and magnetometer/compass) with respective ranges of ±120 m/s2, ±1200◦/s, and ±1.5 Gauss. Raw motion data were recorded with a sampling frequency of 25 Hz. Acceleration, rate
of turn, and the strength of the Earth’s magnetic field along three perpendicular axes ( , , ) were recorded for each unit. A set of trials consists of 20 fall actions and 16 ADLs adopted from the work in [16] and lasted about 15 s on the average. The 14 volunteers repeated each set five times. Thus, a considerably
diverse dataset comprising 1400 falls
( 20 × 14 × 5 ) and 1120 ADLs
(16 × 14 × 5 ) was acquired, resulting in 2520 trials.
The time series data from each sensor unit were pre-processed and parameterized as in [2]. Initially, the total acceleration of the waist accelerometer was calculated as
= + + (1)
where , , are the accelerations along the , and axes, respectively. The time index corresponding to the peak value of the waist accelerometer in each record was identified. Then, two-second intervals (50 samples) before and after this point, corresponding to a time frame of 101 samples were extracted. The rest of the recording was not used. Thus each row of data is represented by a w-dimensional vector, where = 101. Data from the remaining axes of each sensor unit were also processed in the same way, considering the time index obtained from the waist sensor as reference, therefore resulting in six 9 ⋅ 101 measurements.
Extracted features consist of the minimum, maximum, and mean values, as well as skewness, kurtosis, the first 11 values of the autocorrelation sequence, and the first five peaks of the discrete Fourier transform of the signal with the corresponding frequencies, resulting in 26 features for each one of the nine axes of the sensor unit. Thus, the signal of each sensor unit is represented by a single feature vector of dimensionality = 9 ⋅ 26 = 234. The discriminative power of the above features in respect to fall detection was evaluated in [2]. Since Support Vector Machines achieved a very high accuracy there, we examine the SMO classification algorithm [17][18] with respect to each fusion scheme. We consider the falls as the positive class and the ADLs as the negative class.
3 RESULTS AND DISCUSSION
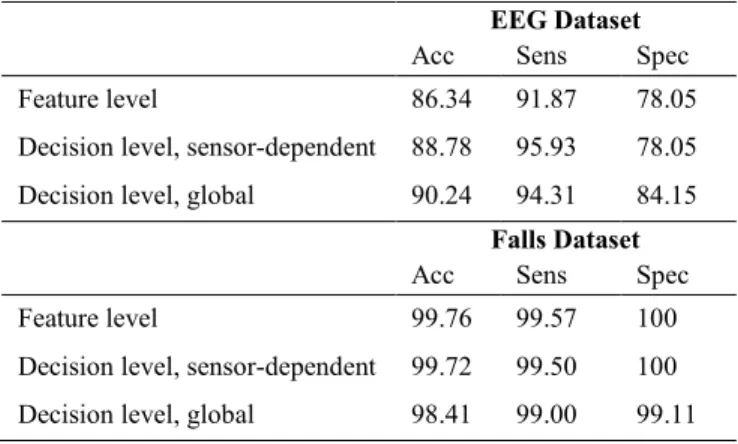
Evaluation is performed in a leave-one-subject-out cross-validation setting, that is each time one subject was left-out for testing, while the rest of the subjects were used for training. Table 1 shows the classification performance in terms of average accuracy, sensitivity (fraction of positive events correctly identified), and specificity (fraction of negative events correctly identified). As can be seen, the overall highest accuracy for classification between epileptic and non-epileptic EEG events is 90.24% for decision-level fusion with a global training model. The decision-level with sensor-dependent models and feature-level schemes follow with 88.78% and 86.34% accuracy, respectively. It seems that the high dimensionality of the training
samples at the feature-level fusion
(55 ⋅ 21 ℎ = 1155 ) is not appropriate for
Table 1: Classification Performance in respect to accuracy (acc), sensitivity (sens) and specificity (spec)
EEG Dataset
Acc Sens Spec
Feature level 86.34 91.87 78.05
Decision level, sensor-dependent 88.78 95.93 78.05 Decision level, global 90.24 94.31 84.15
Falls Dataset
Acc Sens Spec
Feature level 99.76 99.57 100
Decision level, sensor-dependent 99.72 99.50 100 Decision level, global 98.41 99.00 99.11 this rather small dataset ( = 205), while decision-level fusion with a global model (smaller dimensionality, more training samples), increases generalization ability.
On the other hand, for the falls dataset, all schemes present comparable results with feature level fusion showing the best performance for all criteria. Such a result was expected since the sensors in the falls dataset capture very diverse information (in contrast to the EEG dataset where all sensors are EEG electrodes), thus the data cannot be sufficiently represented by a single global model.
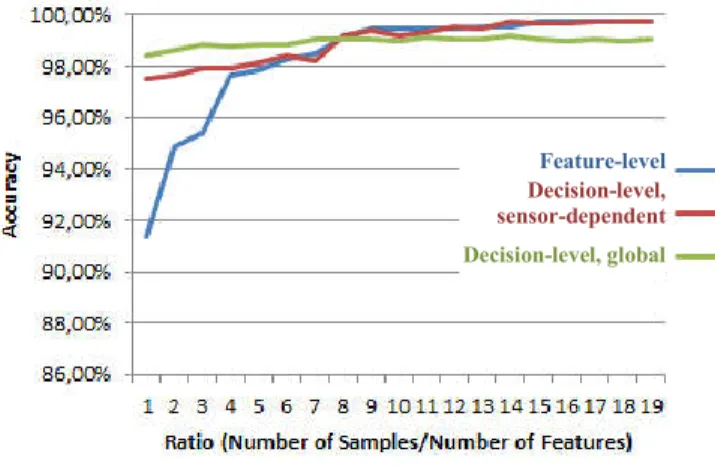
It is also worth noting that in the falls dataset, the number of training samples is = 2340 ( = 13 × 5 × 36 ), namely 10 times the number of features ( = 234). In order to provide some better insights, we examined the classification performance of each fusion scheme by changing the ratio of the number of training samples over the number of features
= / (2)
This ratio was changed by pruning training samples. We used the largest dataset (falls dataset) for this purpose and illustrate the obtained results in Fig. 4. As can be seen, both decision-level fusion schemes perform better when training samples are less than four times the feature vector dimensionality. Such results support our hypothesis for the superiority of decision-level fusion scheme with global models in small datasets with limited number of training samples.
4 CONCLUSIONS
In this paper, we investigated the problem of event classification from multi-dimensional time series data using temporal and spectral analysis for feature extraction and three fusion schemes for the combination of information across sensors. The methodologies were evaluated in the case of paroxysmal events’ classification from EEG recordings and fall detection based on tri-axial accelerometer, gyroscope, and magnetometer data. Although the presented work does not constitute a general strategy, the results shed some light on the selection of fusion strategies supporting our hypothesis that the decision-level fusion with
Figure 4: Classification accuracy as a function of in Eq. (2). global training is more beneficial for generalized events with small number of samples, while feature level fusion is more suitable when the number of samples is larger or the data are heterogeneous. Future work is required to investigate other confounding factors, such as intrinsic data variability and feature redundancy, as well as differences in the extracted features and implemented classifiers. Moreover, the investigation of cross-correlation across sensors as an indicator of the type of patterns (generalized versus local) will provide some initial diagnostics and further guidance in the selection of fusion scheme.
ACKNOWLEDGMENTS
The authors would like to thank Dr. Michael Koutroumanidis and Dr. Mark P. Richardson from the Department of Clinical Neurophysiology and Epilepsies, Guy's & St. Thomas' and Evelina Hospital for Children, NHS Foundation Trust/King's College, London, for sharing the EEG data and useful discussions. This work was supported by the FrailSafe project funded from the European Union’s Horizon 2020 research and innovation programme under grant agreement No 690140. The paper reflects only the view of the authors and the Commission is not responsible for any use that may be made of the information it contains.
REFERENCES
[1] G E. Niedermeyer and F. L Silva. 2005. Electroencephalography:
basic principles, clinical applications, and related fields. Lippincott
Williams and Wilkins.
[2] A.T. Özdemir and B. Barshan. 2014. Detecting falls with wearable sensors using machine learning techniques. Sensors 14, (2014) 10691–10708.
[3] A.H. Gunatilaka, B.A. Baertlein. 2001. Feature-level and
decision-level fusion of noncoincidently sampled sensors for land mine detection. IEEE Transactions on Pattern Analysis and Machine
Intelligence 23, 6 (2001), 577–589.
[4] E. Pippa, E.I. Zacharaki, I. Mporas, V. Tsirka, M. Richardson, M. Koutroumanidis, and V. Megalooikonomou. 2014. Classification of epileptic and non-epileptic EEG events. In 4th International
Conference on Wireless Mobile Communication and Healthcare.
[5] A. Shoeb and J. Guttag. 2010. Application of machine learning to epileptic seizure onset detection. In 27th International Conference on Machine Learning.
[6] E. Pippa, E.I. Zacharaki, M. Koutroumanidis, V. Megalooikonomou. 2017. Data fusion for paroxysmal events' classification from EEG.
Journal of Neuroscience Methods, 275 (2017), 55–65.
[7] R.S. Fisher, W.V.E. Boas, W. Blume, C. Elger, P. Genton, P. Lee, J. Engel. 2005. Epileptic seizures and epilepsy: definitions proposed by the International League Against Epilepsy (ILAE) and the International Bureau for Epilepsy (IBE). Epilepsia, 46 (2005), 470– 472.
[8] L. Szabo. 2013. Semiologic analysis and classification of childhood psychogenic non-epileptic seizures based on video-EEG monitoring data. PhD thesis.
[9] T. Lewis. 1932. Vasovagal syncope and the carotid sinus mechanism.
J. Brit. Med. 1 (1932), 873–876.
[10] M. Hall, E. Frank, G. Holmes, B. Pfahringer, P. Reutemann, and I. H. Witten. 2009. The WEKA Data Mining Software: An Update.
SIGKDD Explorations 11 (2009).
[11] E. Pippa, E.I., Zacharaki, I. Mporas, V. Tsirka, M. Richardson, M. Koutroumanidis, and V. Megalooikonomou. 2015. Improving classification of epileptic and non-epileptic EEG events by feature selection. Neurocomputing, 71 (2015) 576–585.
[12] E. Pippa, V.G. Kanas, E.I. Zacharaki, V. Tsirka, M. Koutroumanidis, V. Megalooikonomou. 2016. EEG-based classification of epileptic and non-epileptic events using multi-array decomposition.
International Journal of Monitoring and Surveillance Technologies Research (IJMSTR) 4, 2 2016), 1–14.
[13] ARMOR project, http://www.armor-project.eu/
[14] I. Mporas, V. Tsirka, E.I. Zacharaki, M. Koutroumanidis, M. Richardson, V. Megalooikonomou. 2015. Seizure Detection using EEG and ECG Signals for computer-based monitoring, analysis and management of epileptic patients. Expert systems with applications 40 (2015), 3227–3222.
[15] G.F. Cooper and E. Herskovits. 1992. A Bayesian method for the induction of probabilistic networks from data. Machine Learning 9 (1992), 309–347.
[16] S. Abbate, M. Avvenuti, P. Corsini, A. Vecchio, and J. Light. 2010. Monitoring of human movements for fall detection and activities recognition in elderly care using wireless sensor network: a survey.
Application-Centric Design Book, Rijeka, Croatia.
[17] S.S. Keerthi, S.K. Shevade, C. Bhattacharyya, and K.R.K. Murthy. 2001. Improvements to Platt's SMO algorithm for SVM classifier design. Neural Computation 13 (2001), 637–649.
[18] J. Platt. 1998. Fast Training of Support Vector Machines using
Sequential Minimal Optimization. Advances in Kernel Methods -
Support Vector Learning. Feature-level
Decision-level, sensor-dependent Decision-level, global