' ν · ^ ' ■ ^ ' ί ϊ ' ί “ ' ' ' ^ ^ ' ι ' ' ^ /"^' ■ ■'■ ■ . Л - ' Ѵ ' " ', "' ' • " ν ■ ” . ** · " ■'·'■* ■ ѵ : . φ · / ^ · 3 μ' ■!?■ ■Г ; ; : , . Η . · , 3»·ί· : ^ - ν < ' .-■; - г-‘ / ' : ' ^ : '■■,. у . Г Ч ·*' * ν ^ - - : Ѵ ѵ - --- χ . ·■ l r > «г» · 1 . J ' ■; « , ν / " · ■ τ·,~- ; > . : ?.. ' * Λ * 9 « ’·« W '-'« · ί · * ϊ ' W " ■ î >■"■■'f ' á ' ■'■·'. ■^ Ρ · . · * » > * ’ « » . ..“ . - » V д ' · ■> '■ "·,·■■
ѵ Т ѵ К с .
4 ^ ν ^ ' « '': J r O ;
у . . V - r í . · . ' ѵ : } . : .· j \ . · .1 Г. сИ i 4 ' i l С:
? , /Ε Ό · '_
ϊΪ'Γ ν ’
• , ^ ц, i ■ _ і " ; Г | . . , 5 ? ■Г>7;!:лѵ-· V ' / / &S
8
S I
V
5
S
IMPACT OF EXCHANGE RATE FLUCTUATIONS AND POLITICAL RISK ON THE RISK PREMIUMS REFLECTED IN THE CROSS-SECTIONS OF
INDIVIDUAL EQUITY RETURNS
A THESIS
Submitted to the Department o f Management and the Graduate School o f Business Administration
o f Bilkent University
in Partial Fulfillment o f the Requirements For the Degree o f
Master o f Business Administration
By Özer Yılmaz
HG
325Ί
• 1 5 7І З 'Я
I certify that I have read this thesis and that in my opinion it is fully adequate, in scope and quality, as a thesis for the degree o f Master o f Business Administration.
Assist. P ro f Gülnur MURADOGLU
I certify that I have read this thesis and that in my opinion it is fully adequate, in scope and quality, as a thesis for the degree o f Master o f Business Administration.
Assist. Prof. Kür§at AYDOÖAN
I certify that I have read this thesis and that in my opinion it is fully adequate, in scope and quality, as a thesis for the degree o f Master o f Business Administration.
Assist. P ro f Ayşe YÜCE
Approved jb r the Graduate School o f Business Administration.
ABSTRACT
The impact o f exchange rate fluctuations and political risk on the risk premiums o f individual equity returns trading in Istanbul Stock Exchange will be analyzed empirically. Turkey as an emerging market faced considerable monetary and political turbulence in the past decade. Variables from the currency and sovereign debt markets will be the proxies for exchange rate risk and political risks, respectively. Evidence o f the risk premiums as a result o f the exposure to the equity markets show valuable inferences although statistically significant conclusions are not the majority.
These results have many implications for the corporate and portfolio management. This study also provides tools and data that can be utilized by the emerging market researchers.
Key Words: Exchange rate risk, political risk, Istanbul Stock Exchange, emerging markets.
ÖZET
Kur riski ve politik risk etkisiyle İstanbul Menkul Kıymetler Borsası’nda işlem gören hisse senetlerinin taşıdıkları risk primi ampirik olarak analiz edilmektedir. Geçen on yılda gelişen bir piyasa olarak Türkiye, önemli parasal ve siyasal çalkantılarla karşı karşıya kalmıştır. Kur riski ve politik risk için sırasıyla, kurlar ve bono ve tahvil piyasasından değişkenler bu çalışmada yer alacaklar. Türkiye’de hisse senedi piyasasına girerek risk primi ile karşı karşıya kalanlar için istatistiksel olarak kanıt gösterilebilecek değerde sonuçlar çoğunluğu oluşturmasa da, bu çalışma bazı değerli yargılara varmamıza yardımcı olmaktadır.
Bu çalışmanın sonuçlarının kurum ve portföy yönetimi açısından pek çok etkileri vardır. Aynı zamanda bu çalışma gelişen piyasalarda araştırma yapanlar tarafından kullanılabilecek araçlar ve veriler de ortaya koymaktadır.
Anahtar kelimeler; Kur riski, politik risk, İstanbul Menkul Kıymetler Borsası, gelişen piyasalar.
To my Grandmother
and Grandfather...
TABLE OF CONTENTS
ABSTRACT... 1
ÖZET... il
ACKNOW LEDGMENTS...iiiCHAPTER 1. INTRODUCTION... 1
CHAPTER 2. LITERATURE REVIEW ...4
CHAPTERS. M ETHODOLOGY...8
TEST PROCEDURE... 8
D A T A S E T ... 11
Stock Prices... 11
Economic Risk Factors... 13
Lagged Information Variables... 15
CHAPTER 4. FINDINGS... 17
Summary Statistics... 17
The Behavior o f Monthly Stock Returns... 21
Industry Portfolio Return Behavior...25
CHAPTER 5. CONCLUSION AND RECOM M ENDATIONS... 29
REFERENCES... 32
LIST OF TABLES
1. Table - l .a 2, Table - l.b 3. Table - l.c 4. Table - 2.a 5. Table - 2.b 6. Table - 2.C 7. Table - 3.a 8. T a b le -3 .b 9. Table - 3.C 10. Table - 4.a 11. Table - 4.b according to IS E ... Appendix A Returns... 23 Cross-sectional Distribution o f Coefficients from Regressions o fMonthly Stock Returns on Unanticipated Changes in Risk factors ... 24 Cross-sectional Distribution o f Coefficients from Forecasting
Regressions o f Monthly Stock Returns on Lagged Information
LIST OF FIGURES
1. Figure - 1 Monthly Forward Premium and Rate o f Change o f Official TL/$
Exchange Rate... Appendix C 2. Figure - 2 Monthly Free Market Dollar Premium Expressed as a Fraction o f the
Official TL/$ Rate... Appendix C 3. Figure - 3 Monthly Turkish Stock M arket Index...Appendix C
CHAPTER 1
INTRODUCTION
The effects o f exchange rate fluctuations and the winds blowing in the political environment are substantial in leading our investment decisions. All the financial agents, including the naive investor to the multi-national conglomerates, are exposed to volatile exchange rates and risky political environment. The yield premium o f the investment as a consequence o f such factors is the deciding point o f concern.
The exporting companies are favorably affected by the depreciation in the real value o f the domestic currency assuming the unavailability o f costless hedging mechanisms. Similarly, importing companies are adversely affected by the depreciation in the real value o f the domestic currency given the exchange rates and the price levels are
significantly volatile and costless hedging instruments are nonexistent. Thus, exchange rate risk directly relates to the value o f the company since it has an impact on the cash flows.
Even if the company is not operating cross-borders currency risk has an indirect impact on the company because foreign competitors are negatively or positively affected by this economic factor. Other factors that may support the existence o f an ex ante risk premium are the input costs or the aggregate demand that the company faces as a consequence o f the floating exchange rate.
Similarly, political risk premium reflected in companies’ share prices may be an outcome o f the debt financing structure. It can also be correlated with suppliers and/or customers whether they are foreign or domestic. Also, the dependence on international transactions, or the exposure to material changes in the laws and regulations related to currency controls or capital flow barriers are delegates for the significance o f the political risk premium reflected on the share prices o f companies.
Economic reforms deregulating sensitive industries and breaking the free ride o f monopolies and other privileges are worth searching for proxy o f political risk premium. Even democratization which eliminates close ties to military circles will have major influence from this point o f view.
As a consequence o f the above assertions, it is worth testing the existence o f ex ante equity yield risk premium to factors like currency fluctuations and political events.
A study on the search for impact o f exchange rate fluctuations and political risk that are reflected in individual equity returns o f Turkish companies listed with the Istanbul Stock Exchange (ISE), while Turkey is still experiencing considerable monetary and political turbulence, seemed a challenging and rewarding project.
The purpose o f this empirical study is to test the extent o f the exposure o f stock prices o f individual companies from the same country to exchange rate fluctuations and political risk.
In other words, the possible existence o f risk premiums in stock prices will be questioned. The input impulses will be the currency fluctuations and political risk. The ex ante yield risk premium that is searched for in the cross-sections o f share prices because o f the currency volatility and changes in the political environment may lead us to interesting findings.
The results o f the similar papers o f this kind both for emerging markets and developed countries suggested some common implications as referred in Bailey and Chung (1994). It is aimed with this study that the evidence o f such implications, if any, will help to structure our corporate and portfolio management practices and contribute as another emerging market example to the literature.
The data set uses currency market prices o f Central Bank o f Turkey and Treasury bill prices o f Turkish Treasury to proxy for the changes in currency and political risks, respectively, and following a procedure similar to Bailey and Chung (1994) is used for equity markets to measure expected risk premiums in Turkey. It is worth mentioning that currency and debt markets provide useful information for an in depth understanding o f the stock market.
This study is organized as follows; Chapter 2 reviews the literature. Chapter 3 describes the empirical methodology and the data set. The results and findings are in Chapter 4, and Chapter 5 offers some concluding remarks.
CHAPTER 2
LITERATURE REVIEW
There are research findings on national stock index returns converted into a common currency evidencing premium for exchange rate fluctuations, e.g. Brown and Otsuki (1993) and Person and Harvey (1993). However, research done on cross-sections o f stock returns from the same country received relatively less attention for the priced portion o f similar risks.
Bailey and Chung (1994) state that if the effects o f currency and political risks do not vanish in well-diversified portfolios, exposure to these factors should yield risk premiums in an asset market in equilibrium.
In the scope o f the literature, it is reported by Jorion (1990,1991) that some U.S. equity values react to fluctuations in the trade-weighted value o f the dollar. On the other hand, it is also observed that exposure to exchange rate does not envisage an ex ante risk premium in the U.S. stock market as again concluded by Jorion (1990,1991).
Besides, relating to studies about nonlinear dependencies in price changes. Press (1968) and Clark (1973) report evidence that the unconditional variances are nonstationary. Neftçi (1984) concludes that there are no theoretical reasons for assuming either the linearity or the independence o f price changes.
The comovement o f world stock indices are examined and no significant lead and lags among developed stock exchanges are found by Agmon (1974), Granger and Morgenstein (1970). Hilliard (1979) examines the structure o f international equity market indexes during the OPEC embargo. He finds no common worldwide financial market factor. Most intracontinental prices move simultaneously. M ost intercontinental prices are not closely related. His results o f low correlations among international
markets support the previous studies.
And according to Yüce (1996) Istanbul Stock Exchange is dominated by 3 or 4 big family owned corporations and state owned companies. Their influence on the index is so pervasive that it is open to question whether Turkish investors can diversify effectively by forming portfolios o f 15-20 stocks or even 30 stocks. However, Yüce (1996)
concludes that diversification is possible against the presence o f the public companies o f the same conglomerate.
Alexakis and Petrakis (1991) analyze the behavior o f returns on Greek stocks. They hypothesize that the components which affect a small capital market are more related to the existence o f alternative investment opportunities and to social and political
conditions, and less to economic activity and the economic profits o f companies. In politically and economically unstable countries, returns on real estate and gold
investments are generally higher compared to returns on stocks. Their results indicate that the alternative investment opportunities, together with socio-political factors, affect the evolution o f the share price index. Foreign competition seems to have by far the greatest explanatory power followed by the socio-political factor and the domestic investment opportunities. These factors outweigh economic activity and companies’ profits.
Bailey and Chung (1994) claims it is reasonable to suppose that we can learn something about the effects o f these risks from non-U. S. markets where the impact o f currency fluctuations and political risk may be different.
Person and Harvey (1991) suggest that very little o f the variation in U.S. stock returns can be explained by variation in the risk exposures o f those returns. The recent studies o f Akgiray (1989) and Hsieh (1991) about U.S. stock prices all find nonlinear dependence in the series. However, Bailey and Chung (1994) finds it reasonable to imagine that risk exposures may be less stable in developing economies which have grown, evolved, opened to the global economy very rapidly.
Risk is defined as the uncertainty associated with the end-of-period value o f an investment in an asset or portfolio o f assets by Sharpe and Alexander (1990) and
consequently risk exposure is holding a position in an investment carrying the mentioned uncertainty.
The purpose o f this study will be to search for the ex ante risk premium as a result o f the exchange rate fluctuations and political risks in the equities trading in the Istanbul Stock Exchange.
Exchange rate risk can be defined as the risk taken by being exposed to changes in the currency fluctuations by underlying effects, such as the consequences o f importing and exporting relations with domestic or foreign customers or suppliers.
Political risk may be defined as the risk faced as a consequence o f exposure to
currency controls, capital flow barriers, governing laws and regulations by the governing body.
Focus o f this study will be on the cross-sections o f individual equity returns in Turkey and the risk premium from the same market. The same approach will also be applied with the same hypotheses on an industry basis.
Two groups o f variables to proxy for exchange rate risk and political risk will be used. First group consists o f economic risk factor variables. Second group consists o f lagged information variables. Each group has three variables and each variable has a corresponding related variable from the other group. So, the two group o f variables are not disjoint.
The concluding remarks will focus on the effects o f the findings to the corporate portfolio manager and the individual investor exposed to such risks.
CHAPTER 3
METHODOLOGY
TEST PROCEDURE
The empirical approach that is based on observation, adopted from Bailey and Chung (1994), is both simple and powerful since it uses currency market and debt market prices as proxies for changes in exchange rate and political risks to measure expected risk premium.
It is assumed that the expected return on a risky asset is determined by its exposure to systematic economic forces and by the effective expected risk premiums for exposure to those forces;
(
1
)E { n .
(n<)) = Ao(Q,) +
P
j
,i ■ Xjip.)
where,
t: is the time and t+1 is the next observation time (here the period interval is 1 month)
t, t+1: is the return for the variable subscripted H t ; is the information available at time t
ri,t.t n : is the nominal return on the ith asset in excess o f the yield on a nominally riskless security
Pj,i: is the sensitivity o f the ith asset to the jth risk factor
X j : is the expected risk premium for exposure to the jth risk factor.
Factors which proxy for exchange rate risk and political risk we are interested in will be specified as variables to this empirical study. The dependence o f expected risk
premiums on the current information set, permits equity risk premiums to vary
through time.
The query looked for is: to what extent do cross-sectional differences in exposures to exchange rate and political risk measures yield significant differences in stock returns. Time series regressions are used to measure risk exposures o f individual security excess returns on contemporary (synchronized) changes in economic risk factors first:
(2a)
+ 1 = j S o , i + ^ + I + £ i , t , t + \
where,
t: is the time and t+1 is the next observation time (here the period interval is 1 month)
t, t+ 1: is the change for the variable subscripted
ri,t,t+i ; is the nominal return on the ith asset in excess o f the yield on a nominally riskless security
Pj,i: is the sensitivity o f the ith asset to the jth risk factor
Then, the return series are regressed with lagged information variables, Zt instead o f Xt. Again, time series regressions are used to measure risk exposures o f individual security excess returns on changes in lagged information variables:
(2b)
f ' i , t , t + 1 = p a . I + _ ^ ^ p i , f Z j , t + S t . t , t + 1
where,
t: is the time and t+1 is the next observation time (here the period interval is 1 month)
t, t+1: is the change for the variable subscripted
ri,t,t . 1 ; is the nominal return on the ith asset in excess o f the yield on a nominally riskless security
p j.i: is the sensitivity o f the ith asset to the jth risk factor
Zj,t: represents the unexpected change in the jth lagged information variable
The lagged information variables, Zt, will explicitly be defined in the data set section. The results suggest whether the exchange rate and political risk factors selected are significant. They provide coefficients to be used in the following tests.
The regression part is repeated once more for the equally weighted industry
portfolios rather than the individual stock returns both with the economic risk factors and the lagged information variables. The aim here is to interpret the findings on an industry basis and eliminating the potential problems leading to deviations like missing
observations for individual stocks and noise in individual stock returns.
DATA SET
The sample period spans from January 1990 to October 1994. Monthly data for the following variables are extracted as o f the last working day or the last available data o f the respective month where applicable and except where noted. A total o f 58
observations for each o f the variables are included in this study.
Table 1-a in Appendix A, lists the 43 stock price sample with summarized
characteristics; the tick mark indicates that specific stock is calculated and 33 o f them has weight in the ISE com\)osite index. Most o f the stocks have full set o f observation data o f 58. Table 1-b presents the stock price sample grouped by industries. The stock price sample is formed from 10 different industries formed as consequence o f the stock selection process.
Table 1-c in Appendix A lists the real return series o f all the stocks used in this study.
Stock Prices
Monthly stock prices with a precision o f 1 Turkish Lira (TL) are obtained from Bilkent University Faculty o f Business Administration database as softcopy. The monthly prices were adjusted for splits dividends and rights offerings. If the individual stock did not trade on the last day o f the month it is recorded as a missing observation for that stock following the tests o f Bailey and Chung (1994).
Selected number o f equities are 43 for the sample period spanned o f which 33 are used in the weighted average composite index calculation o f ISE. N one o f the equities are trading in the regional market, where all are trading within the national market. Number o f missing observations was the deciding factor o f the selection process. Stocks with more than 4 missing observations are not included which resulted a stock data set consisting o f 43 equities. 11 o f the equities have 1 and 1 o f the equity has 4 missing observations where the remaining 32 stocks have full number o f observations during the sample period covering 58 months. So, the stock with minimum number o f observations has 54 observations. Arithmetic a verage o f the one-month preceding and one month following observations are interpolated to be able to calculate the monthly return series and to complete the regressions.
Real returns o f stock prices are expressed with nominal stock returns in excess o f the yield on a one-month treasury bill (if there is no one month T-bill auction for that month, monthly compounded return for the three months T-bill rates are used).
(
3)
p i , t + 1 - p i , i n . t + 1 = --- + 1
p i . t
where,
t; is the time and t+1 is the next observation time t, t+ 1: is the percent change for the variable subscripted Pi,i: is the price o f the ith stock at time t
is the monthly yield o f the Turkish treasury T-bill
ri,t+i : is the excess return on the ith asset in excess o f the yield on a nominally riskless security
Economic Risk Factors
Three economic risk factors are specified to represent the general economic trends, currency fluctuations, and political risk. They proxy for the economic shocks, Xt, defined in equation 2a.
The first variable in xj is, RFX, official foreign exchange return, that represents the monthly percent change in the official TL per U.S. dollar foreign exchange rate.
The expression for RPX is:
(
4)
OfficialTL / %Ratet -v i - OfficialTL / %Raiet
OfficialTL / %Ratet
where. Official TL/$ Rate is the official exchange rate announced by the Central Bank o f Turkey.
The second economic risk factor variable, DFXPREM is the monthly change in the free market premium for dollars. The free market premium equals the spread between free and official exchange rates divided by the official exchange rate.
(
5)
FreeTL / %Ratet
+ 1- OffidalTL / %Mtet
+ 1Free 11, / %Raiet - OfficialTL / %Raiet
DFXI^RFM^\=-
CfficialTL! %Ratet
v + i Official'n^/ %RaletFreeTL ! %Ratet - CfflîcialIL/%Ratei
OfficiallLISRatet
where. Free TL/$ Rate is the free market exchange rate as printed in Hürriyet
newspaper and Official TL/$ Rate is the official exchange rate announced by the Central Bank o f Turkey.
The official rate governs exports, most imports and debt service. The free rate applies to tourism receipts, foreign travel by Turkish citizens abroad, and other imports. The premium for dollars in the free market resides the likelihood o f increased capital controls, the pressure o f flight capital given political and economic uncertainty, and expectations about forthcoming currency devaluation.
Thus, changes in the dollar premium reflect changes in a combination o f legal, political, and currency factors. As a consequence, the dollar premium increases as the risk o f capital controls, political turbulence, or devaluation increase.
The third economic risk factor variable, RMKT, real market return, is the monthly log-change in the ISE composite index in excess o f the yield on a one-month treasury bill o f Turkish Government. ISE composite index is the capitalization-weighted average o f prices o f exactly 100 most liquid equities, also known as the ISE 100.
RMKT is expressed as; (
6
) R M K 'l\.\ = \n ISEindext+ 1 - ISEindext ISEindext ‘1 0 0- onemonlhTbillyieldi.t + Iwhere, ISE index are the Istanbul Stock Exchange composite index and one month T-bill yield is the Turkish treasury one month T-bill yield.
Lagged Information Variables
The lagged information variables can be interpreted as a subset o f the elements o f the information set, Ht in Equation 1 or as proxies for the expected risk premiums, zj as expressed in Equation 2b. These variables are used to impose the significance o f time- varying equity market risk premiums. These will also be used to derive the presence o f currency and political risk premiums common to the stock, and currency markets. One lagged information variable, zt is selected for each o f the three economic risk factors, Xi. FORWARD, the yield spread between one-month Turkish and U.S. own-currency Treasury bills is the lagged exchange rate information variable. As the name given to the information variable implies, the yield spread is an indicator o f the expected inflation differential.
(
7)
FORWARDt = Im Turkish treasury T-bill ratei - Im US treasury T-bill ratet
It also equals the forward premium for dollars and can be thought o f as the sum o f the expected future exchange rate and risk premium. To the extent that the Central bank o f Turkey uses interest rates to manage the exchange rate, FORWARD is also positively correlated with efforts to control the depreciation o f the TL.
FXPREM is the corresponding lagged information variable o f the economic risk variable DFXPREM, monthly percent change in the free market premium for dollars. FXPREM is the premium for U.S. dollars at the free market rate, defined as the difibrence between the free market TL per dollars rate and official TL per dollars rate.
FXPREMi = Free TL/$ Ratet - Official TL/$ Ratet
Similarly, FXPREM is high when currency and political risks are high.
Finally, the lagged equity market information variable DIVYIELD is the average annualized dividend yield data from ISE and is an outcome o f the calculations based on the stocks trading on national market and the regional market published periodically in the monthly bulletin o f ISE.
( 8 )
CHAPTER 4
FINDINGS
Summary Statistics
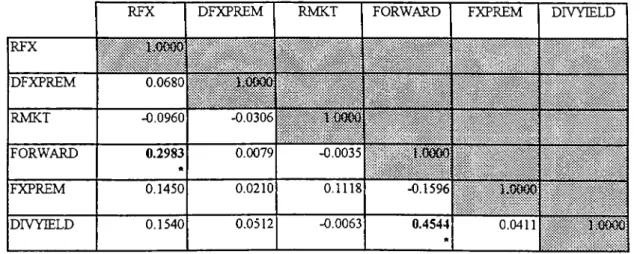
Table 2 presents summary statistics for monthly series o f economic risk factors and information variables. It is seen that the mean value for RFX, monthly percent change in the official TL per US dollar foreign exchange rate, is 5.14% during the sample period. Since this is a monthly figure, the average annualized compounded devaluation is over 82% during the sample period. Mean o f FORWARD at 5.19%, the spread between Turkish and U.S. T-bill yield, roughly equals average annualized interest rate differential o f 83.5%. However, 5.19% monthly interest rate differential is meaningful when compared to the 5.14% monthly appreciation o f dollar against the domestic currency since it indicates an explanation to uncovered interest rate parity. It is also meaningful considering the low level o f inflation in the United States. Figure 1 in Appendix C plots the official exchange rate with its corresponding lagged information variable namely, RFX and FORWARD.
The mean o f DFXPREM, monthly percent change in the free market premium for dollars is at 3.29% and less than the mean o f RFX, official dollar return being 5.4%.
Autocorrelation is calculated for lags o f 1, 2, 3, 4, 5, and 12 for monthly series o f economic risk factors. Seasonal or quarterly movements or patterns repeated year after year could not be observed for the economic risk factors within the significance level o f 5%. However, two o f the lagged information variables, FORWARD and DIVYIELD, show persistent serial correlation for first four o f the lags calculated and all three lagged information variables show significant autocorrelation coefficients at the first lag. Significant autocorrelation lags are indicated with an asterisk under the coefficient.
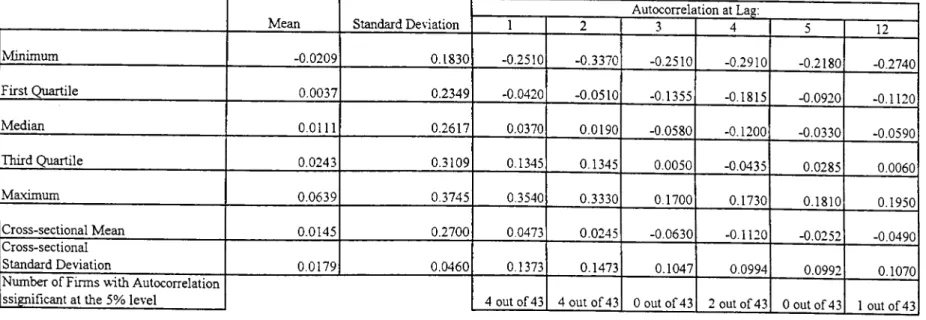
Cross-correlations between the variables can be found in Table 2-c. Again, to a significance level o f 5% it is seen that RFX and FORWARD are relatively correlated among other variables that can be interpreted as the obedience o f official exchange rate to uncovered interest rate parity.
The expression for interest rate differential is:
(
9)
1 + m _ Jtl / $ 1 + /·$ STu%
where, ft-L/s is the forward TL per dollar exchange rate and stl/$ is the spot TL per dollar exchange rate. Also, ricand r$ are the interest rates for the Turkish and U.S. markets, respectively.
Also it is seen that FORWARD and DIVYIELD have cross correlation significant at the 5% level.
Figure 2 plots the free market premium relative to the official dollar rate (FXPREM, DFXPREM) and finally Figure 3 shows the dividend yield and monthly rate o f change o f the ISE composite index (RMKT, DIVYIELD).
Table - 2 Summary Statistics for Monthly Series of Economic Risk Factors and Information Variables Table - 2.a Economic Risk Factors Summary' Statistics
Variable Description Mean Standard Deviation
Autocorrelation at Lag:
1 2 3 4 5 12
RFX Monthly percent change in the official TL per US dollar foreign exchange rate
0.0514 0.0782 0.155 -0.026 0.108 -0.050 -0.044 -0.054
DFXPREM Monthly percent change in the free market premium for dollars
3.2991 39.6745 -0.011 -0.009 -0.014 0.021 0.002 -0.007
RMKT Monthly log-change in the ISE composite index in excess of the riskless T-bill rate
2.1915 1.1057 -0.039 -0.120 0.026 -0.009 0.097 0.116
Table - 2.b Information Variables Summary Statistics
Variable Description Mean Standard Deviation
Autocorrelation at Lag;
1 2 3 4 5 12
FORWARD Monthly yield spread between Turkish and U.S. own currency Treasury' bills
5.1907 1.6311 0.893 A 0.756 A 0.642 * 0.511* 0,386 A 0.020 FXPREM Premium for U.S. dollars at the free market rate
relative to the official rate
49.0467 326.3960 0.302
*
-0.219 -0.153 0.007 0.022 -0.014 DFVYIELD Armualized dividend vield on the ISE composite
index 0.0450 0.0172 0.822 * 0.684 A 0.509 * 0.355 A 0.221 -0.015
Table - 2.C Cross-correlations
RFX DFXPREM RMKT FORWARD FXPREM DIVYIELD
RFX ■ DFXPREM 0.0680 RMKT -0.0960 ¿.0306 FORWARD 0.2983 * 0.0079 -0.0035 w m FXPREM 0.1450 0.0210 0.1118 -0.1596 h w m DIVYIELD 0.1540 0.0512 -0.0063 0.4544 * 0.0411
The Behavior of Monthly Security Returns
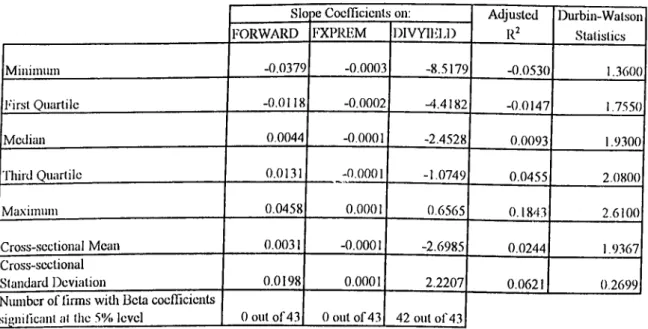
Table 3-a, Table 3-b and Table 3-c presents the results o f the tests run besides summary statistics for individual stock returns. In all o f the tables cross-sectional distributions are presented. In other words, percentile ranks o f 43 individual equities in quartiles are presented. In Tables 3-b and 3-c, 43 regressions are ran and the resulting quartile figures are presented. Mean and the standard deviations o f cross-section o f individual stocks and the number o f firms with beta coefficients significant at 5% level are also presented. Adjusted R-square output and Durbin-Watson Statistics are also used to support our conclusions.
Table 3-b presents the cross-sectional distribution o f regression results for the economic risk factors while Table 3-c presents the cross-sectional distribution o f regression results for the lagged information variables.
Table 3-a presents the cross-sectional distribution o f univariate statistics on monthly real stock returns. Even though the real stock returns are expressed in excess o f the risk free market rate the median return is more than one percent (1.11%). This can be interpreted as the availability o f real growth potential in stock market prices. Second interpretation may be the existence o f risk premium due to high and unexpected inflation during the period. The volatility are substantial as expected from an emerging market given in the standard deviation column. Serial correlation in monthly stock returns is evident in first and second lags for only 4 o f the stocks out o f 43.
Table 3-b and Table 3-c summarizes coefficients o f the regression (Equation 2a and Equation 2b) o f stock returns on the economic risk factors and lagged information
variables, respectively. Again, cross-sectional distribution o f coefficients are presented o f the 43 regressions for each table. It is observed that RFX, the change in the official exchange rate is significant for 37 out o f 43 o f the stocks in the sample. This variable will lead us to crucial inferences when we consider the equally weighted industry analysis in the next section.
And it is apparent that none o f the stocks show significant exposure to DFXPREM, the change in the free market dollar premium and RMKT, real market return. This means that local investors are insensitive to increases in currency risk and political risk as measured by DFXPREM: They do not sell stocks and be exposed to dollars with
devaluation expectations.
Among the three lagged variables, DIVYIELD exhibits significant forecast power for selected stocks (42 out o f 43). This feature will also be observed with industry portfolio analysis in the next section. Other than that, namely FORWARD and FXPREM, slope coefficients show little explanatory power.
Also, it is observed that the residuals o f the regressions for both economic risk factors and the lagged information variables are uncorrelated since the Durbin-Watson d Statistic is around 2.
Table - 3.a Cross-sectional distribution of univariate statistics on monthlv stock returns Table - 3 The Behaviour of the Monthly Slock Returns
Mean Autocorrelation at Lag: Standard Deviation 1 2 3 4 5 12 Minimum -0.0209 0.1830 -0.2510 -0.3370 -0.2510 -0.2910 -0.2180 -0.2740 First Quartile 0.0037 0.2349 -0.0420 -0.0510 -0.1355 -0.1815 -0.0920 -0 .1 1 2 0 Median 0 .0 1 1 1 0.2617 0.0370 0.0190 -0.0580 -0 .1 2 0 0 -0.0330 -0.0590 Third Quartile 0.0243 0.3109 0.1345 0.1345 0.0050 -0.0435 0.0285 0.0060 Maximum 0.0639 0.3745 0.3540 0.3330 0.1700 0.1730 0.1810 0.1950 Cross-sectional Mean 0.0145 0.2700 0.0473 0.0245 -0.0630 -0 .1 1 2 0 -0.0252 -0.0490 Cross-sectional Standard Deviation 0.0179 0.0460 0.1373 0.1473 0.1047 0.0994 0.0992 0.1070
Number of Firms with Autocorrelation
Table -
3
.b Cross-sectional distribution oT coeilicients from regressions of monthly sto unanticipated changes in risk factorsSk)pe Coelficients on: Adjusted Durbin-Watson
RFX DFXPREM RMK'f Statistics Miniinuin -0.9384 -0.0003 -0.0404 -0.0562 1.2700 Thirst Qiiartile -0.6682 0.0001 -0.0 0 1 0 -0.0325 1.6950 Median -0.4558 0.0004 0.0079 -0.0168 1.9200 'Third Quarlile -0.1676 0.0009 0.0221 0.0062 2.0800 Maximum 1.2269 0.0017 0.0608 0.1394 2.,5200 Cross-sectional Mean -0.3412 0.0005 0.0095 -0.0079 1.8967 Cross-sectional Standard Deviation 0.4715 0.0005 0.0215 0.0379 0.2773
Number oT linns with Beta coefficients
significant at the 5% level 37 out of 43 0 out of 43 0 out of 43
Table - 3.C Cross-sectional distribution of coefficients from forecasting regressions of inontlily stock returns on lagged infonnation variables
Sic) -)Q Coefficients on: Adjusted Durbin-Watson
FORWARD FXPREM DIVYIEld) R^ Statistics
Minimum -0.0379 -0.0003 -8.5179 -0.0530 1.3600 First Qiiartile -0.0118 -0.0 0 0 2 -4.4182 -0.0147 1.7550 Median 0.0044 -0.0001 -2.4528 0.0093 1.9300 'Third Quartile 0.0131 -0.0001 -1.0749 0.0455 2.0800 Maximum 0.0458 0.0001 0.6565 0.1843 2.6100 Cross-sectional Mean 0.0031 -0.0001 -2.6985 0.0244 1.9367 Cross-sectional Standard Deviation 0.0198 0.0001 2.2207 0.0621 0.2699
Number of firms willi Beta coefficients
Industry Portfolio Return Behavior
Table 4-a and Table 4-b presents the results o f the tests run for equally weighted industry returns composed as a consequence o f the stock selection process. Equally weighted industry portfolio are formed by totaling all the real stock returns composing the industry divided by the number o f stocks in that specific industry.
Regression coefficients significant at the 5% level are indicated by bold face and underlined characters. Adjusted R-square and Durbin-Watson Statistics are also used to support our conclusions.
Table 4-a presents the cross-sectional distribution o f regression results for the economic risk factors while Table 4-b presents the cross-sectional distribution o f regression results for the lagged information variables
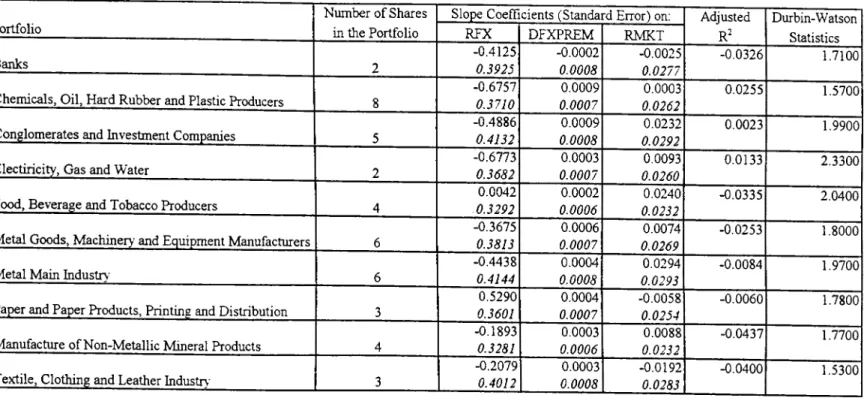
Equally weighted industry portfolios report similar results overall, as shown in Table 4-a, which deviates with RFX. This economic risk factor is relatively significant; as official dollar rate increases there is tendency to affect industry returns o f individual stock returns negatively. In industries with exporting capabilities, however, this coefficient is lower in absolute terms as seen with the food, beverage and tobacco producers and textile, clothing and leather industry.
Among lagged information variables, as presented in Table 4-b, DIVYIELD is significant for conglomerates and investment companies and textile, clothing and leather industry and negatively affecting the stock returns with a negative slope coefficient. This mirroring relation as in the specific stock return analysis can be interpreted as; the increase o f DIVYIELD decreases stock returns which can also be observed from Figure 3 in the Appendices.
The other proxying variables for equally weighted industries do not infer statistically significant coefficients at a 5% level.
Since the Durbin-Watson d Statistic is around 2 within a probable range from 0 to 4, it can be concluded that the residuals o f the regressions ran for the classified industries are uncorrelated.
The results o f the industry portfolio are not deviated from the inferences o f individual stock behavior analysis.
Table - 4 Table - 4.a
Risk Exposures and Forecastibilily of Monthly Industry Portfolio Returns Regressions of Portfolio Returns on Risk Factors
Portfolio
Number of Shares in the Portfolio
Slope Coefficients (Standard Error) on; Adjusted R^ Durbin-Watson Statistics RFX DFXPREM RMKT Banks 2 -0.41250.3925 -0.00080 .0 0 0 2 -0.0025 0.0277 -0.0326 1.7100
Chemicals, Oil, Hard Rubber and Plastic Producers 8
-0.6757 0.3710 0.0009 0.0007 0.0003 0.0262 0.0255 1.5700
Conglomerates and Investment Companies 5
-0.4886 0.4132 0.0009 0.0008 0.0232 0.0292 0.0023 1.9900
Electiricity, Gas and Water 2 -0.67730.3682 0.00070.0003 0.0093
0.0260
0.0133 2.3300
Food, Beverage and Tobacco Producers 4
0.0042 0.3292 0 .0 0 0 2 0.0006 0.0240 0.0232 -0.0335 2.0400
Metal Goods, Machinery and Equipment Manufacturers 6
-0.3675 0.3813 0.0006 0.0007 0.0074 0.0269 -0.0253 1.8000
Metal Main Industry^ 6
-0.4438 0.4144 0.0004 0.0008 0.0294 0.0293 -0.0084 1.9700
Paper and Paper Products, Printing and Distribution 3
0.5290 0.3601 0.0004 0.0007 -0.0058 0.0254 -0.0060 1.7800
Manufacture of Non-Metallic Mineral Products 4
-0.1893 0.3281 0.0003 0.0006 0.0088 0.0232 -0.0437 1.7700
Textile, Clothing and Leather Industry' 3
-0.2079 0.4012 0.0003 0.0008 -0.0192 0.0283 -0.0400 1.5300
Table - 4.b
Regressions of Portfolio Returns on Lagged Information Variables
Portfolio
Number of Shares in the Portfolio
Slope Coefficients (Standard Error) on: Adjusted R^
Durbin-Watson Statistics
FORWARD FXPREM DIVYIELD
Banks 2 0.02050.0066 -0 .0 0 0 2
0.0001
-3.0397
1.9266
0.0539 1.6800
Chemicals, Oil, Haird Rubber and Plastic Producers 8
0.0053 0.0202 -0 .0 0 0 1 0.0001 -2.8272 1.9018 0.0263 1.5800
Conglomerates and Investment Companies 5
-0.0106 0.0209 -0 .0 0 0 2 0.0001 -4.6924 1.9673 0.1402 1.9500
Electiricity, Gas and Water 2 -0.01400.0207 0.00010 .0 0 0 0 -0.1567
1.9415
-0.0434 2 .2 2 0 0
Food, Beverage and Tobacco Producers 4
0 .0 0 0 0 0.0180 -0 .0001 0.0001 -0.6256 1.6882 -0.0334 2.0300
Metal Goods, Machine^· and Equipment Manufacturers 6
-0.0158 0.0204 -0 .0001 0.0001 -1.8511 1.9148 0.0167 1.7300
Metal Main Industiy 6
0.0068 0.0228 -0.0001 0.0001 -2.1546 2.1451 -0.0274 1.9700
Paper and Paper Products, Printing and Distribution 3
0.0341 0.0183 -0 .0 0 0 2 0.0001 -2.9232 1.7186 0.1289 2.1900
Manufacture of Non-Metallic Mineral Products 4
0.0143 0.0174 0 .0 0 0 0 0.0001 -2.8411 1.6360 0.0133 1.7800
Textile, Clothing and Leather Industrv 3
0.0175 0.0200 -0.0001 0.0001 -5.6308 1.8776 0.1341 1.7100
CHAPTER 5
CONCLUSION AND RECOMMENDATIONS
The effects o f exposure to exchange rate risk and political risk on equity market risk premium are investigated in an emerging market: Turkey. We have defined two sets o f proxying variables to forecast currency risk and political risk. There were three
economic risk factor variables and three lagged information variables. The empirical tests for equity market risk premium is structured in two phases. In the first phase, exposure o f cross-sectional individual equity returns to exchange rate risk and political risk are analyzed. In the second phase, tests are repeated for equally weighted industry portfolio.
It is observed that there is evidence o f equity market premiums for exposure to fluctuations in the free market dollar premium and annualized dividend yield o f the ISE composite index. Particular evidence o f unconditional equity market premium is
observed with three o f the six variables used in the study. These variables are the official change in the TL per dollar rate; premium for US dollars at the free market rate; and annualized dividend yield on the ISE composite index. Official change in the TL per dollar rate is the variable proxying for the economic risk factors where premium for US dollars at the free market rate and annualized dividend yield on the ISE composite index were proxy for the lagged information variables.
For the cross-sections o f individual equity returns part; RFX and DIVYIELD were significant variables. This implies that policies o f Central Bank o f Turkey is an important factor affecting the equity prices. Also, dividend policies o f the stocks trading have inverse proportion with the stock returns; as stock returns increase there is tendency for the DIVYIELD to decrease.
Similar results have been obtained for the equally weighted industry portfolio
analysis. FXPREM, the free market premium o f dollar rate is found significant for Paper and Paper Products, Printing and Distribution industry. DIVYIELD is found significant for Conglomerates and Investment Companies that is very meaningful due to the nature o f their sources o f revenues from dividends o f their participations and affiliates.
DIVYIELD is also found significant for Textile, Clothing and Leather industry that also makes sense given the high dividends they pay when the stock underperformed or vice versa.
Since the stock market is moving in line with the policies o f Central Bank o f Turkey, international portfolio and fund managers may diversify their portfolio with exposure to ISE. In the Mexican case Bailey and Chung (1994) found significant associations between equity market premiums for currency and political risks. However, they find no evidence o f either unconditional or conditional risk premiums for exposure to changes in the official exchange rate. This implies that unlike the Turkish case, central bank o f Mexico does not have significant effect on their stock market.
For the individual investor it is evident that the Turkish stock market offers a
premium. However, each individual has to decide whether this premium is sufficient for his risk aversion policy.
It is worth reminding here that, comparison with other developing countries and for longer sample periods can be designed with the addition o f new proxying variables, and with larger sets o f stock for longer sample periods .
Although, extreme care is given to the formation o f the data set, limitations faced have to be kept in mind. Missing observations, thinly traded or volatile stocks have been the limitations o f the data set.
LIST OF REFERENCES
AGMON, Tamir. (1972) “The Relations Among Equity Markets in the United States, United Kingdom, Germany, and Japan”, Journal o f Finance 27, 839-855
AKGIRAY, Vedat. (1989) “Conditional Heteroskedasticity in Time Series o f Stock Returns; Evidence and Forecasts”, Journal o f Business 62, 55-80
ALEXAKIS, Panayotis and Petrakis, P. (1991) “Analysing Stock M arket Behaviour in Small Capital M arket”, Journal o f Banking and Finance 15, 471-483
BAILEY, Warren and Chung, Y. Peter. (1994) “Exchange Rate Fluctuations, Political Risk, and Stock Returns: Some Evidence from an Emerging M arket”, as presented in the meeting o f AFA at ASS A in 1994
BROWN, Stephen J. and Otsuki Toshiyuki. (1990) “Macroeconomic Factors and the Japanese Equity Markets: The CAPMD Project”, Japanese Capital Markets. Elton E. J., and M. J. Gruber, eds. New York: Flarper and Row, (1990) 175-92
CLARK, P.K. (1973) “A Subordinated Stochastic Process Model with Finite Variance for Speculative Prices”, Econometrica 41, 135-155
PERSON, Wayne E. and Harvey. Campbell R. (1991) “The Variation o f Economic Risk Premiums”, Journal o f Political Economy 99, 385-415
PERSON, Wayne E. and Harvey. Campbell R. (1993) “The Risk and Variability o f International Equity Returns”, Review o f Financial Studies 6, 527-66
GRANGER, C.W.J. and Morgenstern, 0 . (\91Qi) “Predictability o f Stock Market Prices”. Lexington
HILLIARD, J.E. (1979) “The Relationship Between Equity Indices on World Exchanges”, Journal o f Finance 34, 103-114
HSIEH, David. (1991) “Chaos and Nonlinear Dynamics: Application to Financial Markets”. Journal o f Finance 46. 1839-1877
JORION, Philipe. (1990) “The Exchange Rate Exposure o f U.S. Multinationals”, Journal o f Business 63, 331-45
JORION, Philipe. (1991) “The Pricing o f Exchange Rate Risk in the Stock M arket”, Journal o f Financial and Quantitative Analysis 26, 363-76
NEFTCI, Salih. (1984) “Are Econometric Time Series Asymmetric over the Business Cycles?”, Journal o f Political Economy 92, 307-328
PRESS, S.J. (1968) “A Compound Events Model for Security Prices”, Journal o f Business 41, 317-335
SHARPE, William F. and Alexander, Gordon J. (1990) “Investments”. Prentice Hall International Editions, Fourth Edition, 810-811
YUCE, Ayşe. (1996) An Examination o f an Emerging Stock Exchange: The Case o f Turkish Stock M a rk e t. Capital Markets Board o f Turkey, Ankara (1996),
Publication No:39
APPENDIX A
'I'ablc - I .a Overview oflhe Slock Price Sample
Company Ticker Symbol Industry Classification according to ISE ISE Composite Index Monthly Observations 1Alarko Holding ALARK Conglomerates and Investment Companies
2 Anadolu Cam ANACM Manufacture of Non-Metallic Mineral Products 0 57
3 Arçelik ARÇLK Metal Goods, Machinery and Equipment Manufacturers 0 58
4 Bagfaş BAGFS Chemicals, Oil, Hard Rubber and Plastic Producers 0 58
5 Bolu Çimento BOUJÇ Manufacture of Non-Metallic Mineral Products 58
6 Brisa BRISA Chemicals, Oil, Hard Rubber and Plastic Producers 0 58
7 Çelik Halat ÇELHA Metal Main Industry 0 58
8 Çimsa ÇÎMSA Manufacture of Non-Metallic Mineral Products 58
9 Çukurova Elektrik ÇUKEL Electiricity, Gas and Water 0 58
10 Deva ilolding DEVA Chemicals, Oil, Hard Rubber and Plastic Producers 0 58
11 Döktaş bOKTS Metal Main Industry 58
12 Eczacıbaşı Yatırım ECZYT Conglomerates and Investment Companies 0 58
13 Ege Biracılık EGBR.^ Food, Beverage and Tobacco Producers 0 58
14 Ege Gübre EGGUB Chemicals, Oil, Hard Rubber and Plastic Producers 0 58
15 Ereğli Demir Çelik EREGL Metal Main Industry' 0 58
16 Goodyear GOODY Chemicals, Oil, Hard Rubber and Plastic Producers 58
17 Gübre Fabrikaları GÜBRF Chemicals, Oil, Hard Rubber and Plastic Producers 0 58
18 Güney Biracılık GÜNEY Food, Beverage and Tobacco Producers 58
19 Hektaş HEKTS Chemicals, Oil, Hard Rubber and Plastic Producers 0 58
20 İzmir Demir Çelik İZMDC Metal Main Industry' 0 58
21 İzocam tZOMC Manufacture of Non-Metallic Mineral Products 0 57
Company Ticker Symbol Industry Classification acco^^^^
ISE Composite Index Monthly Observations 58 23 _24 25 K09 Holding 26 Koç Yatırım 27 Kepez Elektrik Kordsa 28 Ko>1as Tekstil 29 Makina Takım 30 Marct 3l 32 Metaş Olmuksa 33 Otosan 34 Pınar Süt Şarklıysan 36 37 S i faş 38 Şişe Cam Siemens 39 40 41 Teletaş T.S.K.B. T.Demir Döküm 42 43 Yasaş KCHOL KCYAT KEPEZ KORDS KÖYTS MAKTK MARET METAS OLNfKS PNSUT SARKY SIFAS m SMENS TLTS T.S.K.B. TUDDF YASAS Yapı ve Kredi Bankası YKBNK
Paper and Paper Products, Printing and Distribution Conglomerates and Investment Companies
Conglomerates and Investment Companies Electiricity, Gas and Water
Textile, Clothing and Leather Industry-Textile, Clothing and Leather Industry
Metal Goods, Machineiy- and Equipment Manufacturers
T~»___________________ j 'T ' i , ---
---Food, Beverage and Tobacco Producers Metal Main Industiy
Paper and Paper Products, Printing and Distribution Metal Goods, Machineiy and Equipment Manufacturers Food, Beverage and Tobacco Producers
Metal Main Industry
Textile, Clothing and Leather Industry Conglomerates and Investment Companies
Metal Goods, Machiner>- and Equipment Manufacturers Metal Goods, Machineiy^ and Equipment Manufacturers Banking
Metal Goods, Machinery and Equipment Manufacturers Chemicals, Oil, Hard Rubber and Plastic Producers Bankin^_ 0 0 0 -M. 0 0 0 0 0 0 0 0 0 0 0 0 0
33
58 58 58 _5857
57
57
57
57
57
5857
58 5854
57
58 58 58ahlo - 1 b Lisl of the Stock Price Sample grouped by Industn' Classification according to ISl·^
Hanking
1 T.S.K.B.
2 Yapı ve iCredi Bankası
Chemicals, Oil, Hard Rubber and Plastic Producers
1 Bagfaş 2 Brisa 3 Deva Holding 4 Egc Gübre 5 Gübre Fabrikaları () Goodyear 7 Hektaş 8 Yasaş
Conglomerates and Investment Companies
1 Alarko Holding 2 Eczacıbaşı Yatinm 3 K.OÇ Holding 4 K.OÇ Yatırım 5 Şişe Cam
Electiricity, Gas and Water
1 Çukurova Elektrik 2 ICepez Elektrik
Food, Beverage and Tobacco Producers
1 Ege Biracılık 2 Güney Biracılık 3 Marct 4 Pınar Süt
Metal Goods, Machinery and Equipment Manufacturers
1 y\rçelik 2 Makina Takım 3 Otosan 4 Siemens 5 T.Demir Döküm 6 Teletaş
Metal Main Industry
1 Çelik Halat 2 Döktaş
3 Ereğli Demir Çelik 4 İzmir Demir Çelik 5 Metaş
6 Sarkuysan
Paper and Paper Products, Printing and Distribution
1 İCartonsan 2 Kav 3 Olmuksa
Manufacture of Non-Mctallic Mineral Products
1 Anadolu Cam 2 Bolu Çimento 3 Çimsa 4 İzocam
TextUe, Clothing and Leather Industry
1 Kordsa 2 Koytas Tekstil 3 Sifaş
Table I-c
:/28/‘Л) мм)т Аім)т 5/31 /90 о/2 9/90 7/31 /90 S/31 /90 9/28/90 10/31/90 1 1 /30/90 12/28/90 1/31/91 2/28/91 3/29/91 4/30/91 5/31/91 6/28/91 7/31/91 8/29/91 9/30/91 10/31/91 11/29/91 12/31/91 1/31/92 2/28/92 ЛІіігІѵ 58.0% 12.7%
101
.6
% -19.2% -1.9% 25.4% 25.5% -7.0% -10.5% -23.7% -17.7% 39.2% 20.3% -5.1% -28.2% 1.7% 1.6% -33.2% 1.5% -9.7% -22.9% 94.0% 2.
1%
50.5% -48.0% 1 2 Лпаст -5.3% 5.0% -10.9% 9.2% -9.2% -9.7% -14.5% -10.6% -11.1% -13.4% -16.4% 21.
1%
7.8% -19.0% -34.4% -18.1% -6.8% -37.8% -27.6% -10.0% -0.9% 22.8% -12
.8
% 26.6% -26.5% 3 Arçclik 17.3% -11.0% -15.3% 50.7% 26.2% 27.2% -15.9% -8.4% -8.7% -24.5% -18.9% 61.6% 33.9% -10
.0
% -22.6% 14.8% 10.2% -5.4% -3.3% -16.8% -10
.0
% 43.1% 9.5% 14.1% -29.3% 4 Bagl's 6.7% -17.4% -6.8% 64.5% 11.3% -8
.2
% -2.7% 11.5% -20
.0
% -32.1% -9.7% 24.5% 7.3% -17.6% -31.9% -11.2% -8.9% -46.2% 5.9% -15.4% -5.7% 27.4% 16.8% -3.1% -32.0% 3/31/92 32.7% 2.4% 1.8% -2.3% 4/30/92 -18.6% 23.3% -14.8% -17.2% 5/29/92 -31.0% -28.0% -23.6% -22.4% 6/30/92 27.9% 79.7% 34.4% 18.0% 7/31/92 -16.9% 9.4% -8.1% 3.7% 8/31/92 -9.2% -16.0% -11.4% -2 0.6% 9/30/92 -8.0% -5.9% -10.4% -25.1% 10/27/92 -4.8% -35.5% -17.9% -10.6% 11 /30/92 -17.8% -8.4% -8.6% 9.2% 12/31/92 -7.2% -12.9% 0.6% -5.9% 1 /29/93 -12.1% 0.9% ^.3% 7.1% 2/26/93 25.2% 9.4% 24.3% 19.5% 3/31/93 -11.3% -5.2% -11.2% 24.1% 4/30/93 7.8% 1.0% 45.4% 85.2% 5/28/93 8.1% 0.5% 9.5% 4.6% 6/30/93 45.6% 31.8% 28.9% 17.4% 7/30/93 -0.8% -9.3% -12.1% -17.3% 8/31/93 24.8% 91.9% 9.5% 32.2% 9/30/93 32.1% 13.5% 18.3% 17.4% 10/27/93 11.1% 14.3% 26.0% -11.6% 1 1 /30/93 54.0% 3.5% -9.5% 32.5% 12/31/93 34.5% 1.9% 0.0% 9.3% 1/31/94 5.3% 5.5% 3.8% -30.1% 2/28/94 -24.7% -46.9% -11.2% -57.7% 3/31/94 -51.2% -14.0% -2 1.1% -2 1.6% 4/29/94 3.9% -32.7% -5.5% -7.1% 5/31 /94 38.1% -27.6% 12.9% 6.6% 6/30/94 32.6% 91.2% -16.9% 37.9% 7/29/94 -8.8% 34.0% -9.9% -15.2% 8/31 /94 14.9% 69.6% 29.4% 17.7% 9/30/94 4.5% 1.6% -1.3% 11.8% 10/31/94 -23.4% -10.3% -11.2% -10.0% 5 6 7 8 9 10Boluç Brisa Çeiha Çimsa Çukcl Deva
-15.4% 6.6% -20.4% 5.6% -12.7% 13.6% 56.5% -12.3% -3.3% -11.4% 0.9% 19.1% -34.3% 7.4% -8.6% 21.5% -3.3% 3.6% 2.7% 19.8% 38.1% 10.0% 2.7% 17.4% -1.4% -2.0% -12.7% -12.9% -5.1% 6.7% ' -10.8% -9.6% -3.4% -4.6% -5.4% -9.3% -21.9% -3.6% -18.6% -21.5% 0.3% 21.4% 34.4% -19.6% -10.4% -11.0% 7.5% -8.8% 1.6% -30.4% -12.7% -25.7% -10.6% -3.8% -19.3% -24.2% -24.6% -6.0% -25.8% -26.3% 7.6% -3.3% 1.7% -5.4% -6.8% 7.9% 18.9% 19.5% 68.9% 31.7% 2 1.8% 12.7% 19.8% 12.3% 12.2% 31.6% 14.2% 30.7% -2 0.2% -14.3% -19.6% -18.4% -11.5% -10.8% -34.2% -24.3% -30.2% -32.3% -34.2% -34.4% 4.0% -5.6% -4.3% -2.1% 6.3% 5.8% -8.4% 0.9% -17.1% -3.6% -2 1.2% 4.4% -44.5% -2 2.1% -28.3% -26.1% -28.0% -43.1% 2 1.2% -25.3% 7.5% -7.5% 41.4% 13.4% -16.0% -23.1% -12.8% -18.7% -12.6% -24.6% -19.2% -3.5% -26.2% 9.7% -32.2% 3.2% 84.6% 19.7% 22.3% 43.0% 40.7% 77.8% -5.4% 6.3% 2.7% 30.4% -10.9% -1.2% 0.7% 26.4% 3.9% -6.4% 8.1% 0.9% -35.1% -43.3% -30.7% -17.6% -24.0% -40.7% 15.9% 2 0.6% 19.6% -7.9% 13.4% 6.8% -28.3% -27.5% -5.4% -5.4% -3.7% -36.3% -19.4% -2 1.0% -12.0% -8.3% -12.6% -19.4% 28.4% 21.3% 38.7% 1.0% 44.0% 10.7% -24.6% -11.5% -4.4% -8.6% -0.2% -15.5% -5.9% -5.9% -24.8% 2.1% -3.2% -24.5% -2 0.6% 14.9% -13.0% -5.9% -4.5% -5.9% -5.9% 0.5% -3.9% -9.6% -13.7% -15.3% -1.7% -5.9% -11.7% -11.0% 5.6% 22.7% -1.9% -3.0% 10.0% 2.2% -7.2% -8.8% -1.6% -4.5% 23.5% 10.4% 21.4% -8.9% 28.9% 72.1% 18.6% 28.9% 25.9% 30.3% -7.9% 9.1% 6.6% -9.2% -4.0% -11.8% 0.6% -17.5% 64.1% 1.0% -16.2% 18.1% 7.2% 12.9% 8.7% 61.8% 10.6% 2.1% 55.8% 32.1% 9.3% 10.8% 25.0% 35.0% -19.1% -14.0% -31.7% 3.2% -11.4% 6.1% 16.1% 32.5% 14.6% 6.6% 11.5% 1.5% 42.2% 7.1% 44.3% 1.9% -3.1% 27.5% -29.7% -15.9% -40.8% 11.4% -15.0% -6.6% 48.9% 29.1% 2 0.8% 46.5% 47.8% 29.8% 32.9% 39.9% 26.4% -6.4% 7.5% 2.8% -2.9% 20.5% 42.7% -10.3% -27.1% 39.1% -49.6% -49.2% -44.3% -13.5% -11.6% -49.6% -21.5% -2 1.2% 0.2% 9.9% 9.0% -12.2% 24.2% -27.5% -48.8% 8.1% -52.0% -51.5% -10.5% 23.0% -5.8% -19.6% -48.1% -35.3% 67.4% 48.5% 12.0% -5.4% 41.2% 28.3% 16.4% 29.5% 45.5% -1.2% 24.6% 6.6% 13.5% 2 0.2% -15.1% 11.3% -24.4% 51.3% 2.1% 17.8% 11.0% 4.7% 0.3% -3.8% -16.3% -19.6% -13.4% 0.5% -29.5% -26.8%