THE EFFECT OF REAL EXCHANGE RATE ON UNEMPLOYMENT IN TURKEY A Master’s Thesis by NİLAY KILIÇASLAN Department of Economics Bilkent University Ankara July 2007
THE EFFECT OF REAL EXCHANGE RATE ON UNEMPLOYMENT IN TURKEY
The Institute of Economics and Social Sciences of
Bilkent University
by
NİLAY KILIÇASLAN
In Partial Fulfilment of the Requirements for the Degree of MASTER OF ARTS
in
THE DEPARTMENT OFECONOMİCS BİLKENT UNIVERSITY
ANKARA July 2007
I certify that I have read this thesis and have found that it is fully adequate, in scope and in quality, as a thesis for the degree of Master of Arts in Economics.
--- Assc. Prof. Kıvılcım Metin Özcan Supervisor
I certify that I have read this thesis and have found that it is fully adequate, in scope and in quality, as a thesis for the degree of Master of Arts in Economics.
--- Assc. Prof. Syed F. Mahmud Examining Committee Member
I certify that I have read this thesis and have found that it is fully adequate, in scope and in quality, as a thesis for the degree of Master of Arts in Economics.
--- Asst. Prof. Nazmi Demir Examining Committee Member
Approval of the Institute of Economics and Social Sciences
--- Prof. Erdal Erel
ABSTRACT
THE EFFECT OF REAL EXCHANGE RATE ON UNEMPLOYMENT IN TURKEY
Kılıçaslan, Nilay Master of Economics
Supervisor: Assc. Prof. Kıvılcım Metin Özcan
July 2007
This thesis is intended to analyze the influence of real exchange rate on total and urban unemployment in Turkish economy over 1988 – 2006 periods by using the original work of Frenkel (2004) for Turkey. In addition to this analysis, an alternative model is suggested to overcome some limitations of Frenkel (2004). In this thesis, three channels of influence, namely macroeconomic channel, development channel and labor intensity channel, are taken into account in the search of unemployment’s response to changes in real exchange rate. The results for both analysis show that real exchange rate influences unemployment positively through labor intensity channel for both total and urban unemployment in Turkey. Moreover, suggested alternative model achieves to
quantify the seperate effects of the influence channels which was not achieved in Frenkel (2004) due to the limitations of the model.
ÖZET
TÜRKİYE’DE REEL DÖVİZ KURUNUN İŞSİZLİK ÜZERİNE ETKİLERİ
Kılıçaslan, Nilay Yüksek Lisans, İktisat Bölümü
Tez Yöneticisi: Doç. Dr. Kıvılcım Metin Özcan
Temmuz 2007
Bu çalışma Türkiye’de döviz kurunun 1988 – 2006 yılları arasında toplam ve kentsel işsizliği ne yönde etkilediğini incelemiştir. Çalışmada Frenkel (2004) tarafından geliştirilen üç etki kanalı olan makro iktisadi kanal, kalkınma kanalı ve emek yoğunluğu kanalı göz önünde bulundurulmuştur. Frenkel (2004)’te sunulan modelin etki kanallarını açıklamadaki kısıtlılığından dolayı, alternatif bir mıodel önerilmiştir. Her iki model için de çalışmanın bulguları reel döviz kurunun işsizliği pozitif yönde etkilediği sonuçunu çıkarmıştır. Alternatif modelin ek olarak katkısı bahsi geçen üç etki kanalının sonuçlarını ayrı ayrı ölçmeyi başarmış olmasıdır.
ACKNOWLEDGEMENTS
I would like to thank to Prof. Kıvılcım Metin Özcan for her supervision, guidance and motivation through the development of this thesis.
I am indebted to Prof. Erinç Yeldan who has a great influence on my decision of my career path, who endeared me my profession so much.
I would like to thank to Prof.Syed Mahmud, Prof. Serdar Sayan and Prof. Tarık Kara for their support and motivation.
I owe special thanks to my beloved fiancé, my future husband, who carried me this way and supported me in every stage of this process.
Finally, I especially would like to express my deepest gratitude to my mother, my father and my grandmother who brought me up to the person I am today.
TABLE OF CONTENTS
ABSTRACT………...………...…..…..iii
ÖZET………...……...…..…v
ACKNOWLEDGEMENTS...…...vi
TABLE OF CONTENTS………...vii
LIST OF TABLES ………...ix
LIST OF FIGURES………... xi
CHAPTER 1: INTRODUCTION………...1
CHAPTER 2: LITERATURE SURVEY………...4
CHAPTER 3: THE CHANNELS OF INFLUENCE OF THE REAL EXCHANGE RATE ON UNEMPLOYMENT…...13
3.1 The Macroeconomic Channel………...14
3.2 The Development Channel………...16
3.3 The Labor Intensity Channel………...19
CHAPTER 4: STYLIZED FACTS………...23
4.1 Employment, Unemployment and Related Policies Implemented in Turkey……….………...41
4.1.2 Unemployment Policies in Turkey………...46
CHAPTER 5: EMPIRICAL MODELING………...50
5.1 Data………...51
5.1.1 Labor Force Statistics………...………...51
5.1.2 Real GDP………...…...57
5.1.3 Real Exchange Rate………..…...58
5.2 Testing Unit Root………..…...…...59
5.3 Empirical Model and Estimation………...………..63
5.4 An Alternative Model…………...………..72
5.5 Results...77
CHAPTER 6: CONCLUSION………...…………...80
SELECTED BIBLIOGRAPHY...……….…………...85
LIST OF TABLES
1. TABLE 1: Turkish Imports Regarding the Types of Goods………...…21
2. TABLE 2: Real GDP, GDP Index and Trade Indices………...…..40
3. TABLE 3: Labor Force Statistics for the pre-1988 Labor Force Survey…...….42
4. TABLE 4: Labor Force Statistics for the post-1988 Labor Force Survey…...45
5. TABLE 5: Augmented Dickey-Fuller Test Statistic………...……62
6. TABLE 6: The Main Results of Least Squares Estimation for Total Unemployment in Turkey…………...……….…..…..65
7. TABLE 7: The Results for Generalized Least Square Estimation for Total Unemployment in Turkey………...…...67
8. TABLE 8: The Results of Least Squares Estimation for Urban Unemployment in Turkey………...…..70
9. TABLE 9: Correlation Matrix of Real Exchange Rate, Real Exports and Real GDP……….…73
10. TABLE 10: Correlation Matrix of the Real Exchange Rate, Unemployment and the Proportion of Imported Capital to Manufacturing Sector Employment………74 11. TABLE 11: The Results for Least Square Estimation for Total
Unemployment in Turkey with the Alternative Model……….…...75 12. TABLE 12: The Macroeconomic Indicators for Turkey………..……85
LIST OF FIGURES
1. FIGURE 1: Unemployment Rates………...……...56
2. FIGURE 2: Hodrick-Prescott Filtered Unemployment Rates………...…..56
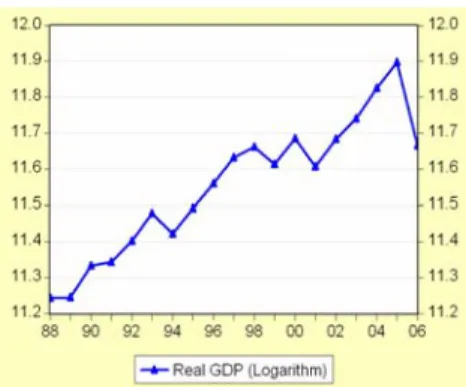
3. FIGURE 3: Real GDP………...………..57
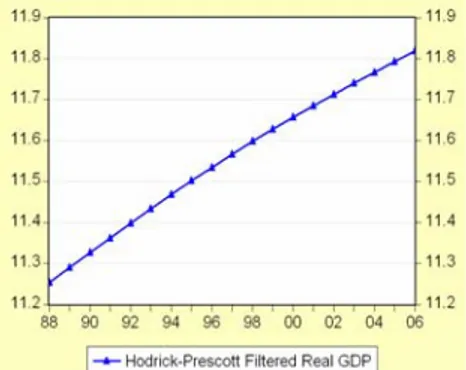
4. FIGURE 4: Hodrick-Prescott Filtered Real GDP………...………58
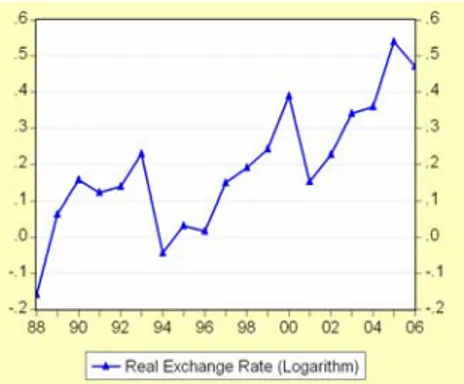
5. FIGURE 5: Real Exchange………...……..59
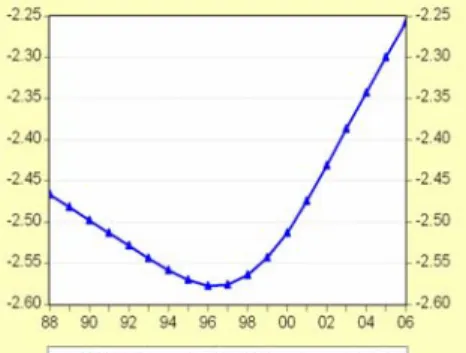
6. FIGURE 6: Hodrick-Prescott Filtered Real Exchange Rates………...…..59
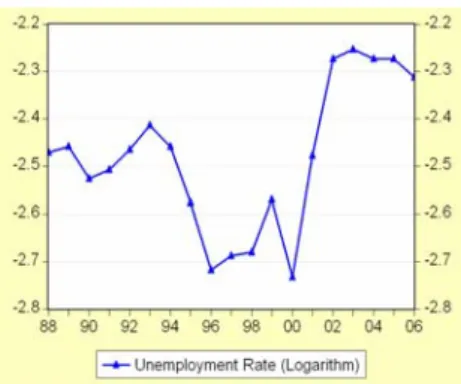
7. FIGURE 7: Level and Log Level of Unemployment Rate………...…..60
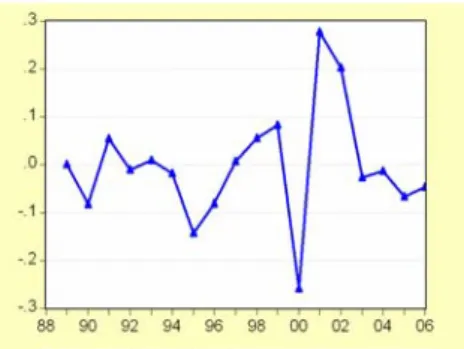
8. FIGURE 8: Growth Rate of Unemployment………...……...60
9. FIGURE 9: Level and Log Level of Urban Unemployment Rate………...…...60
10. FIGURE 10: Growth Rate of Urban Unemployment………...……..61
11. FIGURE 11: Level and Log Level of Real GDP………...…….61
12. FIGURE 12: Growth Rate of Real GDP………...……..61
13. FIGURE 13: Level and Log Level of Real Exchange Rate………...…….62
14. FIGURE 14: Growth Rate of Real Exchange Rate………...……..62
CHAPTER 1
INTRODUCTION
Turkey entered a period of financial reform in 1980 with the 24 January Stabilization Package, designed to deal with the balance of payment problems in the economy created in the 1970s and the disequilibrium in the markets. From the 1980s onwards, unemployment remained one of the most important and chronic problems in Turkish economy, stabilizing at around 8-9 percent. After the 1994 crisis, the unemployment rate decreased from 8-9 percent to 6.5 percent in 2000. The 2000 crisis caused a jump in the unemployment rate from 6.5 percent in 2000 to 8.4 percent in 2001. Considered the worst crisis in the Turkish Republic’s history, the 2001 crisis raised the unemployment rate to 10.3 percent. According to growth rates, in the post 2001 period the economy performed well. In the period 2002 to 2006 the growth rate of the Turkish economy ranged from 5.8 to 9 percent. However, this performance is not reflected in the unemployment rates, which are nearly constant during the same period. Pamukçu and Yeldan (2005) evaluated the slow performance of unemployment in the post 2001 crisis era. They argue that this picture of the economy is an example of what may be called “jobless growth” which they claim to be a key characteristic of the post- 2001
growth in Turkey. Apart from the fact that unemployment decreases national income and creates inequalities in income distribution in society, more and more people suffer a loss of skills and capacities when they are unemployed for a long time. In this sense, examination of the sources of unemployment is gaining importance in the literature. A large number of studies have focused on the effect of the real exchange rate on the growth rate of economy or inflation; however, the labor market has received less attention in terms of the real exchange rate in the Turkish economy.
The aim of this study is to analyze the effects of the real exchange rate on total unemployment and urban unemployment in Turkey over the 1988-2006 periods. We used Frenkel’s (2004) three methodological classifications given in his article for the Turkish economy. The influence of the real exchange rate on employment (unemployment in our case) is based on three different channels, namely the macroeconomic channel, development channel and labor intensity channel. Due to the insufficiency of Frenkel’s (2004) to distinguish the separate effect of these three channels, we additionally suggested an alternative model. Therefore, this study considers these three channels in the determination of the response of unemployment in Turkish to changes in the real exchange rate.
The rest of this study is organized as follows. In chapter 2, a literature survey on the effects of the real exchange rate on the labor force is presented. In chapter 3, the channels of influence of the real exchange rate on unemployment are summarized. In chapter 4, some stylized facts and a short history of the Turkish economy are given. Chapter 5 presents the empirical modeling, i.e., the
background of the data, estimation and the results. Finally, in chapter 6, the conclusion of this study is provided
CHAPTER 2
LITERATURE SURVEY ON THE EFFECTS OF EXCHANGE
RATES ON THE LABOR MARKET
In this section, we discuss the effects of the exchange rate on the labor market. Earlier research dealing with the relationship between the exchange rate and employment was published by Branson and Love (1988) and Revenga (1992). Branson and Love (1988) analyzed the influence of the real exchange rate on manufacturing employment over the period 1970-1986 in the U.S. and Japan. They conclude that both appreciation and depreciations in the exchange rate significantly affect employment and output in these countries, in the durable goods sector. Revenga (1992) studies the effect of competitiveness on U.S. manufacturing employment over the period 1977-1981. Her results indicate that over-appreciation of the exchange rate between 1980 and 1985 led to a decreased in employment, especially in industries in the more competitive import sectors.1
Burgess and Knetter (1998) analyze the reaction of manufacturing industry employment to changes in the real exchange rate at industry level across G-7
countries2. According to them, there are two important trends that marked the developments in the labor markets of industrialized countries in the 1980s and early 1990s: the share of jobs in the manufacturing sector decreased and wage inequalities among workers with different skills increased. They set out two main reasons explaining those trends: technological change biased towards skills and increasing integration in the manufactured goods market. However, there is no consensus on the relative contributions of technology and trade to the labor market in the industrialized economies. Their most favorable finding is that an appreciation in the real exchange rate decreases employment because it reduces aggregate demand, and hence domestic output, by decreasing the relative prices of foreign goods. However, Burgess and Knetter (1998) go further to examine the effects of the real exchange rate on manufacturing industry employment. Their argument is that both the market structure and the regulation of international trade and the labor market determine the real exchange rate elasticity of employment and the speed of adjustments to exchange rate shocks. The more market power an industry has, the more insulated the real exchange rate on employment in that industry will be. This could be due to product differentiation since domestic goods may not have foreign substitutes. Similarly, tighter regulations on trade and the labor market would provide more protection for the industry against exchange rate shocks. In addition to the effect of the real exchange rate on employment, Burgess and Knetter (1998) further show that U.K. employment is more sensitive to exchange rate shocks than U.S. employment, which is much more sensitive than German or Japanese industry employment in country comparisons. This is explained by the trade regulatory policies of the countries.
Gourinchas (1998) studied the effect of exchange rates on employment using a VAR model in which the endogeneity of exchange rates is considered. However, that study did not include the trade structures as a channel.
Campa and Goldberg (2001) considered openness3 and imported intermediate goods to analyze the relationship between the real exchange rate and employment, wages and overtime activity in the U.S. manufacturing industry over the period 1972-1995. Their results indicate a significant effect of the exchange rate on the number of jobs and employment although it is very weak. They also present two important characteristics of industry that are connected to the relative importance of exchange rates: the response of low-markup industries is more significant than that of high-markup industries and industries where there are more high skilled workers have a lower exchange rate elasticity of employment. They claim that the effect of the exchange rate depends on industry structure because a sector with a weak ability to react to exchange rate changes is affected more.4 In addition, export orientation5 increases the sensitivity of labor demand and more intensive use of imported inputs has an ambiguous response depending on the structure of production activity. In addition, they show that trade structure is also a very important factor in the determination of the effect of the real exchange rate on employment. Their model also takes into consideration three channels through which the real exchange rate affects employment: export
3 By openness, we mean the sum of the export orientation ratio and import penetration ratio. 4 Industry response to the exchange rate across international markets are more sensitive in low price-over-cost markup industries. Campa and Golberg (1995) verify investment responses across countries.
orientation, import penetration6 and imported inputs. Due to the high correlation between imported inputs and import penetration, their estimation contains only export orientation and imported inputs. Their study did not take the endogeneity of exchange rates into account. They argue that changes in exchange rates influence overtime work hours instead of employment or job creation in high-markup industries and industries with higher proportion of skilled workers in their labor force.
Faria and Leon-Ledesma (2004) scrutinized the long-run impact of real wages, real interest rates and real exchange rate on employment in the U.K. and U.S. using Turnovsky’s (1995) open economy version of the standard intertemporal labor supply model. The main idea is that workers adjust their labor supply comparing actual and expected future real wages. They claim that a depreciation in the real exchange rate increases the present value of financial wealth that is accumulated in foreign bonds. This means a positive income effect which creates an ambiguous effect on employment because the workers either decrease labor supply since they can keep the same level of utility by working fewer hours or increase labor supply to take advantage of the higher income to increase future consumption. They prove that the real exchange rate has a negative and significant effect on employment, which means that an appreciation in the real exchange rate decreases the employment rate in the U.S.
6 What we mean by import penetration is the relative share of imports in the supply of goods available for domestic consumption. Import penetration expresses imports as a percentage of domestic supply,
Kim and Kinal (2004) analyzed the relationship between the real exchange rate and employment using a panel of 28 industries in Korea, Malaysia and the Philippines from 1970 to the 1990s. They employed a panel VAR based on the model described by Campa and Goldberg (2001), in which the adjustment costs are involved in changing the level of domestic labor. They also scrutinized three channels: export orientation, imports penetration and imported inputs taking the endogeneity of exchange rates into consideration. Their results shows that Korean and Malaysian employment responded positively to real exchange rate shocks and in the Philippines employment responded positively only after 1985. The main conclusion of their paper is that exchange rates are very important in explaining the change in employment, especially in the long run for those three countries.
Filiztekin (2004) analyzed the effect of the exchange rate on manufacturing employment in Turkey over the period 1981-1999 and the channels through which the exchange rate affects employment. He used a model that decomposes the effect of exchange rates on the labor market into revenue and cost channels similar to the one used by Campa and Goldberg (2001). Similar to Campa and Goldberg (2001), Filiztekin was unable to identify the import penetration channel and imported inputs channel independently because of the high correlation between them. Contrary to previous results, he found that although a depreciation in the domestic currency increases the competitiveness in international markets, the net effect of a devaluation on employment is negative in given periods in the respective country. His point is that a depreciation in the exchange rate increases domestic demand and hence employment assuming that aggregate demand is a function of the export orientation of firms and the import
penetration ratio of the industry in which the firm is. However, his reasoning behind the net result is the high dependency of Turkish manufacturing industries on foreign inputs. Higher dependency on imported inputs causes sensitivity to exchange rate shocks in Turkey. Filiztekin (2004) stated that after 1980 the trade volume of Turkish manufacturing rapidly increased. In addition, exchange rates increased dramatically. Although there was a huge increase in the openness of the manufacturing sector, its import structure did not undergo a significant change: Turkey is highly dependent on foreign inputs since the imported capital and intermediate goods comprise a significant portion of imports.
Hatemi and Manuchehr (2006) investigated the relationship between the real exchange rate and employment at industry level in France in the long-run over the periods 1975-1999. They found that the industry in France is quite sensitive to changes in the real exchange rate according to panel unit roots and panel cointegration analysis. In their paper, they draw on the conjectures by Burgess and Dolado (1989) and Burgess and Knetter (1998). The results reveal that the real exchange rate influenced employment in an expected manner, i.e. a depreciation in real exchange rates increases employment and stimulates manufacturing for all industries in their sample. To examine the response of employment to the real exchange rate they applied the asymptotic theory of panel cointegration. Their study was the first attempt in this field to test the real exchange rate elasticity of employment using panel unit root and panel cointegration techniques.
Galindo, Izquierdo and Montero (2006) analyzed whether the real exchange rate has a significant effect on industrial employment and whether the effect changes with trade openness and liability dollarization. They used a panel of 9 Latin American countries7 whose liability dollarization data are available. Their results show that real exchange rate depreciation can affect the growth of employment positively especially in industries with a higher export orientation; however, the situation is reversed if liability dollarization increases in the economy, and the effect may even be negative. Their study is based on the theoretical model derived by Campa and Goldberg (2001) where Galindo, Izquierdo and Montero (2006) extended the context by including the additional channel of balance sheet effects. They argue that equilibrium employment is affected by a shock, i.e. the effect of the real exchange rate on employment is increasing in export orientation industries and home market import penetration, however, it is unclear in industries, using mostly imported inputs. According to their explanation, in the balance sheet channel, a real exchange rate shock to debt service may result in a collapse in industries with high foreign currency denominated liability, and hence harm their solvency. As a result those industries would decrease employment.
Klein, Scott and Triest (2000) tried to identify labor adjustment costs due to trade by estimating the effects of the real exchange rate on labor reallocation. They used a new model of industry level employment dynamics characterized by job creation and job destruction at firms for U.S. manufacturing industries over the period 1973-1993. According to them, the real exchange rate affects
employment either by altering relative prices of internationally traded goods or by generating a wide range of responses within the industries due to difference in trade patterns across industries. They decompose the real exchange rate into trend and cyclical parts and their results show that the trend of the real exchange rate influences both job creation and job destruction in the same direction by similar magnitudes hence the net effect on employment is zero. Appreciation in the cyclical real exchange rate decreases employment only by increasing job destruction. They underline the fact that the impact of an increase in job destruction on welfare is most probably greater than that of a decrease in job creation.
Finally, in Frenkel (2004) the relationship between the real exchange rate and employment in four Latin American countries, Argentina, Brazil, Chile and Mexico, was analyzed. Frenkel argues that the real exchange rate affects employment via three channels: the macroeconomic channel which means the role of the real exchange rate on the determination of output activity level; the development channel, which is the effect of the real exchange rate on economic growth rate in the long run and the labor intensity channel which is similar to the imported inputs channel in the literature, i.e. the effect of the real exchange rate by changing the proportions of factors in the production of output. A model was estimated relating the unemployment rate with output and the real exchange rate level. The results of the paper do not reject the hypothesis of the influence of the real exchange rate on unemployment and Frenkel argues that for these four Latin American countries in the event of a depreciation in the real exchange rate the net effect of the macroeconomic and development channel is positive, meaning that
the real exchange rate increases the level and growth rate of output, and hence unemployment decreases. In addition, via the labor intensity channel, a depreciation means the switching of capital to labor in the production of output.
In the next section, the channels by which the real exchange rate influences unemployment rates are discussed.
CHAPTER 3
THE CHANNELS OF INFLUENCE OF THE REAL
EXCHANGE RATE ON UNEMPLOYMENT
In the previous chapter, we summarized the channels by which the real exchange rate influences employment in the literature as export orientation, import penetration and imported inputs. However, in our search for an alternative way of linking the real exchange rate with unemployment, we follow the systematic classification given by Frenkel (2004) which separates real exchange rate influence mechanisms on unemployment into three channels; the macroeconomic channel, the development channel and the labor intensity channel. The macroeconomic channel is the short run influence of the real exchange rate on unemployment through the determination of output level. The development channel is the effect of the real exchange rate on the growth rate of output in the long run which also engenders the creation of new work areas. The labor intensity channel focuses on the influence of the real exchange rate on the intensity of labor in the production process of given level of output by affecting the relative use of capital and labor through their production costs. To the best of our knowledge, although there have been some previous studies involving empirical examination
of macroeconomic and development channels, these channels have never been investigated empirically in the context of the Turkish economy.
3.1 The Macroeconomic Channel
Before the Great Depression, economic theory assumed that the market mechanism worked perfectly and it kept the market in a continuous equilibrium. Hence, it assumed a-priori full employment. However, the macroeconomic theory, which was born out of the insufficiency of the ongoing theory’s explanationof the Great Depression and its consequences, recognized the relationship between the real exchange rate and employment. Keynesian thought asserted that the free market mechanism cannot achieve full employment and equilibrium unless it is by coincidence. Therefore, Keynesians claimed that undesirable unemployment always exists. Referring to this system, a ceteris paribus depreciation in the real exchange rate increases the competitiveness of the country in the international market, because the comparative price of a good in the domestic market is cheaper than it is in the international market. Therefore, foreigners demand domestic goods more and the country’s citizens demand foreign goods less. This means that exports increase and imports decrease, and thus aggregate demand increases in the country. Higher aggregate demand creates excess demand in the market, which causes firms to run out of stock. To increase profits, firms expand their production. More production requires more labor. Consequently, unemployment decreases. Similarly, in the case of an appreciation, exports decrease and imports increase, which decreases output and hence employment.
Frenkel (2004) claims that the macroeconomic channel involve a ceteris paribus change in the real exchange rate in a comparative static analysis. Although this effect generally can be found, in a developing country, with many political, sociological and economic problems, like in the case of Turkey, a change in the real exchange rate may have many complicated and confusing results. The final outcome will be determined by the real and the financial structure of Turkey and the particular conjuncture of the economy during that period of interest when the change in the real exchange rate occurred or was implemented. Nevertheless, for the major expected effects to take place other simultaneous counter effects should not be predominant.
Frenkel (2004) argues that idle capacity is taken as given in the first analyses of devaluation. However, when devaluation was included in IMF programs the focus turned to the balance of payment. A balance of payments deficit was attributed to excess demand, which means that full employment was achieved. This is certainly not true for Turkey given the fact that, one of the serious problems of the Turkish economy is unemployment. Indeed, during the period 1980-2006, the unemployment rate ranged from 6.5 to 10.3 percent, which implies that the amount of idle capacity in Turkey is quite high.
The macroeconomic mechanism concerning the contractive effects of devaluation is recognized by Diaz (1963) and Krugman and Taylor (1979): Firstly, since exports increase and imports decrease in response to a devaluation, net exports will increase as well. All other things constant, this raises price
through the increase in aggregate demand and hence engenders a fall in the value of real balances, which will again decrease equilibrium output. Secondly, income will be redistributed towards higher saving propensity sectors, which will decrease investment and consumption and hence aggregate demand. In addition, it may create a negative welfare effect on debtors in international currency greater than the positive effect on international currency asset holders. However, as Frenkel (2004) denotes, the potential contractive effects of devaluation do not contradict the negative relation between the real exchange rate and unemployment. As one can observe, there are two effects beyond devaluation: contractive effects and expenditure-switching effects. Both effects overlap with each other. In addition, the duration of the two effects differ too. Various influences of contractions, like those on investment in Turkey, may last longer.
3.2 The Development Channel
As mentioned in the section of stylized facts, one of the important facts about unemployment in Turkey is that the creation of new jobs is more crucial than the destruction of jobs. Frenkel (2004) and Frenkel and Rapetti (2007) define the development channel as “the influence of real exchange rate on economic growth and consequently on the speed of new jobs creation”.
To give a detailed explanation for this channel, we will follow the methodology set out by Frenkel (2004), which takes Woo (2004), who scrutinized industrial policies, as a reference. Woo (2004) analyzed “import substitution
industrialization” and “export promotion industrialization” strategies and free trade. Woo denotes the relative price of exports and imports as follows:
EQ - 1: (1 ) (1 ) W M M W E E P P t P P s + = +
where PM is the home country price of imports, PE is the home country price of exports, PMW is the world price of imports, PEW is the world price of exports, t is the effective tariff rate and s is the effective subsidy rate.
Before we examine Woo’s analysis, it is important to define import substitution industrialization and export promotion industrialization strategies. Import substitution is substituting the imported goods with goods produced in the home country in order to meet the domestic demand8. Contrary to the import substitution industrialization strategy, the export promotion industrialization strategy promotes only the industries that have the potential to develop and compete in international markets9.
According to the classification given by Woo, for an economy to implement import substitution industrialization, it must set an effective tariff rate that is positive and greater than the effective subsidy rate, i.e. t>s and t>0. Hence,
W M M
W E E
P P
P 〉 P , which means that import substitution industrialization strategies
encourage import substitution by distorting prices towards the production of importables against imported goods.
Woo defines export promotion industrialization strategies by setting an effective subsidy rate that is positive and equal to the effective tariff rate, i.e. t=s>0. In this case, W M M W E E P P
P = P which means that the result of the export promotion industrialization strategy appears to be similar to that in a free trade setting, i.e. t=s=0. However, Woo rejects this argument. According to Woo’s analysis, when export promotion industrialization strategies are implemented although relative price distortion is not the case between exports and imports, the relative prices distorts towards the production of tradable goods against production of non-tradable goods. He supports his argument as follows:
(1 )
T E M
P =εP + −ε P , which is the price of tradable goods where e is the weight of
exports in total trade. W W (1 ) W
T E M
P =εP + −ε P , which is the world price of tradable goods. PN is the price of non-tradable goods. Woo argues that in an export promotion industrialization strategy EPI (1 ) W (1 ) W
T T T
P = +s P = +t P . Hence,
when an export promotion industrialization strategy is
implemented (1 ) EPI W T T N N P t P P P +
= , whereas in a free trade setting
FT W T T N N P P P = P . Hence, EPI FT T T
P 〉P , where the relative price is distorted towards tradables.
For import substitution strategies, the domestic price of tradables is as
follows: ISI (1 ) W (1 )(1 ) W
T E M
price of tradables are smaller than this value: (1 ) (1 )(1 ) ISI W W T E M N N P s P t P P P ε + + −ε +
= which is greater than
FT W T T
N N
P P
P = P .
Frenkel (2004) claims that Woo’s characterization of export promotion industrialization strategies is similar to a real exchange rate depreciation in terms of the results. The effect of the depreciation of the Turkish Lira, for instance, is equivalent to the effect of an export promotion industrialization strategy, which means a uniform tariff on imports and uniform subsidy on exports of the same amount. A depreciation in the real exchange rate distorts the relative prices towards production of tradables against non-tradable activities; this creates an effect equivalent to that of an export promotion industrialization strategy where both protection to local activities from imports and support to competitiveness of exports are provided. Although it is not mentioned in the literature, theoretically import substitution industrialization strategy’s results also show similarities to export promotion industrialization result. Mathematically, the relative price of tradables versus non tradables distorts in favor of tradables. However, there is no argument in theory that links the effects of imports substitution strategies to the changes in real exchange rates.
3.3 The Labor Intensity Channel
Following Frenkel’s (2004) explanation, the labor intensity channel is the real exchange rate’s channel of effect on unemployment by changing the
intensities of the production factors of the output. The real exchange rate determines the relative prices of capital and labor. In the first two channels, the real exchange rate affects unemployment by changing the output level. However, in this channel the real exchange rate only affects the labor intensity in the output.
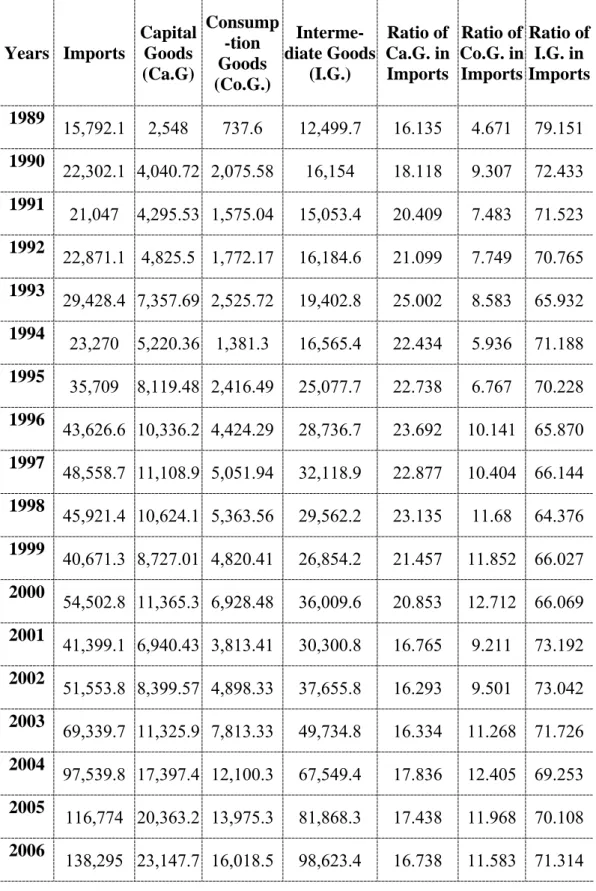
As Frenkel (2004) argues, the real exchange rate is an important determinant of the relative price of labor/capital goods in developing countries including Turkey, because a significant part of imported components are capital goods and intermediate goods used in the production of output. This can be seen from the trade figures for Turkey. Intermediate goods comprise the major part of imports. The proportion of intermediate goods to total imports was around 70-79 percent at the beginning of the 1990s. It decreased to 65-70 percent in the first half of the 1990s, was rather stable at around 64-66 percent in the second half of the 1990s, and then increased to 70-73 percent at the beginning of the 2000s which are very high values (See Table 1, Column 8). In addition, the real exchange rate also affects the relative price of imported capital goods/labor ratio and the wages in international currency. We can see that the portion of imported goods to total imports varied between 16and 25 percent during the period 1989-2006, which is smaller than that of intermediate goods but still significantly high (See Table 1 Column 6). As a whole, a real change in exchange rates changes the employment/output rate because of the changes in the relative prices mentioned above.
TABLE 1: Turkish Imports Regarding the Types of Goods10 Years Imports Capital Goods (Ca.G) Consump -tion Goods (Co.G.) Interme- diate Goods (I.G.) Ratio of Ca.G. in Imports Ratio of Co.G. in Imports Ratio of I.G. in Imports 1989 15,792.1 2,548 737.6 12,499.7 16.135 4.671 79.151 1990 22,302.1 4,040.72 2,075.58 16,154 18.118 9.307 72.433 1991 21,047 4,295.53 1,575.04 15,053.4 20.409 7.483 71.523 1992 22,871.1 4,825.5 1,772.17 16,184.6 21.099 7.749 70.765 1993 29,428.4 7,357.69 2,525.72 19,402.8 25.002 8.583 65.932 1994 23,270 5,220.36 1,381.3 16,565.4 22.434 5.936 71.188 1995 35,709 8,119.48 2,416.49 25,077.7 22.738 6.767 70.228 1996 43,626.6 10,336.2 4,424.29 28,736.7 23.692 10.141 65.870 1997 48,558.7 11,108.9 5,051.94 32,118.9 22.877 10.404 66.144 1998 45,921.4 10,624.1 5,363.56 29,562.2 23.135 11.68 64.376 1999 40,671.3 8,727.01 4,820.41 26,854.2 21.457 11.852 66.027 2000 54,502.8 11,365.3 6,928.48 36,009.6 20.853 12.712 66.069 2001 41,399.1 6,940.43 3,813.41 30,300.8 16.765 9.211 73.192 2002 51,553.8 8,399.57 4,898.33 37,655.8 16.293 9.501 73.042 2003 69,339.7 11,325.9 7,813.33 49,734.8 16.334 11.268 71.726 2004 97,539.8 17,397.4 12,100.3 67,549.4 17.836 12.405 69.253 2005 116,774 20,363.2 13,975.3 81,868.3 17.438 11.968 70.108 2006 138,295 23,147.7 16,018.5 98,623.4 16.738 11.583 71.314 10
Frenkel (2004) argues that any change in the real exchange rate affects relative prices. Firms will restructure the organization of production, change their production basket and/or change the structure of their output to adapt to this new set of prices. Certainly, this is not a short run effect since the whole economy adapts to the new set of prices via structural change. Following the development channel, a depreciation in the real exchange rate stimulates tradable sectors that were not competitive before. In addition, it increases the relative price of imported capitals and intermediate goods used in production, which increases substitution to labor in the production of output. An appreciation of real exchange rate may lead to some firms going out of business but surviving firms decreases the amount of labor (since its relative price increased) involved in production to achieve competitiveness. Moreover, a real exchange rate change affects the non-tradable sector as well. Although international competition is not a concern in non-tradable sectors, if the non-tradable sector uses capital goods that have a high import portion, imported capital goods and intermediate goods used in capital goods affect non-tradables as well. Hence, depreciation causes a shift in prices in favor of capital goods, which cause non-tradable sectors to increase labor, i.e. decrease the unemployment rate, to achieve competitiveness in the local market. Similarly, an appreciation of real exchange rate increases the relative price of labor against capital goods, which causes firms to decrease the amount of labor, thus increasing the unemployment rate.
CHAPTER 4
STYLIZED FACTS CONCERNING THE TURKISH
ECONOMY
Turkey experienced many structural reforms in the social, political and economic arena after the proclamation of the republic in 1923. The Turkish economy overcame many bottlenecks and dealt with many crises afterwards, such as 1980, 1994, and 2000-2001 crises. Inflation, high interest rates and changes in the money standards became the main concerns in the world after the 1960s and in the search for solutions to the crises that occurred, the 1970s brought the “New World Order”, and the 1980s brought “solutions in the liberal economic system”, namely globalization. In accordance to these changes, many countries experienced periods of financial liberalization and large speculative capital movements took place. As a way out of crises, financial liberalization did not perform well in economic stagnation but engendered worldwide depressions like those in the Middle East, Russia, Mexico, and Argentina in the last decade. An examination of Turkey during the liberalization period (like any other countries that experienced liberalization) reveals that the economy became fragile to external shocks. This fragility is due to the short-term entrance of speculative capital into the economy.
The financial change in Turkey started with 1980 Stabilization Package to deal with the balance of payment difficulties in the economy created in the 1970’s and the disequilibrium in the markets. The package’s aims were to clear the disequilibrium in the foreign and domestic markets and to build up the institutional basis for the liberalization process. The main measures were taken to increase foreign currency income, liberalize imports, provide an environment for equilibrium in the markets, increase foreign investment, etc.
With those measures taken, in 1980 the government devalued the Turkish Lira against the dollar at about 33 percent increasing the exchange rate. After July 198111, it was decided to set the exchange rate on a daily basis (and the Turkish Lira was continuously devalued in real terms until 1989). The permitted limit on foreign exchange held by exporters increased. The government established a fund to support exports and gave credits to exporters. As a result of these measures, exports tripled and brought in a large amount of foreign currency. One of the important measures of the 24 January Package concerned the goods market: the equilibrium price was left to be set by the market mechanism. In addition, to increase foreign investments the Law on Encouraging Foreign Investments was passed. The permission limit on foreign investment was increased.
The first steps taken in the liberalization process were the abandonment of the restrictions on the interest rates of the banks and afterwards on all interest rates in 1981. After that, entrance to the banking sector was eased. This stimulated competition in the sector and decreased the share of individual banks since the
share of the sector was constant. In 1982, Turkey experienced a major crisis, namely the Banker Crises. The foundation of this crisis was laid at the end of the 1970s with a law that brought some restrictions on the interest rates of credits to the banks. This drove banks to collaborate with people who worked with interest rates outside the market interest rates called “bankers”. Bankers were intermediary between the banks and the capital market instead of being intermediary between demand and supply of the bonds. The interest rate war between bankers turned into “Ponzi Finance” (to finance the interest rate of borrowings by borrowing with higher interest rates). This turned out to be a disaster for the system and led to the “Banker Crises”, which undermined the financial position of the banks.
The foreign exchange rate policies were relaxed in 1984: banks were allowed to set their own exchange rates providing that it would not be 6 percent less or more than the Central Bank’s exchange rates, and 8 percent less or more than the Central Bank’s effective exchange rates. In addition, the maximum difference allowed between the exchange buying rate and exchange selling rate was 2 percent.
In 1985 the exchange rate was allowed to float freely. However, at the beginning of 1986 the Central Bank declared that banks could not set their rates 1 percent less or more than the Central Bank’s exchange rates. At the end of 1986, the exchange rate regime was revised once more: banks were allowed to determine their selling rate freely, provided that it was not higher than the Central Banks exchange rate.
The 1980 stabilization program was implemented successfully and during the period 1980- 1987 the Turkish economy showed improvement: the growth rate of GNP was -2.3 percent in 1980, +3.1 percent in 1982, +7.1 percent in 1984 and +4.3 percent in 198512
Yeldan (2001) argues that the primary descriptive reasons for the expansion and recession in the Turkish economy between 1970s and 2001 were the current account balance and the resources to finance the volume of imports. The liberalization policies in the 1980s increased Turkey’s trade volume immediately. Exports were 2.9 billion dollars in 1980 and increased to 10.2 billion dollars in 1987. The export import ratio increased from 30 percent in 1980 to 72 percent in 1987. Imports, meanwhile, increased continuously during the 1980-1987 period except for 1982 and 1986. They decreased due to the fall in oil prices in 1986. Imports increased from 7.9 billion dollars in 1982 to 14.2 billion dollars in 1987. As Selçuk (1997) argues, there are many reasons for the deterioration/amelioration of the current account: political stability, a change in the economic conditions of trade collaborating countries, world interest rates, export subsidies, import quotas, etc. However, for small economies, the most significant indicator for the current account balance and the volume of imports is the real exchange rate. Yeldan (2001) claims that there is a close synchronization between changes in the real exchange rate and the growth rate of national income. After the large devaluation in 1980, a small period of stabilization with positive growth rates was observed, during which the government continuously devaluated
the exchange rate. This favorable economic environment with a positive growth rate, real devaluation, lasted for 4 years.
The growth rate of GNP was above the target with 6.8 percent in 1986 due to the increase in domestic aggregate demand and the decrease in oil prices. This enhancement continued in 1987 and the economy grew by 9.8 percent.
To eliminate the instabilities in the economy and to provide equilibrium in the markets some precautionary measures were taken. The aim was to encourage savings in terms of the Turkish Lira, to increase demand on the Turkish Lira, to put a brake on imports, to vitalize exports, and to decrease government expenditures. With the decrease in government expenditures, public investments fell too. This affected private investments and production negatively. As a result of those events, the growth rate of real GDP was 2.1 percent in 1988. The main reason for this deterioration compared with 1987 was the decrease in the growth rates of the industrial and service sectors’ income.
As a result, after 1983, many steps were taken with regard to the exchange rate system in Turkey and most of the restrictions and prohibitions were abrogated. The first step was taken in July 1989 with Law on the Protection of the Value of the Turkish Currency. The second step was the 32nd decree, published in the Official Gazette. The resulting changes were as follows: the Turkish Lira became convertible, the domestic economy became open to international markets and the finding of financial resources from international markets was liberalized
and investors began to switch from the Turkish Lira to foreign currency, and, as a result, currency substitution became commonly used.
The seemingly successful policy implementation between 1980 and 1987 did not perform well in terms of enhancing the existing capacity and vitalization of capital stock so the Turkish economy experienced unstable growth. However, the Treasury and Central Bank of Turkey were not fast enough to carry out the necessary regulations in time and the banks approached foreign currency denominated resources without taking the rules of liquidity management into account. Hence, this made the results of 1990 Gulf Crises more severe. After the military intervention by the United Nations in Iraq, the crisis worsened and the financial sector suffered a liquidity shortage. The increase in the price of oil caused more inflation. The Central Bank was forced to bring in a large amount of foreign currency in order to meet the public demand.
In addition, the unemployment maintained its high level. In this environment, the growth rate of real GDP in 1989 was 0.2 percent. Çelik (2003) assessed these results. He argues that the negative results of the financial liberalization in the 1980s were as follows:
a. Liberalization did not increase domestic savings, but high interest rates decreased investments hence affected growth negatively. b. The instability in exchange rates and interest rates increased the
volatility of capital movements and the sensitivity of the Turkish economy to external shocks.
c. Most importantly, although financial liberalization achieved its aims, financial profundity was not achieved.
The 1990s saw financial crises all over the world. The most remarkable ones were in the European Monetary Zone in 1992-93, in Turkey and Mexico in 1994-1995, in Southeast Asia in 1997, in Russia in 1998, and Brazil in 1998-1999.
Although growth performance was weak in 1989, as a result of the increase in the agricultural sector’s output and some precautionary measures, the real GNP growth rate was 9.3 percent in 1990. With the effect of the Gulf Crisis in October 1990, imports increased as a result of the tremendous increase in oil prices. At the end of 1990, exports reached 12.9 billion dollars and imports were 22.3 billion dollars. The current account deficit rose drastically.
The 1991 Gulf War had a negative effect on the growth rate of the Turkish economy and the economy grew by 0.9 percent which was a large difference compared to 1990’s growth performance which was 9.3 percent. Tourism was one of the sectors influenced by the war. Most of the income coming from tourism declined in 1991 and the sector went into stagnation. Although Turkey received 745 million dollars in 1990 and 1785 billion dollars in 199113 in the form of an international grant due to the Gulf Crisis, the Central Bank of Turkey lost most of its reserves in the mean time. In 1991 exports increased by 4.9 percent to 13.6
13 Haber Anadolu 28.12.2001
http://www.byegm.gov.tr/YAYINLARIMIZ/HABERANADOLU/HABER-billion dollars and imports decreased by 5.6 percent to 21 http://www.byegm.gov.tr/YAYINLARIMIZ/HABERANADOLU/HABER-billion dollars. A current account surplus occurred. After these positive events the public expectations for economic performance in 1992 improved and real GDP increased by 6 percent in 1992 (See Table 2). GNP per capita increased significantly from 2708 dollars in 1992 to 3004 dollars in 1993. In addition, real GDP grew by 8 percent in 1993 (See Table 2). Yeldan (2001) mentions that the Turkish economy showed positive growth rates with a 5 - 10 percent overvalued Turkish Lira in 1983-1987. After the small stagnation in 1988, the Turkish Lira was continuously overvalued in the first half of the 1990s until the financial crash in 1994.
From the beginning of the 1990s until 1994, the ratio of domestic debt to GNP showed a rising trend. After 1990, the Central Bank of Turkey announced monetary programs and tried to hit its monetary targets.14 Moreover, the government changed the way it financed its deficits in order to decrease interest rates on domestic debts and to obtain a delay in debt payments in 1993. In addition, the debts of the Treasury were cancelled and its borrowing limit was doubled. The expectation of devaluation increased because the government preferred to use the Central Bank instead of taking on a domestic debt to finance the public deficit. Özçam (2004) argues that with the effects of the 1991 Gulf War and the financing of the public debt by the Central Banks resources monetary expansion increased and it became hard to cope with liquidity and the balance sheet of the Central Bank. Hence, the demand for foreign currency increased and created a large gap between the official exchange rate and market exchange rates. As a result, these events increased the imbalances and created pessimistic
expectations.15 As Özatay (2000), implies the 1994 crisis is a very clear political mistake. The reduction in interest rates decreased the demand for domestic government bonds and harmed the bond market seriously. The liquidity in the market was directed to foreign currency and this increased the demand for it, which put pressure on the foreign exchange market.
In the first quarter of 1994, the Turkish Lira was devalued by 70 percent and overnight interest rates skyrocketed to 700 percent. The economy suffered a liquidity crisis and the market went into imbalance. Therefore, the April 5 Stabilization Package was announced to ensure balance and stability in the exchange and financial markets and to decrease inflation in the short run. In the medium run, the package aimed to find a permanent solution to budget and current account deficits, which were the primary cause of the instability, and in the long run to engender sustainable growth. After April 5 Package the Treasury increased domestic borrowing interest rates and shortened their maturity. Consequently, the difficulties with domestic borrowing continued until the end of May 1994.16
Turkey was far from successful in crisis management at the end of 1993 and beginning of 1994. The government announced that the short-run target and started to inject liquidity to the market; however, the demand for foreign currency, which was expected to decrease, increased swiftly. In addition, the high current account deficit also stimulated the expectations for devaluation, and hence the demand for foreign currency. The government planned to supply the foreign
currency demand of the market and direct it towards the Stock Market. Unfortunately, the largest banks were making their decisions according to the information that there would be a large devaluation. Hence, all the foreign currency supplied was sold with higher exchange rates and did not satisfy the market demand. In addition, the transaction volume of the Stock Exchange Market (IMKB) was 52 million dollars, which was not sufficient to absorb the speculative capital in the market. As a result, the Turkish Lira was devalued by 70 percent from January 1994 to April 1994 and the Central Bank’s international reserves decreased from 7 billion dollars to 3 billion dollars in 3 months.17 GDP decreased by 5.5 percent.
The effect of the large devaluation in 1994 can be also seen in the trade figures. Exports increased to 18.1 billion dollars and imports decreased to 22.2 billion dollars. The trade balance ameliorated by approximately 70 percent, decreasing to 4.2 billion dollars. However, this situation did not last long, due to the revival in the Turkish economy, the decline in the devaluation rate in the Turkish lira and the deterioration in the economies of OECD countries that had significant weights in trade with Turkey. The rate of increase in exports decreased in 1995 and there was a huge increase in imports. The trade balance deteriorated by nearly 215 percent. (See Table 2)
Özçam (2004) claims that, as of 1995, the Central Bank increased its control on exchange rates by targeting stability depending on the Turkish Lira’s real value although the flexible exchange rate regime was in effect. According to
this strategy, namely “devaluation as much as inflation” monthly rate targets were declared and then the nominal rate was controlled considering target inflation. Meanwhile, the Central Bank asserted control over its assets and strengthened its foreign currency reserves. Tight monetary policy resulted in high interest rates.
The growth rate of real GDP in 1995-1997 was rather stable at 7-7.5 percent. In 1996, exports increased to 32.1 billion dollars and imports increased to 42.3 billion dollars (see Table 2). Moreover, trade balance values on average were higher in 1995-1997 years than those before the 1994 crisis.
The years 1997 and 1998 witnessed two important crises that affected the whole world: the 1997 Asian Crisis and the 1998 Russian Crisis. The effects of those crises on the Turkish economy were minor. Özçam (2004) claims that this insensitivity was not only because of the sufficiency of the Central Bank’s foreign currency reserves but also because the Central Bank fulfilled both foreign and domestic currency demand of the market without any restrictions on amounts.
There was a significant change in the export import scheme in 1997 and 1998. There was a slow down in the increase of exports and imports in 1997 and there was a significant decrease in both accounts. This can be explained by the decline in the increase in world trade volume due to the 1997 Asian Crisis. The trade volume in 1998 was 4 percent, which was less than half of the rate in 1997.18 In addition, in August 1998, the ongoing global crisis struck the economy of Russia, which is an important trade partner for Turkey.
The effects of 1998 were worsened by the devastating earthquake that Turkey suffered in August 1999. GDP decreased by 4.7 percent, and exports and imports decreased to 28.8 and 39 billion dollars respectively (see Table 2).
Following the 1999 elections, several reforms in social security, the economy and the social field were made. Plans were drawn up to establish the Banking Regulation and Supervision Agency to be responsible for regulating the banking sector. The main aim was to minimize political interventions in the economy. In addition to this aim, Turkey set out a new three year economic program under the supervision of the IMF in December 1999. The IMF both designed and supported the program financially with a net $20.6 billion in 1999-2002. The aim of the program was a single digit inflation rate by the end of 2002 (Pamukçu, Yeldan (2005)). The program relied exclusively on a crawling peg exchange rate regime for disinflation. The regime was working on the basis of a currency board. As Özçam (2004) mentions, according to the stand-by agreement, the exchange rate basket was $1+€0.77 whose values were going to be declared in advance by the Central Bank of Turkey. The Central Bank was obliged to declared daily real exchange rate values. The annual increase in the exchange rate was projected to be 20 percent, which was parallel to the projected increase in the wholesale price index for 2000.
The Banking Regulation and Supervision Agency started to scrutinize the banks in the Fund; however, it was not fast enough to intervene in the accumulation of risk in the balance sheet of the banks. Therefore, the overnight
interest rates started to increase and the stock exchange decreased in November 2000. Due to the sensitivity after the Argentina crisis, foreign investments fled and Demirbank, which held most of its assets as domestic government bonds, suffered a liquidity shortage. Demirbank traded them on the market, which caused the interest rates of the domestic government bonds to increase. The other banks in the sector cancelled their buying- selling limits with Demirbank. As a result of this environment of panic, the supply of government bonds increased and the demand for foreign currency boomed. With the anxiety caused by these events, the banks cancelled all buying-selling limits between each other. Foreign investments exited the market. “More than six billion USD of short-term capital fled the country, creating a severe liquidity shortage and sky-rocketing interest rates.”19 The overnight interest rates rose to 250percent. The Central Bank of Turkey declared that it would only fund the market in exchange for foreign currency. However, it was able to keep its promise for only one day.
The November 2000 crisis was a financial banking crisis. According to Özçam (2004), although the main reason for the crisis seemed to be a liquidity shortage due to insufficient foreign currency entering the to economy (after the increase of interest rates), there were reasons behind the crisis that caused this shortage, like the insufficient decrease in inflation, high oil prices, the high fund needs of public banks, privatization and other slowdowns in the structural reforms. Despite the tight policies in effect, the structural measures did not eventuate as fast as expected. This lowered the reliability of the program and increased the rate of interest on domestic borrowing. Hence, the liquidity demand
of the banks whose assets were composed mostly of government bonds was one of the reasons triggering the November 2000 crisis. (Celasun, 2002)
After the November 2000 crisis, the Banking Regulation and Supervision Agency did not intervene in the risk accumulation of the banks in the fund immediately, and hence overnight interest rates started to rise in November 2000. The Stock Market went down and foreign investor began to withdraw their investments from the market. One of the stranded banks, Demirbank, due to the liquidity shortage tried to dump the domestic government bonds. Therefore, the market interest rates increased and other banks cancelled the interbank limits for market transactions. With the anxiety caused by these events, demand for foreign currency boomed and the Central Bank announced that it had stopped supporting the market and it was only exchanging domestic currency with foreign currency. However, the Central Bank was forced to support the market just one day after this announcement due to the serious liquidity shortage in the market. The systematic crisis in November 2000 aroused suspicion about the current economic program and stimulated the banks to close their open positions by acquiring foreign currency. This in turn created exchange rate risk and engendered the February 2001 Crisis which is popularly known as Black Wednesday. The tight monetary policy used over the previous 14 months was revised and the government switched its exchange rate policy from “currency peg” to “dirty float”. The overnight interest rates hit 5000 percent on 21 February 2001. Already fragile due to the November 2000 crisis, the banking sector faced collapse since the interbank payment system broke down. The Turkish Lira swiftly depreciated
by 39 percent from 688,696 TL/$ to 962,499 TL/$ in just one night20. The environment of uncertainty resulted in a decrease in the growth rate of GDP. GDP decreased by 7.5 percent from 118,789.1 to 109,885.3 TL. The effects of the crisis were long lasting. Many people lost their jobs and many businesses closed. The total number of unemployed people was 1,409,000 in the fourth quarter of 2000, increased by 32.6 percent to 1,869,000 at the end of the first quarter of 2001 and skyrocketed by 70.6 percent to 2,404,000 at the end of the fourth quarter of 2001.21
These two crises were different in nature from 1994 crisis: they resulted in an economic environment where a stability program based on exchange rate was in effect (Özatay and Sak, 2002). After the November 2000 and February 2001 crises, the crawling peg system was abandoned and a flexible exchange rate system was implemented. In the “Transition to a Strong Economy Program” that was announced on 15 May 2001, the government emphasized that it would not intervene in the exchange rate except for in the event of large fluctuations. In addition, the Central Bank was made independent of political authority in October 2001, which increased the credibility of the Turkish government.
In the current economic program, the Central Bank uses interest rates as monetary policy tool under a flexible exchange rate regime to achieve price stability. Since 2001, the Central Bank has implemented implicit inflation targeting.22
20 Central Bank of Turkey, Electronic Data Delivery System, 2007 21www.tuik.gov.tr, Labor Force Statistics, 2007
With the 2002 elections, the AKP rose to prominence with a parliamentary majority and continued the adjustment period for the EU membership process with the IMF. In 2002, the growth rate of GDP was 7.9 percent. The growth rate of exports increased from 13 percent in 2001 to 17 percent in 2002. In 2002 exports were 40.1 billion dollars and imports were 47.4 billion dollars. Imports in 2002 were still lower than the value of the post 2000 crisis (See Table 2).
In 2003, real GDP grew by 5.8 percent. This was also an impressive year for trade accounts. Exports increased by 27 percent to 51.2 billion dollars and imports increased by 38 percent to 65.2 billion dollars, which deteriorated the trade balance to 14 billion dollars (See Table 2). Similar movements were recorded in 2004-2006. Growth rates of GDP, exports and imports were positive throughout the post-2001 period. According to Pamukçu and Yeldan (2005), the growth path of Turkey after the 2001 crisis was unstable and inconsistent although rapid. They identify two characteristic of growth in the Turkish economy: it is driven by inflows of speculative money, and it can not accompany a decrease in the unemployment rate which is called jobless growth.
To make an overall comment on real exchange rates, Yeldan and Özlale (2002) proved that from the 1994 crisis to the beginning of 1998 the Turkish Lira remained mostly overvalued. After then to the end of 1999, the Turkish Lira was observed to be undervalued. With the IMF stand-by agreement in December 1999, the currency was targeted for disinflation. Yeldan and Özlale (2002) found
that the Turkish Lira was structurally overvalued until April 2000 and after that it was structurally undervalued.
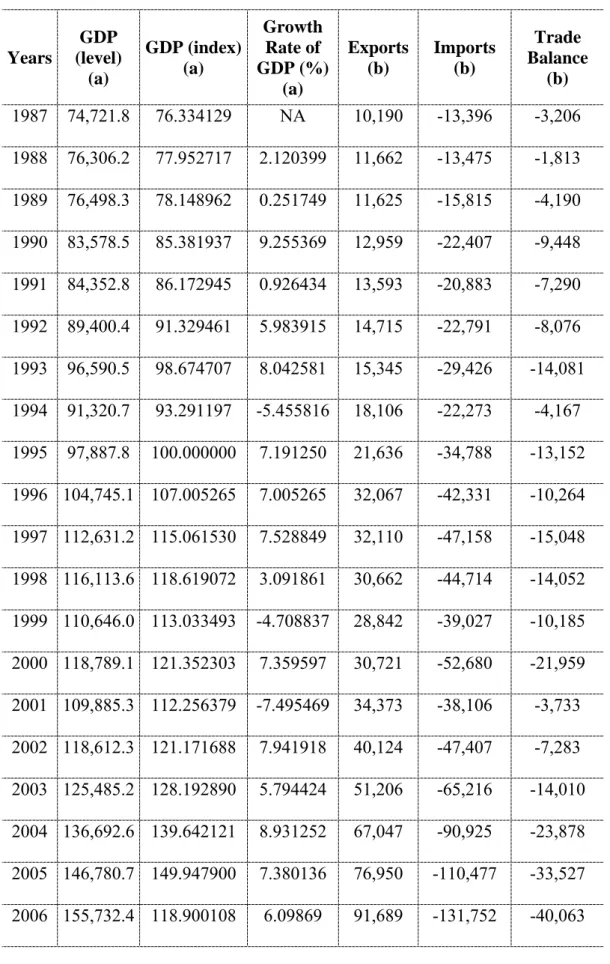
TABLE 2: Real GDP, GDP Index and Trade Indices Years GDP (level) (a) GDP (index) (a) Growth Rate of GDP (%) (a) Exports (b) Imports (b) Trade Balance (b) 1987 74,721.8 76.334129 NA 10,190 -13,396 -3,206 1988 76,306.2 77.952717 2.120399 11,662 -13,475 -1,813 1989 76,498.3 78.148962 0.251749 11,625 -15,815 -4,190 1990 83,578.5 85.381937 9.255369 12,959 -22,407 -9,448 1991 84,352.8 86.172945 0.926434 13,593 -20,883 -7,290 1992 89,400.4 91.329461 5.983915 14,715 -22,791 -8,076 1993 96,590.5 98.674707 8.042581 15,345 -29,426 -14,081 1994 91,320.7 93.291197 -5.455816 18,106 -22,273 -4,167 1995 97,887.8 100.000000 7.191250 21,636 -34,788 -13,152 1996 104,745.1 107.005265 7.005265 32,067 -42,331 -10,264 1997 112,631.2 115.061530 7.528849 32,110 -47,158 -15,048 1998 116,113.6 118.619072 3.091861 30,662 -44,714 -14,052 1999 110,646.0 113.033493 -4.708837 28,842 -39,027 -10,185 2000 118,789.1 121.352303 7.359597 30,721 -52,680 -21,959 2001 109,885.3 112.256379 -7.495469 34,373 -38,106 -3,733 2002 118,612.3 121.171688 7.941918 40,124 -47,407 -7,283 2003 125,485.2 128.192890 5.794424 51,206 -65,216 -14,010 2004 136,692.6 139.642121 8.931252 67,047 -90,925 -23,878 2005 146,780.7 149.947900 7.380136 76,950 -110,477 -33,527 2006 155,732.4 118.900108 6.09869 91,689 -131,752 -40,063
(a) At constant 1987 prices, annual data, CB of Turkey
4.1 Employment, Unemployment and Related Policies Implemented In Turkey
4.1.1 Employment and Unemployment in Turkey
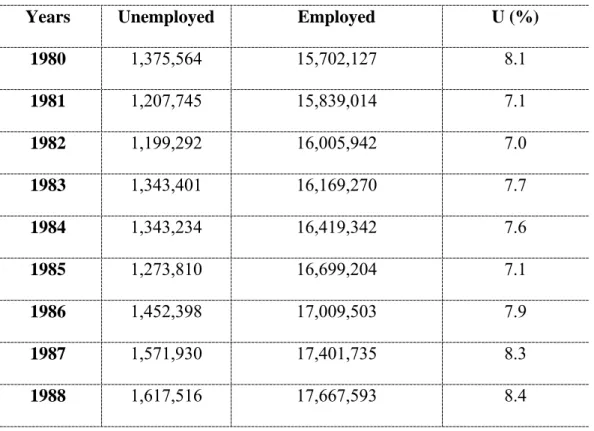
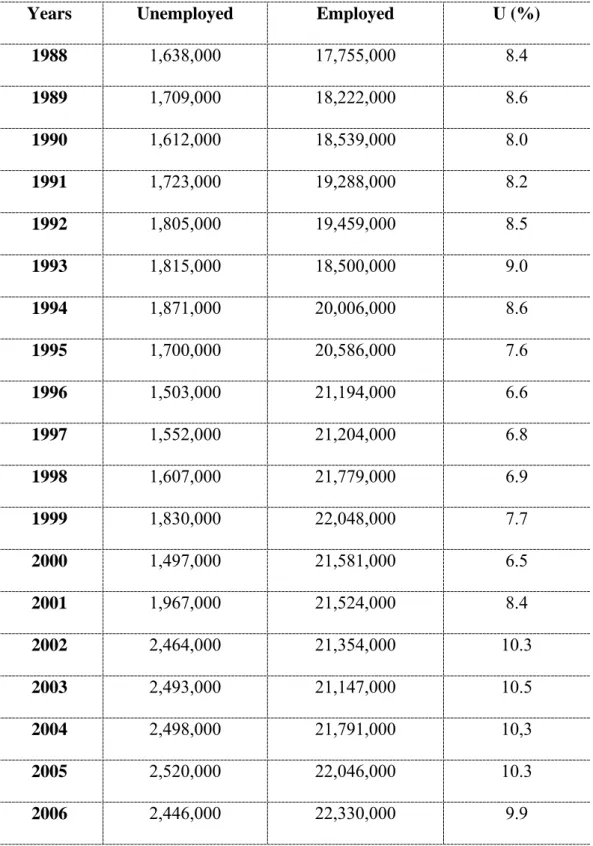
One of the most important problems common to all countries is unemployment. Unemployment decreases income and creates inequalities in income distribution. People suffer a loss of skills and capacities when they remain unemployed for a long time. Unemployment levels rose tremendously in the 1980s. Since then unemployment became one of the dominant problems of the Turkish economy. For Labor Force Statistics we can analyze 1988-2006 data from TURKSTAT’s Labor Force Surveys. Bulutay (1995) collected the unemployment figures for the pre-1988 Labor Force Survey given below. The figures are not quite as reliable as those of the post-1988 Labor Force Survey both because the definitions in the Labor Force Survey changed in 1988 and because the way they were collected was not appropriate; however, they are given here to provide a better understanding of the structure of labor force figures in 1980-1988:
TABLE 3: Labor Force Statistics for the pre-1988 Labor Force Survey23
Years Unemployed Employed U (%)
1980 1,375,564 15,702,127 8.1 1981 1,207,745 15,839,014 7.1 1982 1,199,292 16,005,942 7.0 1983 1,343,401 16,169,270 7.7 1984 1,343,234 16,419,342 7.6 1985 1,273,810 16,699,204 7.1 1986 1,452,398 17,009,503 7.9 1987 1,571,930 17,401,735 8.3 1988 1,617,516 17,667,593 8.4
During the 1980- 1988 period, unemployment showed a rather consistent trend in the range of 7-8.4 percent. As can be seen unemployment increased in 1980-1988 except for in 1981, 1982 and 1985. However, the number of employed people continuously increased during this period.
Some stylized facts for the Turkish population and labor force structure can be listed as following: