Role of inflammatory markers in decreasing
negative appendectomy rate: A study based
on computed tomography findings
Ebru Ozan, M.D.,1 Gökçe Kaan Ataç, M.D.,1 Kaan Alişar, M.D.,1 Aslıhan Alhan, M.D.2 1Department of Radiology, Ufuk University Faculty of Medicine, Ankara-Turkey
2Department of Statistics, Ufuk University Faculty of Arts and Sciences, Ankara-Turkey
ABSTRACT
BACKGROUND: This study aimed to investigate the role of inflammatory markers in decreasing negative appendectomy rate (NAR) based on their relation with findings of acute appendicitis (AA) on computed tomography (CT).
METHODS: Ninety-two patients who underwent CT examination with suspected AA were included. We investigated the relation between CT findings of AA and laboratory inflammatory markers and also performed receiver operating characteristic (ROC) analysis to calculate cut-off values of inflammatory markers and CT findings of AA. Appendectomy cases were re-evaluated considering cut-off values to make the operation decision and NAR was recalculated. Chi-squared test was used to compare the actual and recalculated NAR.
RESULTS: Cut-off values of appendiceal diameter, appendiceal wall thickness, and caecal wall thickness were 7.9, 2, and 2.3 mm, respectively, for the diagnosis of AA. Cut-off values of WBC , NLR, and CRP on ROC analysis were 7.47, 4.06 and 13, respectively, for the diagnosis of AA. When the actual and recalculated NAR (21.9% versus 9.1%) were compared, the difference was found to be almost significant (p=0.058).
CONCLUSION: Inflammatory markers are not sufficiently powerful on their own to accurately diagnose AA. However, particularly in equivocal cases, proposed cut-off values may be helpful for accurate diagnosis and a lower NAR can be achieved.
Keywords: Acute appendicitis; C-reactive protein; computed tomography; negative appendectomy rate; neutrophil to lymphocyte ratio. of patients.[2] Negative appendectomy rate (NAR) still
re-mains high; therefore, several appendicitis scores, inflamma-tory markers, and imaging modalities have been proposed to reduce this rate.[3–5]
Computed tomography (CT) has been reported to improve diagnostic accuracy in AA and reduce NAR.[5] On the other
hand, recent studies have investigated the diagnostic accura-cy of inflammatory markers including mean platelet volume (MPV), red cell distribution width (RDW), and neutrophil to lymphocyte ratio (NLR) in various inflammatory or infec-tious conditions including AA.[6,7] Therefore, the purpose of
our study was to investigate the role of inflammatory mark-ers including white blood cell (WBC) count, C-reactive pro-tein (CRP), MPV, RDW, and NLR, in decreasing NAR based on CT findings of AA.
MATERIALS AND METHODS
Patients who underwent CT examination for suspected AA between March 2015 and February 2016 were included. A retrospective review of all available medical records includ-Address for correspondence: Ebru Ozan, M.D.
Ufuk Üniversitesi Tıp Fakültesi, Radyoloji Anabilim Dalı, Ankara, Turkey
Tel: +90 312 - 204 40 00 E-mail: [email protected]
Qucik Response Code Ulus Travma Acil Cerrahi Derg 2017;23(6):477–482
doi: 10.5505/tjtes.2017.36605 Copyright 2017
TJTES
INTRODUCTION
Acute appendicitis (AA) is the most common acute surgical abdominal emergency; hence, appendectomy is a very com-mon emergency operation performed worldwide.[1]
Diagno-sis is usually based on the combination of initial clinical and laboratory evaluation with imaging modalities. Clinical symp-toms include periumbilical pain migrating to the right lower quadrant, nausea, and vomiting, but unfortunately, a clear clinical picture consistent with AA is found in only 50%–60%
ing laboratory, surgery, pathology, and discharge summary was performed for each patient. The study protocol was ap-proved by the institutional ethics committee, and written in-formed consent was waived.
Patients
One hundred and five adult patients (aged ≥18 years) who underwent CT examination for suspected AA were initially included. Subsequently, 13 were excluded, of whom seven pa-tients were lost to follow-up, three had unavailable or incom-plete medical records, and one and two were diagnosed with pseudomembranous colitis and non-specific colitis, respec-tively, after initial interpretations. Finally, 92 patients (43 men, 49 women, age range 18–79; mean age 40) were included. Fi-nal diagnoses based on pathological results or clinical follow-up for at least 3 months were used as the reference standard.
Imaging Technique
All CT exams were performed on a 16-row multi-detector CT scanner (Lightspeed 16, General Electric, Milwaukee, USA). Abdominal region from the diaphragm to symphysis pubis was scanned after intravenous non-ionic iodinated con-trast material injection (ioversol, Optiray 300/100, Mallinck-rodt). All patients drank 1.5 L of water mixed with 50 mL of iodinated contrast material (sodium and meglumin diatrizoat, Urografin 50 mL, Schering) 1 h before the exam. Imaging pa-rameters were 5-mm slice thickness, 1.3 pitch, 1 s of tube rotation, 120 kV, and noise index of 16. Each examination was recruited from our Picture Archiving and Communica-tion System (Centricity PACS, GE Healthcare, General Elec-tric, Milwaukee, USA) and was loaded to a workstation with three megapixel monitors (BARCO, Brussels).
Image Analysis
All CT scans were retrospectively interpreted, based on the consensus of two national board-certified radiologists with 5 and 15 years of experience in abdominal imaging, respective-ly. Radiologists knew that the patients all had suspected AA; however, they were blinded to the original CT reports, labo-ratory and surgical findings, and pathological results. All im-ages were reviewed with the following CT findings assessed: (1) appendiceal diameters; (2) appendiceal wall changes; (3) cecal changes; (4) periappendiceal inflammatory changes; (5) phlegmon or abscess formation; and (6) lymph node
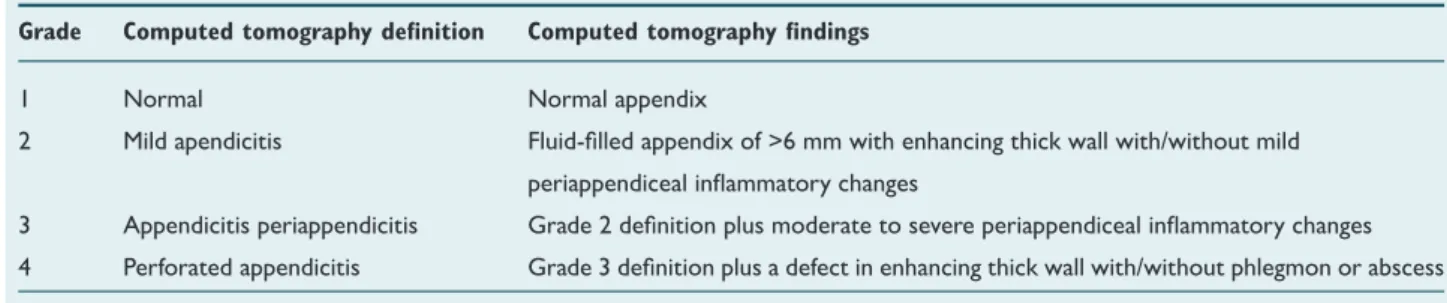
en-largement (Table 1). Appendiceal diameters were measured from the outer wall to the outer wall twice using electronic calipers on magnified images by each observer, and the two measurements were then averaged. Appendiceal wall changes were classified as absent, enhancing thick wall, and defect in enhancing thick wall. Thick appendiceal wall was defined as a wall thickness of ≥2 mm. Cecal changes were classified as absent, thick wall, and thick wall with pericecal fluid. Cecal wall thickening was assessed by comparing to the wall thick-ness of the ascending colon immediately distal to the cecum, and maximal wall thickness was measured. Periappendiceal inflammatory changes were subjectively classified as absent, mild, and moderate to severe. Phlegmon was defined as dif-fuse inflammation of the periappendiceal fat with ill-defined fluid collections, whereas discrete collection with definable walls was defined as an abscess. Lymph node enlargement was defined as absent when the short axis of the largest lymph node in pericecal area was <5 mm, as mild when it was 5–10 mm, and as prominent when it was >10 mm. In addition, patients were subjectively classified using four grades from normal (grade 1) to perforated AA (grade 4) based on CT findings (Table 2) (Fig. 1). This grading system was generated by modifying two previously described systems.[8,9]
Laboratory Analysis
After completion of the image analysis process, medical cords of patients with suspected diagnosis of AA were re-viewed and WBC count (103/µL), MPV (fL), RDW (%), NLR,
and CRP level (mg/L) obtained on complete blood count (CBC) were noted. CBC was obtained just after the physi-cal examination during initial referral. Laboratory analyses were performed using an Abbott ARCHITECT c8000 Clini-cal Chemistry Analyzer for all patients. NLR was Clini-calculated by dividing the percentage values of neutrophils and lym-phocytes.
Statistical Analysis
SPSS (IBM SPSS Statistics for Windows, Version 21.0. Armonk, NY: IBM Corp.) was used for statistical analysis. Normality of data for continuous variables was analyzed using Shapiro– Wilk’s test. Inter-group differences were analyzed with one-way analysis of variance for normally distributed parameters and with Kruskal–Wallis test for non-normally distributed pa-rameters. Paired comparisons were performed using Tukey’s Table 1. Computed tomography findings assessed
Appendiceal Appendiceal Cecal changes Periappendiceal Phlegmon or Lymph node diameter wall changes inflammatory changes abscess formation enlargement
<6 mm Absent Absent Absent Absent Absent
6–10 mm Enhancing thick wall Thick wall Mild Phlegmon Mild
>10 mm Defect in enhancing Thick wall with Moderate to severe Abscess Prominent
test for normally distributed parameters and Mann–Whitney test with Bonferroni correction for non-normally distributed parameters. A p-value of <0.017 (0.05/3 times multiple com-parisons) was considered statistically significant to determine whether CT findings were related to inflammatory markers. A p-value of <0.008 (0.05/6 times multiple comparisons) was considered statistically significant to determine differences in levels of inflammatory markers between CT grades. Receiver operating characteristic (ROC) analysis was used to deter-mine the cut-off values. Appendectomy cases were re-eval-uated considering the cut-off values to make the operation decision and NAR was recalculated. Chi-square test was used to compare the actual and recalculated NAR. The statistical significance level was set at p<0.05.
RESULTS
Of the 92 patients included in our study, 64 underwent
ap-pendectomy and 50 were pathologically proven to have AA, whereas in 14 patients, the appendix was found to be normal. In 4 of 50 patients who were pathologically proven to have AA, CT examinations were considered negative for AA. In 28 patients who were not operated, AA was excluded based on negative CT examinations and clinical follow-up. CT had a sen-sitivity of 92% and a specificity of 95% for the diagnosis of AA. Appendiceal diameter, cecal changes, and periappendiceal in-flammatory changes were found to be significantly related to WBC count, NLR, and CRP level (p<0.05). Appendiceal wall change was found to be significantly related to WBC count, MPV, NLR, CRP level, and phlegmon; abscess formation was found to be significantly related to MPV, NLR, and CRP level; and lymph node enlargement was found to be significantly related to NLR and CRP (p<0.05).
The cut-off values of appendiceal diameter, appendiceal wall Table 2. Computed tomography grades for acute appendicitis
Grade Computed tomography definition Computed tomography findings
1 Normal Normal appendix
2 Mild apendicitis Fluid-filled appendix of >6 mm with enhancing thick wall with/without mild
periappendiceal inflammatory changes
3 Appendicitis periappendicitis Grade 2 definition plus moderate to severe periappendiceal inflammatory changes
4 Perforated appendicitis Grade 3 definition plus a defect in enhancing thick wall with/without phlegmon or abscess
(a) (b)
(c) (d)
Figure 1. Examples of CT grades for AA. (a) Grade 1; axial contrast enhanced CT (CECT)
im-age shows a normal appendix. (b) Grade 2; axial CECT image shows an enlarged appendix
measuring 11 mm in diameter, with an enhancing thick wall and mild periappendiceal
inflam-matory changes. (c) Grade 3; axial CECT image shows an enlarged appendix measuring 12
mm in diameter, with an enhancing thick wall and moderate to severe periappendiceal
inflam-matory changes. (d) Grade 4; axial CECT image shows a perforated appendix with somewhat
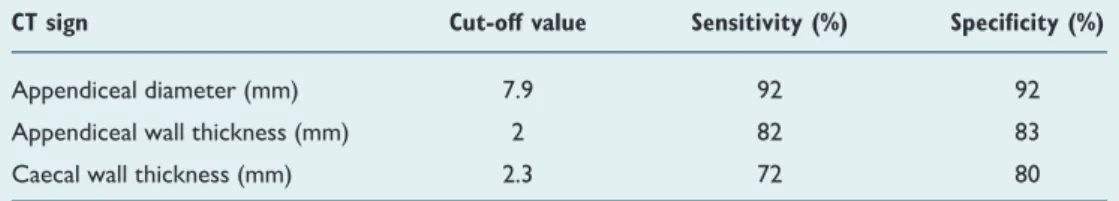
thickness, and cecal wall thickness were 7.9 mm [sensitivity 0.92, specificity 0.92 (95% CI: 0.909–0.994); p=0.0001], 2 mm [sensitivity 0.82, specificity 0.83 (95% CI: 0.824–0.955); p=0.0001], and 2.3 mm [sensitivity 0.72, specificity 0.80 (95% CI: 0.735–0.899); p=0.0001] for the diagnosis of AA (Table 3).
Of the 92 patients in our study population, 44, 29, 13, and 6 patients were classified as grade 1, 2, 3, and 4 on the basis of CT findings, respectively. CT grades were found to be signifi-cantly related to WBC, NLR, and CRP level (p<0.05). Based on the pathological examination and clinical follow-up, the study population consisted of 50 patients with the final diagnosis of AA, whereas in 42 patients, AA was excluded (14 were proven to have pathologically normal appendix, 28 were clinically excluded). In terms of final diagnosis, patients were grouped as positive and negative for AA. When the relation of inflammatory markers between these groups was analyzed, significant differences were found in WBC, NLR, and CRP level (p<0.05). The cut-off values of WBC, NLR, and CRP on ROC analysis were 7.47 [sensitivity 0.90, specificity 0.35 (95% CI: 0.532–0.737); p=0.0185], 4.06 [sensitivity 0.68, specificity 0.73 (95% CI: 0.586–0.783); p=0.0008], and 13 [sensitivity: 0.66, specificity: 0.80 (95% CI: 0.658–0.842); p=0.0001] for the diagnosis of AA, respectively (Table 4).
Considering the agreement between the surgeon’s decisions and pathological diagnoses, of the 64 patients who under-went appendectomy, 50 were grouped as concordant cases and 14 were grouped as discordant cases (comprising also the negative appendectomy group). These groups were re-evalu-ated in terms of the operation decision, considering afore-mentioned cut-off values of inflammatory markers and CT signs (appendiceal diameter, appendiceal wall thickness, and cecal wall thickness). The criterion for the surgeon’s
opera-tion decision was accepted to require minimum one of the in-flammatory markers and minimum one of the CT signs above the cut-off values. Accordingly, recalculated NAR was found to be 9.1%. When the actual and recalculated NAR (21.9% versus 9.1%) were compared, the difference was found to be almost significant (p=0.058).
DISCUSSION
Despite the frequency of AA and the use of different diag-nostic approaches including appendicitis scores, laboratory markers, and imaging modalities, accurate diagnosis remains difficult. High NARs have been reported in our country as well as in some other countries.[3,10,11] Recently, diagnostic
values of MPV, RDW, and NLR are increasingly being evalu-ated in patients with suspected AA, although largely varied results have been reported.[12,13] To our knowledge, there are
no published studies that have investigated the role of these inflammatory markers in decreasing NAR based on CT find-ings of AA.
MPV is a marker of platelet activation that has been shown to reflect the inflammatory burden.[14] Several studies have
evaluated the diagnostic value of MPV in AA; nevertheless, some of them advocate for an increase, while some others advocate for a decrease, in MPV levels. RDW is a measure of the variability of red blood cell size and has been shown to predict various inflammatory conditions.[15,16] Based on CT
findings examined in our study, only appendiceal wall change and phlegmon or abscess formation was found to be signifi-cantly related to MPV. No significant difference was found re-garding the relation between any of these findings and RDW. As thick wall, enhancing wall, or defect in the wall are com-ponents of appendiceal wall change on CT, when wall change is present, this may represent either early or advanced stages of the disease. According to the results of our study, CT find-Table 4. Cut-off values for inflammatory markers with their respective specificities and
corresponding sensitivities
Inflammatory marker Cut-off value Sensitivity (%) Specificity (%)
White blood cell count (103/µL) 7.47 90 35
Neutrophil to lymphocyte ratio 4.06 68 73
C-reactive protein (mg/L) 13 66 80
Table 3. Cut-off values for CT signs with their respective specificities and corresponding sensitivities
CT sign Cut-off value Sensitivity (%) Specificity (%)
Appendiceal diameter (mm) 7.9 92 92
Appendiceal wall thickness (mm) 2 82 83
ings of AA seem to represent different stages of inflammation and thus may be related to different inflammatory markers depending on the inflammation stage. Regarding its relation-ships with CT findings, MPV seems to be related to both early and advanced stages of inflammation. However, further studies should be conducted to evaluate its relationship with CT findings of AA.
In our study, we also evaluated the relation between final diagnoses and laboratory markers. No significant differences were found in the means of MPV and RDW levels, which was discordant with some recent studies.[6,7] However,
Boz-kurt et al.[17] concluded that MPV was not a useful diagnostic
marker in AA, in accordance with our study results. NLR was found to be a useful diagnostic parameter for the diagnosis of AA in children,[18] and it was also found to be more valuable
than WBC and CRP in terms of diagnostic accuracy.[19] The
proposed cut-off values of WBC, NLR, and CRP in the pres-ent study were 7.47, 4.06, and 13 for the diagnosis of AA, respectively.
One of the most important results of our study was that CT had a significant diagnostic utility with a sensitivity of 92% and specificity of 95%, consistent with prior studies evaluating the performance of CT imaging in AA.[20,21]
Our study results revealed a relatively high NAR. At our in-stitution, the primary imaging modality in suspected AA is ultrasound, and CT mainly serves as a problem-solving imag-ing modality in equivocal cases. As our sample was limited to patients who only underwent CT examination, we believe this rate might not reflect the exact NAR in our institution. However, high NARs were also reported in previous stud-ies conducted in our country and in others worldwide.[3,10,11]
Therefore, to analyze the effect of the proposed cut-off val-ues in the present study, the actual and recalculated NARs were compared and the difference was found to be almost significant. We believe the cut-off values proposed in our study, particularly in equivocal cases, may have a value in the diagnosis of AA and thus may help decrease NAR.
Our study has several limitations. First, due to the absence of surgical–pathological proof in patients who were not oper-ated, final diagnoses were based on clinical follow-up. Second, the study had a small sample size limited to one institution of cohort. A relatively small percentage of patients with sus-pected diagnosis of AA are going to CT in our institution, which may have introduced substantial bias. Third, there may be value in correlating the cut-off values of CT signs and in-flammatory markers with common mimics of AA on CT (i.e., Crohn’s Disease and cecal tumors), but due to our exclusion criteria and lack of such cases in our study population, this was not feasible.
In conclusion, proposed cut-off values of WBC, NLR, and CRP level may be helpful to diagnose AA and reduce NAR
when used in combination with the physical examination and imaging modalities, particularly in discordant and equivocal cases.
Conflict of interest: None declared.
REFERENCES
1. Debnath J, Kumar R, Mathur A, Sharma P, Kumar N, Shridhar N, et al. On the Role of Ultrasonography and CT Scan in the Diagnosis of Acute Appendicitis. Indian J Surg 2015;77:221–6. [CrossRef ]
2. Birnbaum BA, Wilson SR. Appendicitis at the millennium. Radiology 2000;215:337–48. [CrossRef ]
3. Kırkıl C, Karabulut K, Aygen E, Ilhan YS, Yur M, Binnetoğlu K, et al. Ap-pendicitis scores may be useful in reducing the costs of treatment for right lower quadrant pain. Ulus Travma Acil Cerrahi Derg 2013;19:13–9. 4. Engin O, Calik B, Yildirim M, Coskun A, Coskun GA. Gynecologic
pa-thologies in our appendectomy series and literature review. J Korean Surg Soc 2011;80:267–71. [CrossRef ]
5. Raja AS, Wright C, Sodickson AD, Zane RD, Schiff GD, Hanson R, et al. Negative appendectomy rate in the era of CT: an 18-year perspective. Radiology 2010;256:460–5. [CrossRef ]
6. Tanrikulu CS, Tanrikulu Y, Sabuncuoglu MZ, Karamercan MA, Ak-kapulu N, Coskun F. Mean platelet volume and red cell distribution width as a diagnostic marker in acute appendicitis. Iran Red Crescent Med J 2014;16:e10211. [CrossRef ]
7. Narci H, Turk E, Karagulle E, Togan T, Karabulut K. The role of mean platelet volume in the diagnosis of acute appendicitis: a retrospective case-controlled study. Iran Red Crescent Med J 2013;15:e11934. [CrossRef ]
8. Kim HC, Yang DM, Lee CM, Jin W, Nam DH, Song JY, et al. Acute appendicitis: relationships between CT-determined severities and se-rum white blood cell counts and C-reactive protein levels. Br J Radiol 2011;84:1115–20. [CrossRef ]
9. Miki T, Ogata S, Uto M, Nakazono T, Urata M, Ishibe R, et al. Enhanced multidetector-row computed tomography (MDCT) in the diagnosis of acute appendicitis and its severity. Radiat Med 2005;23:242–55. 10. National Surgical Research Collaborative. Multicentre observational
study of performance variation in provision and outcome of emergency appendicectomy. Br J Surg 2013;100:1240–52. [CrossRef ]
11. Joshi MK, Joshi R, Alam SE, Agarwal S, Kumar S. Negative Appendec-tomy: an Audit of Resident-Performed Surgery. How Can Its Incidence Be Minimized? Indian J Surg 2015;77:913–7. [CrossRef ]
12. Narci H, Turk E, Karagulle E, Togan T, Karabulut K. The role of red cell distribution width in the diagnosis of acute appendicitis: a retrospective case-controlled study. World J Emerg Surg 2013;8:46. [CrossRef ]
13. Albayrak Y, Albayrak A, Albayrak F, Yildirim R, Aylu B, Uyanik A, et al. Mean platelet volume: a new predictor in confirming acute appendicitis diagnosis. Clin Appl Thromb Hemost 2011;17:362–6. [CrossRef ]
14. Cicek T, Togan T, Akbaba K, Narci H, Aygun C. The value of serum mean platelet volume in testicular torsion. J Int Med Res 2015;43:452–9. 15. Şenol K, Saylam B, Kocaay F, Tez M. Red cell distribution width as a pre-dictor of mortality in acute pancreatitis. Am J Emerg Med 2013;31:687– 9. [CrossRef ]
16. Sadaka F, O’Brien J, Prakash S. Red cell distribution width and outcome in patients with septic shock. J Intensive Care Med 2013;28:307–13. 17. Bozkurt S, Köse A, Erdogan S, Bozali GI, Ayrik C, Arpaci RB, et al.
MPV and other inflammatory markers in diagnosing acute appendicitis. J Pak Med Assoc 2015;65:637–41.
OLGU SUNUMU
Enflamatuvar belirteçlerin negatif apendektomi oranını azaltmadaki rolü:
Bilgisayarlı tomografi bulgularına dayanan bir çalışma
Dr. Ebru Ozan,1 Dr. Gökçe Kaan Ataç,1 Dr. Kaan Alişar,1 Dr. Aslıhan Alhan2
1Ufuk Üniversitesi Tıp Fakültesi, Radyoloji Anabilim Dalı, Ankara 2Ufuk Üniversitesi Fen Edebiyat Fakültesi, İstatistik Bölümü, Ankara
AMAÇ: Bu çalışmada enflamatvuar belirteçlerin negatif apendektomi oranını düşürmedeki rolünün, akut apandisitin (AA) bilgisayarlı tomografi (BT) bulgularına dayanarak araştırılması amaçlandı.
GEREÇ VE YÖNTEM: Akut apandisit ön tanısıyla BT incelemesi yapılan 92 hastanın bilgileri geriye dönük olarak tarandı. Enflamatvuar belirteçler ile BT bulguları arasındaki ilişki araştırılarak, ROC analizi ile enflamatvuar belirteçler ve BT bulgularına ait kesim değerleri belirlendi. Apendektomi yapılan olgular, bu kesim değerlerine göre yeniden değerlendirilerek negatif apendektomi oranı yeniden hesaplandı. Gerçek negatif apendektomi oranı ile yeniden hesaplanan negatif apendektomi oranı arasındaki fark ki-kare testi kullanılarak analiz edildi.
BULGULAR: Apendiks çapı, apendiks duvar kalınlığı ve çekum duvar kalınlığı için kesim değerleri sırasıyla, 7.9 mm, 2 mm ve 2.3 mm olarak bulundu. Beyaz küre sayımı, nötrofil/lenfosit oranı ve C-reaktif protein için kesim değerleri sırasıyla, 7.47, 4.06 ve 13 olarak bulundu. Gerçek negatif apen-dektomi oranı ile kesim değerlerine göre yeniden hesaplanan negatif apenapen-dektomi oranı arasındaki istatistiksel fark neredeyse anlamlı idi (p=0.058).
TARTIŞMA: Enflamatvuar belirteçler AA kesin tanısı için tek başlarına yetersizdir. Ancak, çalışmamızda bulunan kesim değerleri, özellikle arada kalınan olgularda, kesin tanı için faydalı olarak negatif apendektomi oranının düşürülmesine katkı sağlayabilir.
Anahtar sözcükler: Akut apandisit; bilgisayarlı tomografi; C-reaktif protein; negatif apendektomi oranı; nötrofil/lenfosit oranı.
Ulus Travma Acil Cerrahi Derg 2017;23(6):477–482 doi: 10.5505/tjtes.2017.36605
ORİJİNAL ÇALIŞMA - ÖZET
18. Yazici M, Ozkisacik S, Oztan MO, Gürsoy H. Neutrophil/lympho-cyte ratio in the diagnosis of childhood appendicitis. Turk J Pediatr 2010;52:400–3.
19. Markar SR, Karthikesalingam A, Falzon A, Kan Y. The diagnostic value of neutrophil: lymphocyte ratio in adults with suspected acute appendici-tis. Acta Chir Belg 2010;110:543–7.
20. van Randen A, Bipat S, Zwinderman AH, Ubbink DT, Stoker J, Boer-meester MA. Acute appendicitis: meta-analysis of diagnostic perfor-mance of CT and graded compression US related to prevalence of dis-ease. Radiology 2008;249:97–106. [CrossRef ]
21. Old JL, Dusing RW, Yap W, Dirks J. Imaging for suspected appendicitis. Am Fam Physician 2005;71:71–8.