/ ' / 1- ..
/ / G
MARKET EFFICffiNCY AND INFORMATION
CONTENT OF FINANCIAL STATEMENT EARNING ANNOUNCEMENTS IN İSE
MBA THESIS
S ALP KELER ANKARA, June 1997
MARKET EFFICIENCY AND INFORMATION
CONTENT OF FINANCIAL STATEMENT EARNING ANNOUNCEM ENTS IN ISE
A THESIS
Submitted To The Department O f Management And Graduate School o f Business Administration
O f Bilkent University
In Partial Fulfillment O f The Requirements For The Degree O f
M aster O f Business Administration
By
S. ALP KELER June, 1997
I certify that I have read this thesis and in my opinion it is fully adequate in scope and in quality, as a thesis for the degree o f M aster o f Business Administration.
Assist. P ro f A ^ e Yüce
I certify that I have read this thesis and in my opinion it is fully adequate in scope and in quality, as a thesis for the degree o f M aster o f Business Administration.
L ^ ( , Assoc. P ro f Erdal Erel
I certify that I have read this thesis and in my opinion it is fully adequate in scope and in quality, as a thesis for the degree o f M aster o f Business Administration.
Assist. P ro f Can S fae a Mu
Approved by the Graduate School o f Business Administration
H(
qfVb
ABSTRACT
MARKET EFFICIENCY AND INFORMATION CONTENT OF FINANCIAL STATEMENT
EARNING ANNOUNCEMENTS IN ISE BY
S ALP KELER M B A
SUPERVISOR: ASSIST PROF AYŞE YÜCE JUNE 1997, 91 PAGES
This study investigates the impact o f earning values o f quarterly and annual financial statement announcements on stock prices and trade volumes for the stocks listed in Istanbul Stock Exchange National Market during the time period 1992-1995 The relationship between accounting information and price/trade volume is examined from two aspects.
The first aspect is ''information-content test" and it measures the extent to
which announcements convey information to the stock market. The results indicate that the price/trading volume changes on the day o f the announcement is no different than any o f the other date and no significance relationship is found between price/trading volume changes and earnings announcements.
The second aspect is "market-efficiency test" and it investigates whether
accounting earnings reflect factors that affect stock prices and how soon that inlormation is assimilated into stock prices. The results indicate that the accounting earnings does not reflect factors that affect stock prices and despite how strong the
ÖZET
MALİ TABLOLARDAKİ KAR AÇIKLAMALARININ PAZAR ETKİNLİĞİ VE BİLGİ İÇERİĞİ AÇISINDAN
İSTANBUL MENKUL KIYMETLER BORSASINA ETKİSİ Ş. ALP KELER
YÜKSEK LİSANS TEZİ, İŞLETME FAKÜLTESİ TEZ DANIŞMANI: YRD DOÇ DR AYŞE YÜCE
h a z i r a n 1997, 91 SAYFA
Bu çalışma dönemlik ve yıllık mali tablolardaki kar rakamlarının, 1992-1995 dönemi içinde İstanbul Menkul Kıymetler Borsası Ulusal Pazarı’nda işlem gören Hisse Senetlerinin fiyatları ve işlem hacimleri üzerindeki etkisini incelemektedir. Muhasebe haberleri ve fıyat/işlem hacmi arasındaki ilişki, iki bakış açısından incelenmiştir.
Birinci test ''hilgi içeriğinin ölçülmesi” olup, kar açıklamalarının hisse senedi
piyasasına bilgi taşıyıp taşımadığım ölçmek için kullanılmıştır. Sonuçlar muhasebe karlarının açıklandığı gün oluşan hisse senetleri fıyat/işlem hacmi değişimlerinin, diğer günlerden farkının olmadığını ve istatistikel açıdan fıyat/işlem hacmi ve kar açıklamaları arasında bir bağlantı olmadığını göstermektedir.
İkinci test '"piyasa etkinliğinin ölçülmesi ” olup, kar rakamlarının hisse senetleri
fiyatlarını etkileyecek ne kadar bilgi taşıdığı ve bu rakamların hisse senetleri fiyatlarına ne kadar sürede yansıdığını ölçmek için kullanılmıştır. Sonuçlar kar rakamlarının hisse senetlerinin fiyatlarını etkileyecek düzeyde bir bilgi taşımadığını ve bir kişinin erken öğrendiği bilginin önemi ne olursa olsun, o kişinin zarar etme olasılığının bulunduğunu göstermektedir.
I wish to express my gratitude to Assist. Prof. Ayşe Yüce for her
valuable supervision and constructive comments throughout this
study. I would also like to express my thanks to the other members of the examining committee for their helpful comments.
I devote this thesis to my family for all of their contribution throughout my life.
ACKNOWLEDGEMENT
TABLE OF CONTENTS: Page ABSTRACT... i OZET... ii ACKNOWLEDGEMENT... iii TABLE OF CONTENTS... iv I . INTRODUCTION... I II. LITERATURE REVIEW... 5
A. Some Definitions... 5
1) Efficient Market Hypothesis...5
2) The Effect of New Information...6
3) Earnings Values of Financial Statements. . 8
4) Market Price and Training of Stock...9
Emprical Tests... 11
1) The Information Content Test... 11
2) The Market Efficiency Test... 14
III. DATA AND METHODOLOGY... 17
A. Data... 17
1) Regulations f Capital Market Bard... 18
Methodology... 21
1) Definition of Variables... 21
2) Market Model... 22
3) Residual Approach... 24
4) Measurements in the Tests...25
i) Measurement in the Information- Content Test. . . . 25
ii) Measurement in the Market-Efficiency T e s t ... 27
5) Statistical Testing of Results...30
i) Information Content Test...30
a) Price Analysis... 30
b) Trading Volume Analysis...32
ii) Market Efficiency Test...33
IV. FINDING AND CONCLUSIONS...35
A. Findings... 35
1) The Information Content Test... 35
i) Price Analysis... 35
ii) Trading Volume Analysis...36
2) Market Efficiency Test... 38
B. Conclusions... 39
REFERENCES... 42
APPENDIX A -The Data Set Used in Price and Trading Volume Analysis... 48
APPENDIX B- Result o The Information Content Test-Price. . 50
APPENDIX C- Results of The Information Content test-Trading Volume... 64
I. INTRODUCTION
In today’s world , there are various financial markets all o f which are providing
different alternatives for the individual to invest. Stock exchange market is one o f the basic financial markets which provides an important alternative for the individual to allocate his resources in a profitable way.
The central aim o f stock exchange markets is, to bring together a willing and informed buyer, and a willing and informed seller o f a stock, so that an exchange can occur at a mutually agreeable price. It is in the stock market that investors express their opinions about the prospect o f a company through the trades they make.
Another important role o f a stock exchange market is to facilitate capital raising by the business community. While the companies obtain the necessary cash through initial or secondary public offerings, the holders o f equity securities obtain an ownership interest in a corporation. Holders o f equity securities are entitled to the earnings o f the corporation when those earnings are distributed in the form o f dividends, they are also entitled to a prorate share o f the remaining equity in case o f liquidation and they also have voting rights in the general assembly.
The main benefits o f stock exchange to the economy is;
• to stimulate savings.
• to spread the capital ownership to the public.
• to ease the stnictural change in the industry.
In an economy, the growth o f capital markets depends on the efficiency o f the markets it consist o f and whenever the efficiency is obtained, there will be a more growing attention o f the investors to the markets. In the stock market the efficiency is obtained when the prices o f the stocks reflect all possible information related to them and at any time the prices o f the stocks show the agreed assesment value o f the investors who use the available information.
Theories about fundamental determinants o f stock prices have existed for many years. It can be said that, if the reasons behind price movements o f the stock market were identified, then the investor by focusing on these could perform better in the stock market.
The major information sources affecting stock prices can be classified as (Ozer 1996); 1. Financial Reports (income statements, balance sheets, statement o f cash flows,
dividend announcements, production reports etc.)
2. Industry-Related Informations (wage-contracts, unions, strikes etc.)
3. Economy-Related Informations (money-supply, inflation rate, interest rates, capital transformation and international stock exchange movements etc.)
Among these; financial reports have various advantages; they are more related with the stock prices, more reliable, less costly and a more timely information source relative to
others. But it is important to note that, any information obtained from one o f the sources can affect the demand to the information provided by the other sources.
The basic function o f financial reports is to provide decision-related information to users o f them. FASB ( Financial Accounting Standard Board) defines financial reporting as;
“Financial reporting must provide the necessary information for the current and potential investor, creditor and other users so that they can determine the amount and time o f the expected future net cash flows and evaluate the uncertainty. By that way, the users give economic decisions after evaluating all available information they obtained about the firm and the risk they took by making these investments.”
The relationship between stock data (prices and trade volumes) and financial statements has been debated in American literature since 1960’s. When these studies are analyzed, it can be concluded that, a high correlation exists between them. But by looking at the stock market in Turkey, this type o f analysis is rarely used and only a few studies showing emprical evidence exists.
The aim o f this study is “to analyze the impact o f financial statements -in broader sense, the earnings values o f the financial statements- on stock prices and trade volumes for the stocks that are listed in the Istanbul Stock Exchange National M arket” .
The relationship between accounting information and stock-market data is examined from two aspects. The first is the extent to which the announcements convey information to the stock market This aspect is referred to as “ inform ation- content test” and the study directs its attention to the market reaction to announcements, as reflected in the trading volume and price changes o f common stocks during the days surrounding the announcement date.
The second aspect investigates whether accounting earnings reflect factors that affect stock prices, and how soon that information is assimilated into stock prices. We refer to this aspect as “market efficiency test” and this study concentrates on an association between accounting earnings and the behavior o f daily security returns surrounding the announcement date.
The flow o f this thesis is as follows: In Part II, some definitions and a brief review o f the literature are given. In Part III, the data and methodology used in analyzing the effects o f earning announcements are given. In Part IV the findings and conclusions are given.
II. LITERATURE REVIEW
A. Some Definitions:
l i Efficient Market Hypothesis:
A market will be called perfectly efficient if the prices at all times fully reflect all available information and if the prices adjust fully and instantaneously when new information becomes available (Fama 1976). In an efficient market, an investor can not make huge profits by buying or selling on the basis o f an information, as that information has already been assimilated in the price. However, in an inefficient market the stock prices do not adjust to that new information and an investor can earn excess returns by trading on the basis o f that information.
Fama (1970) defined three levels o f market efficiency. The first one is the “weak” form o f efficiency, implying that stock prices reflect the information contained in past prices. That is to say, there is no opportunity to make abnormal returns by studying historical price patterns, and hence technical analysis becomes an unprofitable activity.
The second level o f market efficiency is the “semi-strong” form o f efficiency implying that stock prices reflect not only past prices but all other published information. The researchers who tested the semi-strong efficiency by observing firm-related events such as earning and dividend announcements, stock splits, mergers, macroeconomic conditions in various stock markets concluded that, most o f the information was rapidly and accurately impounded in the price o f the stock.
The final level o f efficiency is the “strong” form efficiency implying that stock prices reflect not only publicly available information, but all the information that can be known by insiders such as firm’s managers or directors In the literature majority o f the researchers don’t believe in this strong form o f the efficient market theory.
Event studies provide a direct test o f market efficiency and in the literature they are usually used to check the semi-strong form o f efficiency. In this study, an event study is also used and the semi-strong form o f market efficiency o f the Istanbul Stock Exchange National Market is tested by using earning announcements covering 1992-1995 period.
21 The Effect o f New Information;
Beaver (1968) hypothesized that if an announcement contained new information about the expectations o f a company, then that new information would be immediately impounded in the price o f that company’s stock. This impounding could take place in several ways. Perhaps the most understood manner o f the impounding o f new information would be through the changes in the equilibrium price o f a security.
A second reaction o f the market to new information would be reflected in terms o f higher volume. If information has been provided to investors, investors may not foresee a necessary change in the price; however, they may foresee a need to shift positions as a result o f changes in risk characteristics or in some other characteristics o f the stock.
This would manifest itself in the form o f abnormal volume activity for a particular security.
Beaver hypothesised that either one or both o f these reactions could take place depending upon risk preferences o f investors and the extent o f changes in the expectations o f the market versus the expectations o f individual investors. Abnormal price changes would result from changes in the expectations o f the market as a whole and abnormal volume activity would reflect changes in the expectations o f individual investors.
If; however, the market shows neither abnormal price changes nor abnormal volume activity during a week when announcements are made, then one might hypothesize that the market has either: 1) anticipated the announcement, thus the formal announcement itself has no information value, but the process which generated the announcement does; or 2) the announcement is o f little or no use to the investor and the process which generated it is o f no use to the investor; or 3) the market does not efficiently absorb new information as hypothesized in the efficient markets literature; or 4) sample design and the methodology chosen are insufficient to test these hypothesis.
3>Earning Values of Financial Statem ents;
The earning values represents the observed results o f the firm’s management decisions o f production, investment, financing under the surrounding conditions in a specific activity period. An investor use earning values;
1 to evaluate management performance
2. to estimate the earning gaining power 3. to estimate the future earning values
4. to appraise the risk o f the investment m ade to the firm.
According to Lev (1989), earnings are widely believed to be the premier information item provided in financial statements. Econom ic theory ascribes to corporate earnings the crucial role o f a signal optimally directing resource allocation in capital markets. Many equity valuation models, both theoretical and those used by practitioners, share a common element- expected earnings- as an explanatory variable. When asked to quantify their beliefs about future outcomes o f securities, financial analysts express such beliefs almost exclusively in the form o f earnings (rather than equity, sales or total assets) forecasts.
Because o f the reasons stated above, it is important to evaluate the usefulness o f quarterly and annual earning values.
4>lVlarket Price and T rad in g of a Stock;
At any time, the price o f a stock represents the agreed monetary value o f the investors’ expectations. This value shows investors’ expectations o f the current value o f future cash flows and change in the cash gaining capacity o f the security.
While making their investments, investors hope to obtain a price gain and a dividend gain. As future is full o f uncertainties, these expectations can be explained by a probability distribution. After the announcement o f new information, the views o f the investors about the agreed price o f stock expected within the probability distribution may change. Therefore, the change in the price o f the stock is due to change o f the investors’ expectations as a result o f the new information.
It is generally accepted that, in the stock exchange market, equilibrium prices are determined by aggregate demand while trading is determined by changes in individual demand. The factors affecting individual demand for securities can be categorized as (Morse 1980); (1) beliefs conditioned on information, (2) prices o f securities, (3) wealth, (4) risk preferences, (5)consumption opportunities, and (6) the market mechanism for trading (such as transaction costs). However, there is no general theory o f how each o f these factors interacts to determine individual demand.
Changes in beliefs occur because o f the arrival o f new information. If an investor believes that the new price did not adjust correctly to the new information, then that investor would have incentives to trade. The greater the divergence between an
investor’s perception o f the correct price and the actual price, the more that investor would want to trade.
B. Empirical Tests:
UThe Information-Content Test:
Beaver (1968) carried out the first research to investigate the market reaction to the annual earnings announcement. Beaver analyzed the common stocks listed on the New York Stock Exchange around the announcement weeks for earnings in the period 1961-1965. Beaver compared trading volume and price changes in report weeks (17 weeks around the announcement) with none- report weeks. Significant changes in price and trading volume were found during the announcement week and he concluded that earnings reports possessed information content.
Lev and Yahalomi (1972) attempted to test the effect o f corporate earnings releases on the Israeli Stock Exchange. The results o f their study were quite different from Beaver’s. While Beaver found that there was a reaction on the New York Stock Exchange to earnings announcements, Lev and Yahalomi were unable to find such a reaction on the Israeli Stock Exchange. According to them the correlation between earnings and stock returns is very low, sometimes negligible.
A related study by May (1971) assessed whether quarterly earnings announcements have significant impacts on investors’ decisions as reflected by market price changes and his results indicate that the magnitude o f price change responses in announcement weeks was greater than the magnitude o f price change responses in non-announcement weeks (five weeks before, five weeks after announcement).
Kiger (1972) presented evidence that there were substantial volume and price reactions to quarterly earnings announcements o f a sample o f NYSE securities He observed and analyzed reactions o f the NYSE market to the release o f 30 quarterly reports o f industrial companies for each o f the second and third quarters o f 1968 and 1969. He excluded securities that had stock splits or stock dividends or news releases near the reporting date, and he also excluded companies that reported quarterly earnings more than five days after the quarter’s close. In general, the evidence indicates that average trading volume and price change, adjusted for market fluctuations, was greater during the period in which the quarterly announcement o f earnings was made than during a control period in which no new information about the company was introduced in the market.
Although a majority o f studies relating published accounting statement data with stock price behavior suggest that the data are fully impounded in stock prices prior to or almost instantaneously at time o f announcement, Joy, Litzenberger, Me Enally (1977) by analyzing NYSE over the period 1963 through 1968 concluded that the information contained in quarterly earnings was not fully impounded into stock prices at the time o f announcement. Also Foster, Olsen, Shevlin (1984) concluded that the speed o f adjustment to information contained in earnings releases were gradual rather than instantaneous. Morse(1981), in addition, founded that the trading reaction lasted longer than the price reaction.
Brown (1978) analyzed the publication o f EPS data and observed that the adjustment process - rather than being instantaneous - is lengthy, about 45 market days. Thus, with
respect to this particular sample o f securities, the market exhibited inefficiencies. In a review o f much o f this literature, Joy and Jones (1979) conclude that at least with respect to quarterly earnings announcements there have been market inefficiencies.
W atts (1978) examined the abnormal returns following quarterly earnings announcements o f a sample o f 73 firms over the 1962-1968 period and reported that abnormal returns were found in the 1962-1965 period but not in the 1965-1968 period.
Ohtsuka (1981), by analyzing Tokyo Stock Exchange during the five-year period starting from September 1974, concluded that price changes were significantly larger in report weeks o f both annual and semiannual announcements than in nonreport weeks, that significant price changes were also observed several weeks before the announcement, and that the price changes were larger in the annual announcement week than in the semiannual announcement week. He didn’t find that a market reaction was reflected in the trading volume.
Morse (1981) added more precise evidence to Beaver (1968) by using daily data. Rather than determining the existence or non-existence o f information content in earnings announcements, he examined when the market reacted relative to an earnings announcement.
Cready and Mynatt (1991) analyzed 320 firms o f NYSE listed firms between 1981-
1983 period. They analyzed the response o f price, trading volume, number o f
change accompanying the annual report is on average small (i.e., less than 0.75 percent) in terms o f an observable one-day effect in the time period immediately surrounding the annual report release date.
2) The Market-Efliciencv Test:
Ball and Brow n’s (1968) research was the first o f its kind to investigate the relation between abnormal rates o f return on common stocks and unexpected annual earnings changes. On the basis o f findings that a sample o f positive (negative) earnings changes yielded an abnormal rate o f return o f the positive (negative) sign during a one-year period before the announcement, but that such behavior diminished in the months after the announcement, they concluded that it will be valuable to know the following year’s annual accounting earnings in advance.
They also concluded that accounting earnings are therefore potentially useful for an investment decision, but annual earnings do not rate highly as a timely source o f information, because 85-90% o f the price adjustment to annual earnings changes occurs before the month o f the announcement.
Latane and Jones (1979), measured the information content o f quarterly earnings reports and the effects o f this information on stock prices. The emprical evidence presented, covering early 1971 through mid 1974, suggested that unexpected earnings were very significantly related to excess holding period returns and that the adjustment to the unexpected earnings was relatively slow.
Rendleman, Jones and Latane (1982) found that roughly 50% o f the adjustment o f stock returns to unexpected quarterly earnings occurs over a 90-day period after the earnings are announced and abnormal returns could have been earned almost anytime. And their analysis also indicates that risk adjustments matter little in this type o f work.
The studies above investigated the relation between unexpected earnings and the sign o f abnormal rates o f return. It is also expected that a relation exists between the magnitude o f these variables -the larger the unexpected earnings, the larger the abnormal rates o f return-.
Beaver, Clarke, and Wright (1979) investigated this relation concerning the New York Stock Exchange and concluded that there is a significant rank correlation between the magnitude o f unexpected annual earnings changes and annual abnormal rates o f return.
Bamber’s (1986) results show continuous (positive) relationship between trading volume and the magnitude o f unexpected earnings, analogous to Beaver, Clarke and W right’s( 1979) security price results. In addition to M orse (1981)’s hypothesis
(H I Trading volume increases significantly when firms announce annual earnings), Bamber also investigates a second hypothesis ( H2; whether volume and earnings are related in a continuous manner) (When annual earnings are announced, unexpected trading volume is positively correlated with the absolute value o f the magnitude o f unexpected earnings). Based on the sample period 1977-1979, Bamber found that both magnitude o f unexpected earnings and firm size were associated with the information
content o f annual earnings announcements. Thus the previously observed dichotomous relationship between earnings releases and trading volume (Beaver (1968) , Morse (1981)) extends to an ordinal association as well. On average, the greater the absolute value o f the earnings surprise, the greater the volume o f trading around the announcement date. M oreover, the trading reaction to annual earnings announcements was greater for smaller firms than for larger firms,
Ozer (1996) examined the abnormal returns following quarterly earnings
announcements over the 1988-1992 period in Istanbul Stock Exchange and concluded that a high correlation exists between earning values and stock prices. His results also show that there is a positive and a linear relationship between the stock prices and the magnitude o f unexpected earnings.
Other studies made by Beaver and Dukes (1972), Brown and Kennelly (1972),
Gonedes (1974), Foster(1975,1977), and Patell and Wolfson(1984), analyzing stock markets found that accounting earnings are potentially useful, but that they are assimilated in stock prices so quickly that investors cannot attain consistently superior rates o f return by reacting to accounting earnings information. Such a market is referred to as efficient with respect to the publicly available accounting information.
m.
DATA AND METHODOLOGY
A. DATA:
This study covers common stocks listed in Istanbul Stock Exchange National Market during the time period 1992-1996. In this study, 13 accounting announcement periods between years 1992-1995 is analyzed. As there is an estimation period and a 200 days data prior to the announcement date is needed and as the 1995 yearly earning values are announced at March 1996, a time-span o f 1992-March 1996 is used in this study.
The necessary data used in this study are obtained from the sources listed below;
1. The quarterly and yearly financial statements are obtained from ISE Yearbook o f Companies, ISE weekly and monthly bulletins.
2. The financial statement announcement dates (the earliest time that the earning values reached to the market) are obtained from ISE Statistical Information Department.
3. The daily closing prices o f stocks, daily volumes o f stocks, daily closing o f ISE composite index, daily total volume values are obtained from Bilkent University Management Department and from M etaStock files.
4. The inflation rates during 1992-1995 are obtained from Bilkent University Library, DIE Bulletins.
Reeulations o f Capital Market Board:
According to Capital Market Law; the firms listed in Istanbul Stock Exchange must prepare second and fourth quarter audited, first and third quarter unaudited financial statements. It is also mentioned in the Capital M arket Law that; the audited (second and fourth quarter) financial statements must be announced within six weeks after the period ends, the unaudited (first and third quarter) financial statements must be announced within three weeks after the period ends. For banks three more weeks are added to these intervals.
The financial statements and reports which must be prepared according to the Capital Market Board’s requirements, and independent auditing report in the case o f being subject to independent auditing; shall be sent to the Capital M arket Board and disclosed in accordance with the principles and procedures stated by the Capital M arket Board.
The independent auditing firms are legally responsible for the losses arising from false and misleading information and thoughts related to the financial statements and reports audited by themselves.
In this analysis, one o f the major criteria for selecting the stock data is; the accounting announcements for that stock must be announced within the acceptable time peiod, as otherwise the statistical efficiency o f the study decreases. In a related study, Givolry and Palmon (1982) investigated the timeliness o f annual earnings announcements and
concluded that the price reaction to the early announcements is higher than to the late ones because information content o f the late announcements decreases when time passes. They also concluded that if a firm doesn’t announce its financial statements within the specified time period, the market interpret this information as bad news than expected.
The data in this study consist o f first and third quarter unaudited, second and fourth quarter audited accounting announcements for the firms that meet the following criteria:
• The firms must be listed on the National Market o f the Istanbul Stock Exchange
during the time period 01/01/92 - 31/05/96.
• The firms must announce the accounting numbers regularly on each quarter within
the specified time period.
• The firms that have different accounting periods are not included in this analysis
such as Dogan Holding and Turk Siemens.
• In this analysis a period covering 15-days before to 15-days after the announcement
is taken, and the stocks o f the firms must be traded almost everyday within the 4 year time-span. (Within the 31 day period around the announcement days, it is a must that the stocks o f the firms trade) The stocks which has low trading volume and which do not trade for a long time are not included in the sample.
• When the stock transactions for a stock is stopped for a specific reason, that stock is not included in the analysis.
• During the period, when there are two sessions, the closing price o f the day (second
session) is taken.
• The price data used are adjusted for dividend and split changes for the period
01/01/1992 through 31/05/1996.
• The stocks issued after January 1992 are not included in the analysis in order to
make a comparison between subsequent years.
After applying these criteria for each stock listed in Istanbul Stock Exchange, 65 stocks are suitable for price analysis and 34 stocks are suitable for trading volume analysis. The stocks used in the analysis are listed in Appendix A.
B . M E T H O D O L O G Y :
1) Definition of Variables:
For each firm, the price and trade volume values are collected on a daily basis, for a period consistent with the aims o f this research: the investigation period and the period for estimating the parameters o f the market model. After collecting these values, the daily returns and trade volume changes for each stock are computed by the following equations,
R ,= lo g ( P it/P i,.,) i
Pit, Pi,t-i = the closing price per share o f firm i on days t and t-1 respectively.
O i, =log(Vit / Vi,.i)
Vit, Vi,-i = the number o f shares o f firm i traded on days t and t-1 respectively.
The market composite index and market trade volume values are also collected within this period. After collecting these values, the market return and market trade volume changes are also computed using the following equations.
R„u = log ( P I, / P I m )
P I . , P I . . = the closing value o f price index on days t and t - 1 respectively.
=log(Vm. / Vmt-i)
Vmt, Vmt-i = the number o f shares traded for all firms listed in the National M arket o f the Istanbul Stock Exchange on days t and t-1 respectively.
In this study a 31-trading day period is selected in order to investigate the market reaction to the earning announcements (the 15 trading days before the announcement day, and the 15 trading days after). It is expected that responses to earning announcements would be reflected in stock prices and trade volumes within these period.
21 Market Model;
Stock price movements and trade volume movements around the date o f the earning announcements were examined by using the market model. This method o f analysis eliminates the effect o f marketwide influences on individual stocks. Since the income report is evaluated as it relates to the individual firm, its contents and timing should be assessed relative to changes in the rate o f return and trading volume on the firm’s stocks net o f market-wide efforts.
At first, an estimation period which is different than the calculation period o f abnormal returns is determined. Then, a regression equation is formulated for the estimation (investigation) period in order to calculate the constants that is going to be used in abnormal return calculations. After calculating the constants, the regression equation is applied to the 31-day announcement period for computation o f abnormal returns.
In this study an estimation period o f 150 days is selected and during -200...-50 days prior to the accounting announcement, the regression coefficients are calculated. Then using these values, one can calculate abnormal returns during -15... +15 days surrounding the announcement date. This analysis is applied to 13 quarterly accounting announcement periods between years 1992-1995. As there is an estimation period and a 200 days data prior to the announcement date is needed and as the 1995 yearly earning values are announced at March 1996, a time-span o f 1992-March 1996 is used in this study.
Therefore; for each firm in the sample, by the help o f the equation,
Rit ~ +bj Rmi +&it
(where inn is the return residual for security i at time t)
the 3i and bi values were estimated using the ordinary least squares regression
technique
(Di, = Ci +d, <D„, +Ui,
(where lia is the volume residual for security i at time t)
the Ci and di values for each stock were estimated using the ordinary least squares
regression technique based on the observations o f O a and .
3) Residual Approach:
There are several reasons for using residuals. Trading and price changes from non information factors may occur jointly throughout the market. Also private information is more likely to be more specific. By removing variances due to market-wide factors that are unrelated to variables o f interest, a stronger statistical test can be performed.
In order to remove the effects o f marketwide events upon the individual stock price and the trading volume, the returns and volume changes are transformed into residuals through the following equations;
Rit - 3i - bi R,
mtand
Ui, - <Di, - Ci - di (D,mt
The residuals from the regression measures the extent to which the realized return differs from the expected return,
4) Measurements in the Tests:
i) Measurements in the Information- Content Test;
If an announcement conveys information to the stock market, more and a larger residual (return and volume) is expected on the announcement day than on any o f the other days. A larger residual can be obtained if there is no leakage o f information before the announcement date and there is not a substantive information-processing period after the announcement.
Therefore, it can be said that, whether the earnings announcements has information content or not, can be tested by observing the relative magnitude o f daily residual (return and volume) surrounding the announcement date.
In this analysis, M orse’s (1981) statistics is used to measure the relative magnitude o f residuals.
The return residual o f each date t in the investigation period for firm i (&it) is initially transformed into the standardized residual (in) by dividing by its own standard deviation to help attain some distributional comparability among the firms.
Once the sign o f (Bit) is removed, because the direction o f the price changes is irrelevant, the absolute value o f the standardized residual (Bit) is averaged over all the firms included in the sample by using the announcement period as the zero time unit.
n
E t = l / n S lÉitl t= -15,... +15 n= # o f samples
i=l
The mean standardized volume residuals(Ut) are also computed as;
Volume residuals (Uit) are standardized by using the mean and standard deviation o f their own residuals for the investigation period. This procedure is indispensable, because trading-volume data in the study (O u and Omt) are not scaled by the number o f shares for each security outstanding. Otherwise the volume residual would not be comparable across the spectrum o f firms.
Once the standardized volume residuals (Uii) are computed, they are then averaged out o f the number o f sample announcements in the same way as return residual.
U t = 1/n S U it t - -15, i=l
+ 15
n= # o f samples
The relative magnitude o f E, and Ut for each day in the investigation period provides evidence for the existence or nonexistence o f information content and the process o f information dissemination.
ii) Measurements in the Market- Efficiency Test:
It is generally accepted that, the accounting earnings numbers are expected to convey some degree o f information to the market, but not all o f it is necessarily new information.
Then to determine if part o f this increase in accounting earnings can be expected with information contained in the firms’ previous accounting earnings number, the expected and unexpected elements o f earnings change are segregated. It is the unexpected part o f the earnings that is meaningful to investors as new information. Therefore, the unexpected earnings can be computed as the reported actual earnings minus the expected earnings.
The expected earnings are computed as;
Expected earnings o f the current period = the higher value o f a)The actual earnings o f the previous period * (1+x) b)The actual earnings o f the same quarter o f the previous year *(l+ y)
x; correlation factor (the consumer price index for the last 3 months), as investors perform their operations on the basis o f the outcome in the last period.
y: correlation factor (the consumer price index for the last 12 months), as investors perform their operations on the basis o f the outcome in the last year
Positive (negative) unexpected earnings mean that the operating result was more favorable (unfavorable) then expected. In the current period if the firm has the actual reported earnings number higher than the expected earnings, that firm is included in the good news portfolio. In order to be included in the good news portfolio the firms actual income numbers must be greater than both a) the actual earnings o f the previous period * (1+x) and b)the actual earnings o f the same quarter o f the previous year *(l+y). If the firms actual income number is lower than tw o o f this values, it is treated as bad news. If the firms actual income number is lower than one o f this values, it is treated as neutral news and is not included in the analysis.
Moreover, the firms that are announcing a negative earning value, are included in the bad news portfolio whether they decrease their loss or not. The firms that are
announcing positive earning value after successive negative earnings values are included in the good news portfolio.
The samples are classified as good news or bad news for each quarter according to these benchmark.
In order to trace the behaviour o f the abnormal return o f each group o f the firms whose earnings numbers are classified as either good news or bad news, the cumulative abnormal return (C A R ) is calculated as:
T N
CARt = 2 (l/NS(!Pio)
t=-15 i-1
T= trading day relative to eamings-announcements day (trading day 0)
N= number o f the firms with unexpected earnings in that particular group (good news or bad news)
It is expected that, if the annual earnings are related to stock prices, then
• C A R > o for the subsample with the good news
• C A R < 0 for the subsample with the bad news, must be obtained.
If there is no relation between annual earnings and stock prices, C A R ’s are expected
5) Statistical Testing o f the Results:
i) Information - Content Test:
a) Price Analysis:
The price changes for each date are investigated by tw o different statistical tests. The first test used in the analysis is the parametric chi-square test and the second one is the nonparametric binomial test. A chi-square test is used because it is the most suitable goodness o f fitness test for nominal data and it determines whether some observed pattern o f frequencies corresponds to an expected pattern. A nonparametric test is also used because &it may not follow normal distribution.
In the chi- square test, we assume that &it follows normal distribution and in this test Bu is standardized so as to be disributed N (0, 1). It can be said that the mean o f the standardized residual variance (7 ^ (Bit) will be 1, if the larger Ba does not cluster on a
given day.
The hypothesis testing used in this part is,
H o : a ' ( E . , ) = l
After that, the chi- square statistic was generated by squaring and summing up each observation for each date. The degrees o f freedom used in this analysis equals to (n -1 = 64) . This chi- square statistic is computed for each o f the quarter similarly. The chi- square statistics for each quarter are shown in Appendix B.
As &it may not follow the normal distribution and Ejt might not be disributed N (0, 1), a nonparametric test is also performed. When one standard deviation is used as a benchmark for the larger residual, the probability that the absolute value o f the standardized residual is greater than 1 is equal to
p = total number o f times absolute Bit >1 / 65 (sample size) /3 1 (number o f days)
This probability value is calculated for each quarter in the analysis.
After calculating the probability values, the binomial test was conducted by counting
the number o f times (Xt) the absolute value o f is greater than 1 at each date.
The hypothesis testing used in this part is;
H o: X, / 65 = p
H , ; X , / 65 > p
Z,= (X,-65 * p ) / ( 6 5 * p * ( l - p ) )
1/2In the analysis a one-tailed test is used because, the interest is observing unusually large price changes. The t statistics for each quarter are given in Appendix B.
bl Trading Volume Analysis:
The trading volume changes surrounding the accounting announcements are tested by two statistical tests. These are a parametric t-test and a nonparametric binomial test.
In the parametric t-test, whether the average U t at each date is significantly greater
than the average for the period under investigation is tested. It can be said that if larger
volume residuals do not cluster on a given day, the average U t is not significantly
different from zero.
The hypothesis testing used in this part is;
Ho; aver (Ut) = 0
H i: aver (Ut) > 0
The test statistic for each date is calculated using the following formula.
t,
= avert U i) -0where St (Uit) is the sample standard deviation o f Uii, The calculated t-statistics for each quarter are shown in Appendix C.
The second test used in volume analysis is the nonparametric binomial test. This is similar to the one used for price analysis, but there is an exception. In this analysis the number o f times that the standardized residual itself (instead o f the absolute value o f it) is greater than one is counted. The calculated statistics are shown for each quarter in Appendix C.
iO Market - Efficiency Test:
After classifying each earnings as either good news or bad news, the cumulative abnormal residuals for good news and bad news portfolio are computed. The composite C A R is the cumulative abnormal return from an investment policy that entails buying good-news firms and selling short bad- news firms. Appendix D shows, the Good news. Bad news and Composite news cumulative abnormal residual values for each quarter.
The second analysis used in market efficiency test is based on statistical testing. This statistical testing o f market efficiency o f the quarterly earning announcements is done as follows;
At first, in all o f the 13 quarters, the abnormal rate o f returns for each day in the investigation period is calculated for the good news, bad news and composite news
portfolios. Then, by equally weighting these calculated abnormal rate o f returns, they are segregated into one data set for each o f the three types o f portfolios. After the segregation process, the C A R ’s are calculated for the periods consistent with the aims o f research.
The hypothesis testing used in this part is;
H 0= in the time span investigated, no positive cumulative abnormal returns exist and an
investor who has early information about the earnings announcements can not earn huge profits.
H ,= there exists positive cumulative abnormal returns and huge profits can be earned on the basis o f earnings information.
The significance o f the results is tested by using t-tests. To test whether the cumulative
abnormal return from day ti until day X2 is significantly positive, the statistical
significance o f C A R is computed by;
t = C A R / a (C A R )
a (C A R ) = a (Ar,) * (tj - t, +1 )m
1 time periods are selected and the t-test is applied to each period, in order to
IV . F I N D I N G S A N D C O N C L U S I O N S :
A . F I N D IN G S :
1. The Information Content Test:
i> Price Analysis:
Based on the results shown in Appendix B, it can be concluded that there isn’t any significant price changes occuring on the day o f the announcement than any o f the other day. We reach this conclusion by comparing two different test o f significance.
In the first test o f significance ( a parametric chi-square test) tw o significance levels
were chosen, a = 0.05 and a =0.01. The tabled value o f for 64 degrees o f freedom
and a = 0.05 is approximately 83. Among the 13 quarter we investigated, in only 4 o f
them (31%), the statistics for the announcement day has a higher value than 83.
When the other days X^ statistics in these 4 periods are also investigated, mostly all o f the other days has a higher value than 83. It is interesting that in all o f the 13 periods, on the first day after the financial statement was announced, significant price changes occurred and it can be concluded that the market needs some time to perceive the information content o f the earning values. Based on the results, it can be concluded that significant price changes does not occur on the day o f the announcement and the null hypothesis o f “the mean o f the standardized residual variance a ^(Ei,) will be 1” is not
Also as in 3/13 (23%) o f the quarters, statistics o f the announcement day are higher
than the value 93 (the tabled value o f for 64 degrees o f freedom and a = 0,01) and
in 11/13 (85%) o f the quarters, X^ statistics o f the first day after the announcement are higher than the value 93, it can be concluded that accounting earnings has a information content, but the market needs some time to perceive the information content.
In the second test o f significance ( a nonparametric binomial test) two significance levels were chosen, a = 0.05 and a =0.01. The tabled value o f t statistics for 64 degrees o f freedom and a = 0.05 is approximately 1.670. Since on the announcement date 2 / 1 3 (15%) o f the quarters t statistics are higher than the value 1.673, it can be
concluded that significant price changes does not occur on the day o f the
announcement and the null hypothesis o f “Ho: X, / 65 = p” is not rejected.
Also as in 9/13 (69%) o f the quarters the t statistics on the first day after the announcement date is higher than the value o f 1.673, the same result o f “some time must pass so that the market can perceive the announcement” is concluded.
HI Trading Volume Analysis:
Based on the results shown in Appendix C, it can be concluded that trading volume changes surrounding the announcement date is no different than any o f the other date and no significance relationship was found between trade volume changes and earning announcements We reach this conclusion by comparing two different test o f significance.
In the first test o f significance (parametric t test) two significance levels were chosen,
a = 0.05 and a =0,01. The tabled value o f Z for 64 degrees o f freedom and a = 0.05 is
approximately 1,645. Since 0 / 1 3 (0%) o f the quarters Z statistics on the date o f announcement are higher than the value 1.645, it can be concluded that no
significant trading volume changes occur on the day o f the announcement and the null hypothesis o f “average Ut =0 ” is not rejected.
In the second test o f significance ( a nonparametric binomial test) also the same procedure is used as in the price analysis and tw o significance levels are chosen, a = 0.05 and a =0.01. The tabled value o f t statistics for 64 degrees o f freedom and a = 0.05 is approximately 1.645. Since in 0 /16 (0%) o f the quarters t statistics on the date o f announcement are higher than the value 1.645, it can be concluded that no significant trading volume changes occur on the day o f the announcement and the null hypothesis o f “H©: X, / 34 = p” is not rejected.
2) The Market-Efficiency Test:
In Appendix D, the results o f the first analysis, cumulative abnormal return results o f the market efficiency test is given. From the cumulative abnormal return values o f good news portfolio, it can be concluded that in 6 / 13 (46%) o f the quarters, an investor who has early knowledge o f the earning announcements can earn a profit by buying the good news stocks 15 days before the announcement date.
From the cumulative abnormal return values o f bad news portfolio, it can be concluded that in 9 / 13 (69%) o f the quarters, an investor who has early knowledge o f the earning announcements can earn a profit by selling the bad news stocks 15 days before the armouncement date.
Lastly, from the cumulative abnormal return values o f composite news portfolio, it can be concluded that in 8/ 13 (%62) o f the quarters, an investor who has early knowledge o f the earning announcements can earn a profit by buying good news stocks and by selling the bad news stocks 15 days before the announcement date.
When all o f this results are combined, it can be said that a person who has early knowledge o f the earnings announcements can not earn a guaranteed return in the 30- day time-span.
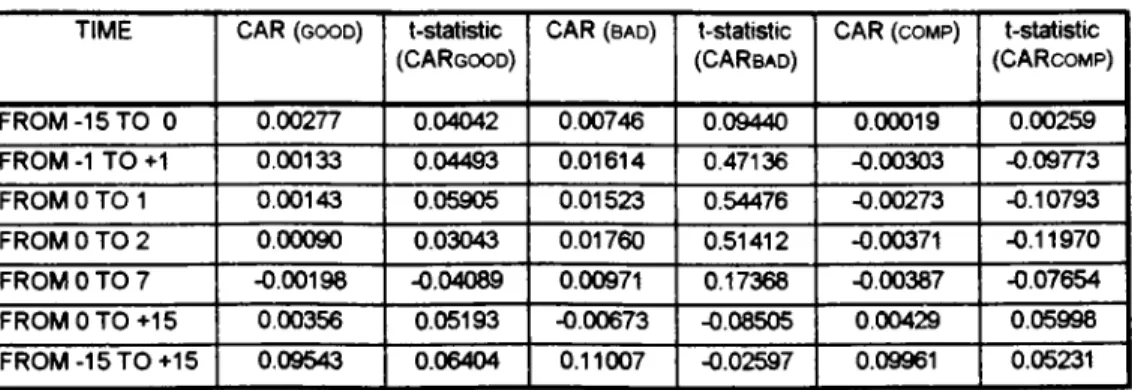
The cumulative abnormal returns and the corresponding t statistics o f this study for the years 1992-1995 are calculated for each o f the 7 periods and given in tabular form.
Table 1. M ark et Eflficiency Test Results TIME FR O M -15 TO 0 FROM -1 TO +1 FROM 0 TO 1 FROM 0 TO 2 FROM 0 TO 7 FROM 0 TO +15 FROM -15 TO +15 CAR (GOOD) 0.00277 0.00133 0.00143 0.00090 -0.00198 0.00356 0.09543 t-statistic (CARgood) 0.04042 0.04493 0.05905 0.03043 -0.04089 0.05193 0.06404 CAR (b a d) 0.00746 0.01614 0.01523 0.01760 0.00971 -0.00673 0.11007 t-statistic (CARbad) 0.09440 0.47136 0.54476 0.51412 0.17368 -0.08505 -0.02597 CAR (COMP) 0.00019 -0.00303 -0.00273 -0.00371 -0.00387 0.00429 0.09961 t-statistic (CARcoMP) 0.00259 -0.09773 -0.10793 -0.11970 -0.07654 0.05998 0.05231
When the Market Efficiency Test Results shown in Table 1 are analyzed, it can easily be seen that for all o f the three portfolios (good, bad and composite), the absolute value o f the calculated t statistics are very small. In the good news and in the bad news portfolio the highest t-statistic value is obtained in the 0-1 day period, but yet they are not statistically high. As in all o f the periods the calculated t values are smaller than the t-critical values, the null hypothesis -“a person who has early information can not earn profits based on the information he has”- is not rejected.
B . C O N C L U S I O N S :
Following inferences can be made by analysis o f results:
1) By the information-content test performed; it can be concluded that, “Price
changes on the day o f the announcement is no different than any o f the other date and no significance relationship and correlation is found between price changes and earnings announcements” .
2) It is also concluded that; “Trading volume changes surrounding the
announcement date is no different than any o f the other date and no significance relationship is found between trade volume changes and earning
announcements” .
3) By the market-efficiency test performed; it can be concluded that, “A person
who has early knowledge o f the earnings announcements can not earn a guaranteed return in the 3 1-day time-span. Whatever the information he obtained is, he can not earn huge profits by buying or selling on the basis o f that information.”
4) Istanbul Stock Exchange National Market is a very speculative market and most
o f the stock prices are manipulated by groups. These groups adjust the stock prices in such a manner that; despite the strongness o f the information one has, he can loose money.
5) As the results found are different than expected, it can also be concluded that
there are a lot o f information leakage and insider trading in the Istanbul Stock Exchange National Market. Because the auditing system is not sophisticated in Turkey and because some time passes between the sending date o f the earnings announcements to Capital Market Board and publicly announcement date, most o f the information is disseminated.
In order to eliminate this leakage, maybe in a further study, the date that the announcements are sent to the Capital Market Board is taken as the
announcement date or a longer time period than 31 days is selected to understand the effect financial statement announcements more accurately.
R E F E R E N C E S :
Ball, R., Brown, P,, (1968), “An Emprical Evaluation o f Accounting Income Numbers”, Journal o f Accounting Research. Vol. 6, N o.2, pp. 159-178.
Ball, R., Brown, P., Finn, F.J., Officer. R.R., (1989), Share Markets and Portfolio Theory. University o f Queensland Press.
Bamber, L. S., (1986), “The Information Content o f Annual Earnings Releases:A Trading Volume Approach”, Journal o f Accounting Research. Vol. 24, N o.l pp. 40-56.
Bamber, L.S., (1987), “Unexpected Earnings, Firm Size, and Trading Volume Around Quarterly Earnings Announcements”, The Accounting Review. Vol.62, No.3 pp.510- 531.
Beaver, W.H. ,(1968), “The Information Contents o f Annual Earnings
Announcements”, Journal o f Accounting Research. Vol.6, Supplement 1968: 67-92.
Beaver, W.H., Dukes, R.E., (1972), “Interperiod Tax Allocation, Earnings Expectations, and the Behavior o f Security Prices”, The Accounting Review. April
1972 pp. 320-332.
Beaver, W.H., Clarke R., Wright W.F.(1979), “The Association Between Unsystematic Security Returns and the Magnitude o f Earnings Forecast Errors”, Journal o f Accounting Research. Vol. 17, N o.2, pp.316-340.
Brown, P., Kennelly, J.W., (1972), “ The Information Content o f Quarterly Earnings: An Extension and Further Evidence”, Journal o f Business, pp. 403-415
Brown, S.L., (1978) “Earnings Changes, Stock Prices and Market Efficiency”, The Journal o f Finance, pp. 17-28
Brown S.J., Warner, J.B,, (1985), “Using Daily Stock Returns”, Journal o f Financial Economics. Vol. 14, pp.3-31.
Cready, W.M., Mynatt, P.G., (1991), “The Information Content o f Annual Reports: A Price and Trading Response Analysis”, The Accounting Review. Vol. 66, No.2, pp. 291-312.
Deakin, E.B., Norwood, G.R., Smith C.H ., (1974), “The Effect o f Published Earnings Information on Tokyo Stock Exchange Trading”. Journal o f Accounting, pp. 124-136.
Dimson, E., Marsh, P. (1986), “Event Study M ethodologies and the Size Effect”, Journal o f Financial Economics. Vol. 17, pp. 113-142.
Fama, E.F., Fisher L., Jensen M.C., Roll R., (1969), “The Adjustment o f Stock Prices to New Information”, International Economic Review. Vol. 10, No. l , pp.1-21
Fama , E.F., (1976), “Foundations o f Finance” , N ew York, Basic Books.
Foster, G., (1975), “Accounting Earnings and Stock Prices o f Insurance Companies”, The Accounting Review, pp. 686-698.
Foster, G., (1977), “Quarterly Accounting Data: Time Series Properties And Predictive-Ability Results”, The Accounting Review. Vol. 7, No. 1, pp. 1-21.
Foster, G., Olsen, C., Shevlin T., (1984), “Earnings Releases, Anomalies, and the Behavior o f Security Returns”, The Accounting Review. Vol. 59, N o.4, pp. 574-603.
Garbade, K., (1982), Securities Markets. McGraw- Hill Publications
Givolry, D., Palmon, D., (1982), “Timeliness O f Annual Earnings Announcements; Some Emprical Evidence”, The Accounting Review, Vol. 67, No.3, pp. 486-508.
Gonedes, N.J., (1974) “Capital Market Equilibrium and Annual Accounting Numbers: Emprical Evidence”.Joumal o f Accounting Research. Vol. 12, No. 1, pp.26-62
Guerard, J.B., Gultekin, M.N., (1992T Handbook o f Security Analyst Forecasting and Asset Allocation. Contemporary Studies in Economic And Financial Analysis, Volume 69.
Hagerman, R. L., Zmijewski, M E., Shah, P. (1984), “The Association Between the Magnitude o f Quarterly Earnings Forecast Errors and Risk-Adjusted Stock Returns”, Journal o f Accounting Research. Vol. 22, N o.2 pp. 526-540.
Joy, O M., Litzenberger, R.H., Me Enally, R.W., (1977), “The Adjustment O f Stock Prices To Announcements O f Unanticipated Changes In Quarterly Earnings”, Journal o f Accounting Research, pp. 207-225.
Joy, O., Jones, C . (1979), “Earnings Reports and Market Efficiencies: An analysis o f the contrary evidence”. Journal o f Financial Research. Autumn, 207-225,
Karpoff, J.M., (1986), “A Theory o f Trading Volume”, The Journal o f Finance. Vol. 41, N o.5, pp. 1069-1087.
Kiger, J.E., (1972), “An Emprical Investigation o f NYSE Volume and Price Reactions to the Announcement o f Quarterly Earnings”, Journal o f Accounting Research, pp. 113-
128.
Kim, O., Verrecchia, R.E., (1991), “Trading Volume and Price Reactions to Public Announcements”, Journal o f Accounting Research. Vol. 29, No.2, pp. 302-321.
Latane, H.A., Jones, C.P., (1979), “Standardized Unexpected Earnings— 1971-77”, The Journal o f Finance. Vol. 34, No.3, pp. 717-724.
Lev, B., Yahalomi, B., (1972), “The Effect o f Corporate Financial Statements on the Israeli Stock Exchange ”, Management International Review. 2-3.
Lev, B., (1989), “On the Usefulness o f Earnings and Earnings Research; Lessons and Directions from Two Decades o f Emprical Research”, Journal o f Accountina Research. Vol. 2 7 Supplement
May, R.G. (1971), “The Influence o f Quarterly Earnings Announcements on Investor
Decisions as Reflected in Common Stock Price Changes, Emprical Research in
Accounting, Selected Studies”, Journal o f Accounting Research. Vol. 9 supplement, pp.119-171.
Morse, D., (1980), “Asymmetrical Information in Securities Markets and Trading Volume”, Journal o f Financial and Quantitative Analysis, December 1980 Vol, 15 No. 5
M orse D., (1981), “Price And Trading Volume Reaction Surrounding Earnings Announcements; A Closer Examination”, Journal o f Accounting Research. Vol. 19, No.2, pp.374-383.
Morse, D., (1984), “ An Econometric Analysis o f the Choice o f Daily Versus Monthly Returns in Tests o f Information Content”, Journal o f Accounting Research. Vol. 22, No.2, pp. 605-623.
Ohtsuka, M., (1981) “The Effectiveness o f Accounting Information in Capital Market: Information Effect o f Accounting Announcements”, Business Accounting. Vol. 33, No. l , pp.374-383.
Ozer, G., (1996), Muhasebe Karlari ile Hisse Senedi Verimleri Arasindaki ilişkiler: I.M .K.B.’de Deneysel Bir Analiz, S.P.K. Yayinlari, Yayin No.31.
Patell, J. M., Wolfson, M.A. (1984) “ The Intraday Speed o f Adjustment o f Stock Prices to Earnings and Dividend Announcements”. Journal o f Financial Economics , Vol. 13,No,2, pp. 223-252.
Rendleman, R.J., Jones, J.P., Latane, H.A. (1982), “Emprical Anomalies Based on Unexpected Earnings and The Importance o f Risk Adjustments”. Journal o f Financial Economics. Vol, 10, pp. 269-287,
Sakakibara, S., Yamaji, H., Sakurai, H., Skiroshita, K., Fukuda, S., (1988), The Japanese Stock Market. Praeger Publications.
Schwert, G.W., Smith, C.W., (1992), Emprical Research in Capital Markets. McGraw- Hill Publications.
Verrecchia, R.E., (1981), “On the Relationship Between Volume Reaction and Consensus o f Investors: Implications for Interpreting Tests o f Information Content”, Journal o f Accounting Research. Vol. 19, No. l , pp. 271-283.
Watts, R.L., (1978) “Systematic Abnormal Returns After Quarterly Earnings Announcements”, Journal o f Financial E conom ics, pp. 127-150
Ziebart, D.A., (1990), “The Association Between Consensus o f Beliefs and Trading Activity Surrounding Earnings Announcements”, The Accounting Review. Vol. 65, No.2, pp. 477-488,
A P P E N D I X A ;