© International Logistics and Supply Chain Congress 2017 October 19-20, 2017, Istanbul, Turkey
LOW VOLUME STORE PLANNING FOR WORKLOAD BALANCING AND
TRUCKLOAD
Caner Okutkan
1, Ömer Çelepçıkay
2, Egemen Berki Çimen
31Istanbul Dogus University, Faculty of Engineering, Department of Industrial Engineering, Istanbul, Turkey, [email protected]
2Istanbul Dogus University, Faculty of Engineering, Department of Industrial Engineering, Istanbul, Turkey, [email protected]
3Istanbul Dogus University, Vocational High School, Department of Computer Programming, Istanbul, Turkey, [email protected]
Abstract ⎯ In this study, it is aimed to decrease the number of days planned to be shipped in stores with low
sales volume, to create a balanced work load and to increase vehicle occupancy capacity .Particularly, Less than Truckload problem is analyzed and model in this study. The techniques used in this study showed that adaptability can be achieved with shipment and store planning as well as green supply chain environment to minimize Less than Truckload (LTL) as well as gas consumption. A mathematical model was created in the direction of multi objective problem and solved in the GAMS environment. Moreover, scenario analyzes were made and the study was tested on five specially identified regions on Turkey.
Keywords ⎯ Warehouse Management, Store Planning, Workload Balancing, Truckload
INTRODUCTION
Modernization of supply chain with the internet of things (IoT) has been a crucial part to play in the matter of logistics as management becomes more efficient and able to control and lead more data than it ever was. This technological advancement is meant to make profit easily and turns supply chain more competitive environment as companies can easily invest and earn from this area. Thus, companies have decided to invest their infrastructure to become agiler in the matter of reaching customers’ need at right time with right price to charge. Especially, modern customer demands quality and price in any product [1] [2] and price cutting with the best quality becomes a more crucial tool to get ahead of rivals. Therefore, supply chain and logistics are the best possible place to start.
A supply chain covers a raw material and product ordering/production and accommodation as well as product distribution, vehicle occupancy rate, vehicle type and etc. which directly change the price to the customer as well as the profitability of product [3]. However, today supply chain is aimed to reduce waste /loss of resources and this stands for the fact that right product is offered to customers. To achieve such a high goal, not only information technology and management should be capable to provide necessary information but also able to act upon the decision.
One of the best examples of this situation comes from ZARA, the most profitable apparel company as they follow the trends through stores and their suppliers always are ready to complete orders. Such collaboration has been rewarding ZARA with double digit profit since 1990 [4]. This is an important indicator to see supply chain as dependent pieces and the only way to control fluctuations of demands (the bullwhip effect) is to act together. Such a group can only aim to achieve sustainability. Moreover, this collaboration for ZARA provides an environment to less discounted product, less inventory cost and quick response to trend because ZARA keeps tracks of customer’s reaction and management acts upon the need of customer instead of what ZARA could desire.
Therefore, this study is to show the benefit of providing right product to customer’s need and offer a basic methodology to achieve such a difficult task with mathematical programming as it may act to optimize logistic cost and with better planning, more collaborative environment between third party logistic firms and the company would be developed as it would give ability to quick response to customer’s need. Especially, third party logistic firms can lead higher occupancy rate rather than half empty trucks as it becomes more profitable and provide the ability to serve more customers. This also affects overall supply chain and increase productivity through truckload and today LTL means 35$ billion worth business [5].
© International Logistics and Supply Chain Congress 2017 October 19-20, 2017, Istanbul, Turkey
There is also another angle which is green logistics as less truck in traffic could lead to less CO2 and less consumption to fuel for a better environment. According to the United States Environmental Protection Agency (EPA), transportation effect on Green House Gas represented 27% which is second highest level as electricity was seen 29% as highest in 2015. Moreover, the same study pointed out that vehicle that used petroleum represented 90% against all options for fuel. Such waste could be earned back with suggested method [6].
Figure 1. Sources of Greenhouse Gas Emission [6].
The following section introduces problem environment and example solution techniques as literature review, it follows with suggested solution method as mathematical model which follows with scenario analysis to calculate other options and finally this study completes with conclusion which shows importance of this kind of work and benefit of supply chain planning against Less Than Truckload (LTL).
LITERATURE REVIEW
This problem shows similarity to blending problems in operations research because volume distribution throughout the workdays for the best combination of given objective function which contains cost and workload. In the following sections, blending problems features are introduced and show similarity to our problem and how to use it. After that, network features and environment are represented with existing works and it follows with workload feature’s importance and how that means goal programming for the problem. Thus, blending feature was analyzed first as it plays a crucial part to model as it is the key to the supply chain’s aim and it demands to combine with its network constraints and it increases the difficulty to solve without mathematical model solver. Especially, blending problems could be considered as complex as knapsack problem since both of them are about assignment [7]. There is only one difference between knapsack and blending problems which is blending problems are continuous as they are dealing with amount distribution but knapsack problems are binary such as the decision of “take it or leave it”. This difference makes decision variable continuous.
Although blending problem is more about the combination of chemicals but in this problem, volume carried between two classes (low and high volume distribution points) represents chemicals and distribution of volume to days can be seen as products which result with LTL penalty costs and unbalanced workload. For example, Mendez and friends studied oil refinery to optimize its logistics expenses in order to determine best chemical combination according to their production capabilities [8]. Although this study seems different from our problem but most profitable way to distribute production or volume in our case shows the main logic in this problem. 10% 13% 21% 27% 29%
SOURCES OF GREENHOUSE GAS EMISSIONS
© International Logistics and Supply Chain Congress 2017 October 19-20, 2017, Istanbul, Turkey
Another study has shown to model short term balancing importance in refiners according to logistic costs, production capacity and expected the quality of the product. As it results in the final product of blending as well as efficient way to carry under refinery production capacities [9]. This example also supports the importance of logistics and similarity to using blending problem in modeling. However, this also showed a lack of study in blending problem applied in different areas as volume distribution to days does not have a connection with refinery production.
The second part of this study is to analyze the composition of logistic costs and importance of LTL in the supply chain as this study covers balancing the volume among the potential vehicles with the use of fuel efficiency. Therefore, according to one of the recent work of Naoto Katayama and Shigeru Yurimoto, minimizing total line haul cost was aimed and this goal leads them to design efficient design of the logistic network to carry aggregated demand of small points which causes minimizing the number of cross-dock points. However, some cases like covering larger areas might mean inefficient as fuel consumption may rise because of large clusters created [10]. There is also a problem with third party logistics firm as regional deals might prevent to change the larger covers which might contradict. This also shows the importance of partnership strength with third party logistics firms.
Another study of supply chain optimization has searched to optimize transportation network design through simulation as this technique leads to decide warehouse location problem [11]. This aims to decrease their transportation costs including LTL costs and more efficient way with steepest descent algorithm. One of the papers on freight distribution for the daily demand is similar to this study minimizing transportation costs with integral generalized transportation problem on a bipartite graph. In that freight distribution work, rounding and linear programming relaxation techniques are applied and in that problem, user can select their vehicles unlike our problem which basically is solved with GAMS and car selection was based on need rather than user determined selection [12]. This paper shows importance of our work as well as our modeling techniques simplify complicated system to solve the problem. Another study used the goal programming in transportation for different performance measurement techniques. However, this study optimized according to Pareto frontiers and NSGA II method techniques which are heuristic search algorithms [13]. Another goal programming in transportation developed heuristic techniques unlike current transportation model which found the best result for normalized values [14].
There is also another issue to address and it is as important as network features and blending problem. This is load balancing which changes the nature of the problem to goal programming as the problem now has logistic cost minimization as well as workload balancing. As it was a real world problem, this accounts to applicability. This feature is important as it plays balancing the cost of workers as well as it gives the ability to deal with sudden fluctuations of demand which is also another critical point in supply chain and this study. Also, workload balancing can be seen from any areas like distributed computing [15] or assembly line balancing [16]. However, few studies have combined with this feature and cost minimization to solve it as a goal programming which also supports our cases and importance of our work in the example of assembly line balancing with workload balancing and distance [17].
MATHEMATICAL MODEL
The following section is to describe the problem environment and introduce the mathematical model.
This
model is used for general case which ignores national and religious holiday planning. For holiday
cases, this model can be re-run to adjust the distributions days and store planning.
In this study,three-week shipments were considered to determine the effectiveness in short term planning (as well as adaptability against demand fluctuations) and comparison. 5 regions were considered in this problem and pre-selected day for low-level stores are assigned to 2 but other numbers were tested in scenario analysis.
Index:
𝑗 = 𝑊𝑜𝑟𝑘𝑑𝑎𝑦𝑠 (1, … ,6). 𝑖 = 𝑅𝑒𝑔𝑖𝑜𝑛𝑠 (1, … ,5).
© International Logistics and Supply Chain Congress 2017 October 19-20, 2017, Istanbul, Turkey
Constants: 𝐶𝑊𝑖𝑗= 𝑉𝑜𝑙𝑢𝑚𝑒 𝑙𝑒𝑣𝑒𝑙 𝑖𝑛 𝑟𝑒𝑔𝑖𝑜𝑛 − 𝑖′𝑠 ℎ𝑖𝑔ℎ 𝑠𝑎𝑙𝑒′𝑠 𝑐𝑙𝑎𝑠𝑠. 𝐴𝑊𝑖 = 𝑉𝑜𝑙𝑢𝑚𝑒 𝑙𝑒𝑣𝑒𝑙 𝑖𝑛 𝑟𝑒𝑔𝑖𝑜𝑛 − 𝑖′𝑠 𝑙𝑜𝑤 𝑠𝑎𝑙𝑒′𝑠 𝑐𝑙𝑎𝑠𝑠. 𝑎𝑠𝑠𝑖𝑔𝑛𝐷𝑎𝑦 = 𝑛𝑢𝑚𝑏𝑒𝑟 𝑜𝑓 𝑑𝑎𝑦 𝑡𝑜 𝑑𝑖𝑠𝑡𝑟𝑖𝑏𝑢𝑡𝑒. 𝑉𝑐𝑎𝑝1 = 𝑉𝑒ℎ𝑖𝑐𝑙𝑒 − 1 𝑐𝑎𝑝𝑎𝑐𝑖𝑡𝑦. 𝑙𝑒𝑣𝑒𝑙1 = 𝑉𝑒ℎ𝑖𝑐𝑙𝑒 − 1 𝑣𝑜𝑙𝑢𝑚𝑒 𝐿𝑇𝐿 𝑙𝑒𝑣𝑒𝑙. 𝑉𝑐𝑎𝑝2 = 𝑉𝑒ℎ𝑖𝑐𝑙𝑒 − 2 𝑐𝑎𝑝𝑎𝑐𝑖𝑡𝑦. 𝑙𝑒𝑣𝑒𝑙2 = 𝑉𝑒ℎ𝑖𝑐𝑙𝑒 − 2 𝑣𝑜𝑙𝑢𝑚𝑒 𝐿𝑇𝐿 𝑙𝑒𝑣𝑒𝑙. 𝑝𝑒𝑟 = 𝑀𝑖𝑛𝑖𝑚𝑢𝑚 𝑙𝑒𝑣𝑒𝑙 𝑓𝑜𝑟 𝑜𝑟𝑑𝑒𝑟𝑖𝑛𝑔. 𝑀 ≫ 0 Decision Variables: 𝑥𝑖𝑗 = 𝐴𝑠𝑠𝑖𝑔𝑛𝑚𝑒𝑛𝑡 𝑜𝑓 𝑙𝑜𝑤 𝑠𝑎𝑙𝑒 𝑣𝑜𝑙𝑢𝑚𝑒 𝑓𝑜𝑟 𝑟𝑒𝑔𝑖𝑜𝑛 − 𝑖 𝑖𝑛 𝑑𝑎𝑦 − 𝑗. ℎ𝑖𝑗 = 𝐼𝑓 𝐿𝑇𝐿 𝑖𝑠 𝑎𝑠𝑠𝑖𝑔𝑛𝑒𝑑 𝑡𝑜 𝑡ℎ𝑒 𝑣𝑒ℎ𝑖𝑐𝑙𝑒 − 2 𝑓𝑜𝑟 𝑟𝑒𝑔𝑖𝑜𝑛 − 𝑖 𝑖𝑛 𝑑𝑎𝑦 − 𝑗, 1. 𝑂𝑡ℎ𝑒𝑟𝑤𝑖𝑠𝑒, 0. 𝑢𝑖𝑗+ = 𝑎𝑚𝑜𝑢𝑛𝑡 𝑜𝑣𝑒𝑟 𝑠𝑝𝑒𝑐𝑖𝑓𝑖𝑒𝑑 𝑙𝑒𝑣𝑒𝑙 𝑓𝑜𝑟 𝑟𝑒𝑔𝑖𝑜𝑛 − 𝑖 𝑖𝑛 𝑑𝑎𝑦 − 𝑗. 𝑢𝑖𝑗− = 𝑎𝑚𝑜𝑢𝑛𝑡 𝑢𝑛𝑑𝑒𝑟 𝑠𝑝𝑒𝑐𝑖𝑓𝑖𝑒𝑑 𝑙𝑒𝑣𝑒𝑙 𝑓𝑜𝑟 𝑟𝑒𝑔𝑖𝑜𝑛 − 𝑖 𝑖𝑛 𝑑𝑎𝑦 − 𝑗. 𝑧𝑖𝑗 = 𝐼𝑓 𝐿𝑇𝐿 𝑜𝑐𝑐𝑢𝑟𝑠 𝑓𝑜𝑟 𝑟𝑒𝑔𝑖𝑜𝑛 − 𝑖 𝑖𝑛 𝑑𝑎𝑦 − 𝑗, 1. 𝑂𝑡ℎ𝑒𝑟𝑤𝑖𝑠𝑒, 0. 𝑚𝑖𝑗= 𝑛𝑢𝑚𝑏𝑒𝑟 𝑜𝑓 𝑣𝑒ℎ𝑖𝑐𝑙𝑒 𝑡𝑦𝑝𝑒 − 1 𝑓𝑜𝑟 𝑟𝑒𝑔𝑖𝑜𝑛 − 𝑖 𝑖𝑛 𝑑𝑎𝑦 − 𝑗 (𝑖𝑛𝑡𝑒𝑔𝑒𝑟). 𝑑𝑗−= 𝑡𝑜𝑡𝑎𝑙 𝑠ℎ𝑖𝑝𝑚𝑒𝑛𝑡 𝑢𝑛𝑑𝑒𝑟 𝑏𝑎𝑙𝑎𝑛𝑐𝑒𝑑 𝑑𝑒𝑚𝑎𝑛𝑑 𝑖𝑛 𝑑𝑎𝑦 − 𝑗. 𝑑𝑗+= 𝑡𝑜𝑡𝑎𝑙 𝑠ℎ𝑖𝑝𝑚𝑒𝑛𝑡 𝑜𝑣𝑒𝑟 𝑏𝑎𝑙𝑎𝑛𝑐𝑒𝑑 𝑑𝑒𝑚𝑎𝑛𝑑 𝑖𝑛 𝑑𝑎𝑦 − 𝑗. 𝐵𝐶𝑜𝑠𝑡 = 𝑏𝑒𝑠𝑡 𝑐𝑜𝑠𝑡 𝑓𝑜𝑟 𝐿𝑇𝐿 𝑜𝑛𝑙𝑦. 𝑡𝑡 = 𝑜𝑏𝑗𝑒𝑐𝑡𝑖𝑣𝑒 𝑓𝑢𝑛𝑐𝑡𝑖𝑜𝑛. Model: Min. 𝑡𝑡 = ∑6𝑗=1∑𝑛𝑖=1𝑢𝑖𝑗− (1) 𝑉𝑐𝑎𝑝1 ∗ 𝑚𝑖𝑗+ 𝑉𝑐𝑎𝑝2 ∗ ℎ𝑖𝑗∗ 𝑙𝑒𝑣𝑒𝑙2 + 𝑉𝑐𝑎𝑝1 ∗ 𝑙𝑒𝑣𝑒𝑙2 ∗ (1 − ℎ𝑖𝑗) + 𝑢𝑖𝑗+− 𝑢𝑖𝑗− = 𝐶𝑊𝑖𝑗+ 𝑥𝑖𝑗 ∀𝑖, 𝑗 (2) 𝑉𝑐𝑎𝑝2 ∗ (1 − 𝑙𝑒𝑣𝑒𝑙2) ∗ ℎ𝑖𝑗+ 𝑉𝑐𝑎𝑝1 ∗ (1 − 𝑙𝑒𝑣𝑒𝑙1) ∗ (1 − ℎ𝑖𝑗) ≥ 𝑢𝑖𝑗+ ∀𝑖, 𝑗 (3) ∑6𝑗=1𝑥𝑖𝑗= 𝐴𝑊𝑖 ∀𝑖 (4) 𝑧𝑖𝑗∗ 𝑀 ≥ 𝑥𝑖𝑗 ∀𝑖, 𝑗 (5.a) 𝑧𝑖𝑗 ≤ 𝑥𝑖𝑗 ∀𝑖, 𝑗 (5.b) ∑6𝑗=1𝑧𝑖𝑗= 𝑎𝑠𝑠𝑖𝑔𝑛𝐷𝑎𝑦 ∀𝑖 (6) 𝑧𝑖𝑗∗ 𝐴𝑊𝑖∗ 𝑝𝑒𝑟 ≤ 𝑥𝑖𝑗 ∀𝑖, 𝑗 (7) 𝑥𝑖𝑗, 𝑢𝑖𝑗+, 𝑢𝑖𝑗− ≥ 0 ∀𝑖, 𝑗 (8) ℎ𝑖𝑗 , 𝑧𝑖𝑗 ∈ {0,1} ∀𝑖, 𝑗 (9) 𝑚𝑖𝑗≥ 0 & 𝑖𝑛𝑡𝑒𝑔𝑒𝑟. (10)
© International Logistics and Supply Chain Congress 2017 October 19-20, 2017, Istanbul, Turkey
The initial objective function and it minimizes the total amount of LTL is in (1). Decision variables in the objective function is limited with 6 days excluding Sunday and moreover, our initial objective only takes amount under the given limit. Daily LTL amount of assigned volume for regions are determined in (2) and (3). These two equations determine number of 1 which is used in a full capacity and last vehicle is vehicle-1 or vehicle-2 according to vehicle capacity and assignment to that day. Therefore, the last vehicle decides LTL amount under the given limit which is minimized in our objective. All volumes are forced to be sent with the help of the given equation (4). As this problem is based on finding the days which is determined by users, amount order and order day are need to be connected with constraints (5.a) and (5.b). The low class cannot exceed the number of the given limit for freight days. Therefore, number of freight day is controlled with the constraint in (6) (pre-selected assignment number). In case of low level shipments, a minimum level is determined to prevent unrealistic situation for order shipments which is seen in (7). Decision variables features are presented in (8), (9) and (10).
However, the initial model does not represent goal programming, so in order to use it with workload balancing, the following equations must be replaced with the given objective function with new constraints similar to [13]. The initial objective function is used to find BCost decision variable value which is best cost for minimum LTL amount to normalize the first goal as LTL. Thus, the model balances workload and cost at the same time in (11).
Min. 𝑡𝑡 = ∑6𝑗=1∑𝑛𝑖=1𝑢𝑖𝑗−/max (𝐵𝐶𝑜𝑠𝑡, 1) + ∑𝑗=16 (𝑑𝑗++ 𝑑𝑗−)/(∑𝑗=16 ∑𝑛𝑖=1𝐶𝑊𝑖𝑗+ ∑𝑛𝑖=1𝐴𝑊𝑖)/6 (11)
The following equation is used as the total fluctuation from balanced workload (12).
𝑑𝑗+− 𝑑
𝑗−= (∑6𝑗=1∑𝑛𝑖=1𝐶𝑊𝑖𝑗+ ∑𝑖=1𝑛 𝐴𝑊𝑖)/6 − (∑𝑛𝑖=1𝐶𝑊𝑖𝑗+ 𝑥𝑖𝑗) (12)
The following equation is used in scenario analysis to give one day at least between two shipments in (13). This feature can be used as a time for a planner to see fluctuations in demand and prepare for it such as store plays a significant role in the planning phase of ZARA.
𝑧𝑖𝑗+ 𝑧𝑖,𝑗+1≤ 1 ∀𝑖, 𝑗 (13)
SCENARIO ANALYSIS
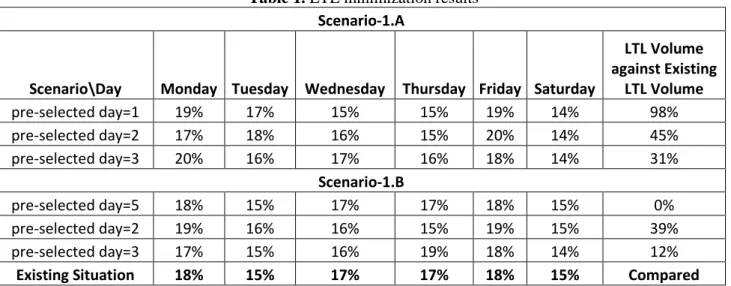
In this phase, the developed model was tested against the different situation and how it reacts. Especially, some constants are re-evaluated against workload and LTL volumes in order to see expectations can be achieved or applicable. First of all, the model was tested only for LTL volume minimization. In the first test, different numbers of allowed shipment day are used with (13) (at least one day between two shipments). The existing situation is current condition and it means shipment in every day.
In table-1, scenario A and B can be seen. Scenario-A results are based on the model with (13) and Scenario-B results are based on the model with (13). In these scenarios, the objective function is only about LTL volume. Results show there is a significant effect of (13) as one day between two shipments mean important factor on LTL. However, there is a high fluctuation between workloads as Monday and Saturday have the highest difference in most of the cases in scenarios that used (13) (scenarios in A) even existing situation seems more balanced. However, scenarios in B which do not use (13) come more balanced and it has found a result that has not got any LTL amount and balanced workload. This supports our cases as our model can improve LTL costs.
© International Logistics and Supply Chain Congress 2017 October 19-20, 2017, Istanbul, Turkey
Table 1. LTL minimization results Scenario-1.A
Scenario\Day Monday Tuesday Wednesday Thursday Friday Saturday
LTL Volume against Existing LTL Volume pre-selected day=1 19% 17% 15% 15% 19% 14% 98% pre-selected day=2 17% 18% 16% 15% 20% 14% 45% pre-selected day=3 20% 16% 17% 16% 18% 14% 31% Scenario-1.B pre-selected day=5 18% 15% 17% 17% 18% 15% 0% pre-selected day=2 19% 16% 16% 15% 19% 15% 39% pre-selected day=3 17% 15% 16% 19% 18% 14% 12%
Existing Situation 18% 15% 17% 17% 18% 15% Compared
Scenario-2 is about goal programming which minimizing fluctuations of workload and LTL amount for their best values in (11). There is a significant change in scenarios in B which do not use (13). This means there are possible options for workload balancing for the model without one day between two shipments. However, Scenarios in A are not affected as scenarios in B (the only day=1 is affected). This also shows the effectiveness of goal programming in larger options. This means significant options can be found such as scenario-2.B of day=5. Scenario-2 results are seen in Table-2.
Table 2. Goal programming scenario results Scenario-2.A
Scenario\Day Monday Tuesday Wednesday Thursday Friday Saturday
LTL Volume against Existing LTL Volume pre-selected day=1 18% 16% 15% 15% 18% 18% 114% pre-selected day=2 17% 15% 16% 15% 17% 19% 57% pre-selected day=3 20% 16% 17% 16% 18% 14% 31% Scenario-2.B pre-selected day=5 17% 15% 17% 16% 18% 17% 0% pre-selected day=2 18% 15% 16% 15% 17% 18% 47% pre-selected day=3 17% 15% 17% 15% 18% 18% 17%
Existing Situation 18% 15% 17% 17% 18% 15% Compared
CONCLUSION
This is a study to understand and exploit supply chain’s weaknesses and create a more resilient environment for business. Now, the supply chain is about efficiency and in order to achieve this goal, this study sought an opportunity and decision support technique was offered. This requires known current state of the business which can be the frequency of need in the store, inventory level or production capacities. Thus, it designs need of product flow for LTL and at the same time, there is another issue to balance the workload for demand capacity which can also provide adaptability as one can consider ZARA’s example. Results show opportunities and able to outperform the existing situation easily. Moreover, this model shows the importance of planning as unplanned results requires 6 days with highest LTL amount and at the same time, planned approach could have achieved zero LTL and balanced workload. These are the main reasons to have upper hand easily and there is also environment issue as transportation has been seen as the second highest reason for greenhouse gas emissions and LTL transportation is the unnecessary burden of transportation. These are reasons to need this kind of work and also simplicity and realistic calculations can provide better insight into the business and more importantly, it can protect the nature.
© International Logistics and Supply Chain Congress 2017 October 19-20, 2017, Istanbul, Turkey
REFERENCES
[1] V. Kaura, C. S. D. Prasad and S. Sharma, "Service quality, service convenience, price and fairness, customer loyalty, and the mediating role of customer satisfaction," International Journal of Bank
Marketing, pp. 404-422, 2015.
[2] M.-K. Kim, S. F. Wong, Y. Chang and J.-H. Park, "Determinants of customer loyalty in the Korean smartphone market: Moderating effects of usage characteristics," Telematics and Informatics, pp. 936-949, 2016.
[3] J. Fernie and L. Sparks, “Logistics and retail management: emerging issues and new challenges in the retail supply chain, Kogan, 2014.
[4] H. L. Lee, " The Triple-A Supply Chain," Harvard Business Review, 2004.
[5] J. D. Schulz, "2017 state of logistics less than truckload," 11 July 2017. [Online]. Available: http://www.supplychain247.com/article/2017_state_of_logistics_less_than_truckload_ltl/LTL. [Accessed 12 August 2017].
[6] EPA, "Sources of Greenhouse Gas Emissions," 2015. [Online]. Available: https://www.epa.gov/ghgemissions/sources-greenhouse-gas-emissions. [Accessed 12 July 2017].
[7] W. L. Winston, Operations Research Applications and Algorithms, Thomson, 2003.
[8] C. A. Mendez, I. H. I. E. Grossmann and P. Kaboré, "A simultaneous optimization approach for off-line blending and scheduling of oil-refinery operations," Computers & chemical engineering, pp. 614-634, 2006.
[9] N. K. Shah. and M. G. Ierapetritou, "Short‐term scheduling of a large‐scale oil‐refinery operations: Incorporating logistics details," AIChE Journa, pp. 1570-1584, 2011.
[10] N. Katayama and S. Yurimoto, "The Load Planning Problem for Less-Than-Truckload Motor: Carriers and a Solution Approach," Developments in Logistics and Supply Chain Management, pp. 240-249, 2016.
[11] M. Amano, T. Yoshizumi and H. Okano, " Freight simulation: the modal-shift transportation planning problem and its fast steepest descent algorithm," in the 35th conference on Winter simulation: driving
innovation, 2003.
[12] B. Engels and R. Schrader, "Freight car dispatching with generalized flows," NETWORKS, vol. 66, no. 1, 2015.
[13] Q. Bai, A. Ahmed, Z. Li and L. S., "A Hybrid Pareto Frontier Generation Method for Trade-Off Analysis in Transportation Asset Management," Computer-Aided Civil and Infrastructure Engineering, vol. 30, no. 3, pp. 163-180, 2014.
[14] J. Zak, "The methodology of multiple criteria decision making/aiding in public transportation," Journal
of Advanced Transportation, vol. 45, no. 1, pp. 1-20, 2011.
[15] V. V. Korkhov, J. T. Moscicki and V. V. Krzhizhanovskaya, " Dynamic workload balancing of parallel applications with user-level scheduling on the grid," Future Generation Computer Systems, pp. 28-34, 2009.
[16] R. Hwang and H. Katayama, "A multi-decision genetic approach for workload balancing of mixed-model U-shaped assembly line systems," International Journal of Production Research, pp. 3797-3822, 2009. [17] J. Wang, M. Gronalt and Y. Sun, "A two-stage approach to the depot shunting driver assignment problem
![Figure 1. Sources of Greenhouse Gas Emission [6].](https://thumb-eu.123doks.com/thumbv2/9libnet/4054394.57391/2.892.176.708.240.505/figure-sources-greenhouse-gas-emission.webp)