DISTRICT DESIGN AND ROUTE PLANNING FOR CUSTOMER-RELATED FIELD OPERATIONS OF NATURAL GAS DISTRIBUTION SYSTEMS: A CASE STUDY
1Gözde Can ATASAGUN, 2Emine AKHÜSEYIN, 3Yakup KARA, 4Ismail KARAOGLAN
1, 2, 4Department of Industrial Engineering, Selçuk University, Konya, Turkey 3YENMAK Inc., Konya, Turkey
1[email protected], 2[email protected], 3[email protected], 4[email protected]
(Geliş/Received: 30.11.2017; Kabul/Accepted in Revised Form: 12.12.2017)
ABSTRACT: Approximately 24% of the world energy requirement is supplied by natural gas. A natural
gas distribution system in a city consists of four main processes, i.e. construction, operating, internal installations, and customer services, which are connected to each other. In this study, customer services processes of the distribution system which are directly related to customers is considered. Mathematical formulations are presented for customer services processes such as district design, route planning and mobile team workload assignment, and applied on one of the authorized natural gas distribution company in Turkey. Performance of the proposed formulations is compared with the current system by means of the number of mobile teams and amount of workloads. The computational studies show that the number of mobile teams of the proposed system is 37% lower than the current system.
Key Words: Mathematical modeling, Natural gas distribution
Doğalgaz Dağıtım Sistemlerinde Müşteriye Bağlı Saha Operasyonları İçin Bölgesel Ayrım ve Rota Planlaması: Bir Örnek Uygulama
ÖZ: Dünya enerji ihtiyacının yaklaşık % 24'ü doğalgazdan karşılanmaktadır. Bir şehirde, doğal gaz
dağıtım sistemi, yapım, işletme, iç tesisat ve müşteri hizmetleri olmak üzere birbirine bağlı dört ana süreçten oluşur. Bu çalışmada, dağıtım sisteminin müşteri ile doğrudan ilişkili olan müşteri hizmetleri süreçleri ele alınmıştır. Bölgesel ayrım, rota planlaması ve mobil ekip iş yükü tahsisi gibi müşteri hizmetleri süreçleri için matematiksel modeller önerilmiş ve Türkiye’de yetkili doğal gaz dağıtım şirketlerinden birisinde uygulanmıştır. Önerilen modellerin performansı, mobil ekip sayısı ve iş yükü miktarı açısından mevcut sistemle karşılaştırılmıştır. Deneysel çalışmalar, önerilen sistemin mobil ekip sayısının mevcut sistemden % 37 daha düşük olduğunu göstermektedir.
Anahtar Kelimeler: Matematiksel modelleme, Doğal gaz dağıtımı INTRODUCTION
Natural gas is a primary energy resource which consists of ethane, methane, propane and butane hydrocarbons. Natural gas is preferred to other fossil fuels because of the low environmental damage, low cost and rapid burning. Approximately 24% of the world energy requirement is supplied by natural gas (Energy Information Administration, 2006).
Turkey is located at the strategic cross roads between the abundant petroleum and natural gas reserves of the Middle / Near East and primary consumers in Europe and America (Kemal Ozturk and Hepbasli, 2004). Besides being an important natural gas transmitter, Turkey is one of the main consumers in Europe/Near East region. The use of natural gas in Turkey has begun in 1976 with the discovery of natural gas resources in Thrace region, and it has remained limited until the first natural
gas import from Union of Soviet Socialist Republics in 1987. Distribution of natural gas in Turkey from 1987 to 2003 has been performed in only a few cities and conducted under the authority of those municipalities. After 2003, the authority of the distribution of natural gas has given to the private sector companies. The number of cities performing natural gas distribution has increased to 72 since 2015.
A natural gas distribution system consists of four main processes which are tightly related to each other. These processes are described as given below:
Construction: Related to the construction of pipeline through the city.
Operating: Includes periodical control, maintenance, repairing the constructed network, and testing the gas-filled network.
Internal Installations: Responsible for the construction, control, maintenance, repairing and gas supply operations for in-building gas installations.
Customer Services: Deal with the general operations such as billing, customer satisfaction, cut off and supply gas, terminating the contract and gas metering.
The distribution company which carries out the above mentioned services is liable to build up, manage and continuously improve the system by the laws. The main purpose of the system is to supply gas to the consumers continuously and safely. All activities which are performed for this purpose are supported by the laws and regulations very strongly.
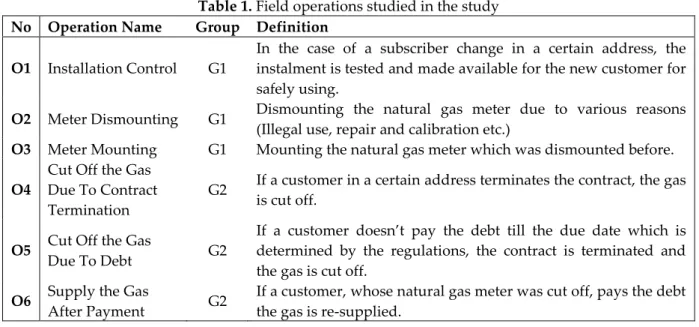
In this study, six different customer-related operations of the distribution system are considered. Effectiveness of these operations is important for sustainability of the customer satisfaction and low operating costs. These operations are given in Table 1.
Table 1. Field operations studied in the study No Operation Name Group Definition
O1 Installation Control G1
In the case of a subscriber change in a certain address, the instalment is tested and made available for the new customer for safely using.
O2 Meter Dismounting G1 Dismounting the natural gas meter due to various reasons (Illegal use, repair and calibration etc.)
O3 Meter Mounting G1 Mounting the natural gas meter which was dismounted before.
O4
Cut Off the Gas Due To Contract Termination
G2 If a customer in a certain address terminates the contract, the gas is cut off.
O5 Cut Off the Gas
Due To Debt G2
If a customer doesn’t pay the debt till the due date which is determined by the regulations, the contract is terminated and the gas is cut off.
O6 Supply the Gas
After Payment G2
If a customer, whose natural gas meter was cut off, pays the debt the gas is re-supplied.
It’s known that a major part of customer complaints about the natural gas services are directly related to these operations. The distribution companies want to reduce these complaints by trying to operate these processes faster. But this situation requires more workers (mobile teams) performing these operations and increases operation costs. The main purpose of this study is to propose a solution methodology to perform these field operations in time which is determined by the laws and regulations with minimum number of mobile teams. For this purpose, mathematical formulations have been developed for planning the customer services and workload assignments of the mobile teams, and applied on one of the authorized natural gas distribution company of Turkey.
The solution methodology includes two main steps. In the first step, the neighborhoods of the city which are provided services by the company are grouped into a number of districts. In the second step, service plan of the mobile teams to the neighborhoods which are grouped into districts are determined. In both steps, the Mixed Integer Programming (MIP) formulations have been used. In the first step, the
problem is considered as district design problem and presented a new MIP formulation considering both spatial contiguity and compactness features which fills an important gap in this area. After that, for each district a multiple travelling salesman problem is described and solved using a MIP formulation from the literature.
The remainder of the paper is structured as follows: Section 2 presents an analysis of the current system and Section 3 shows the problem definition and MIP formulations for both steps. Experimental results are given in Section 4 and concluding remarks are presented in Section 5.
ANALYSIS OF THE CURRENT SYSTEM AND SUGGESTIONS
Operations of distribution system services are separated into two groups, namely G1 and G2 (see Table 1), and these groups are assigned to two different mobile teams, namely E1 and E2. Installation control and mounting meters and dismounting meters operations are in the group of G1 and these operations are carried out by E1 mobile teams. Gas cut off and gas supply operations are in the group of G2 and these operations are carried out by the E2 mobile teams. Company managers believe that such a grouping makes easy to manage the operations and mobile teams.
In the current system, approximately 98% of E1 operations are installation controls. Company managers want to control the instalment in 3 working days after contract. For this purpose, 136 neighbourhoods in the city which are served by the company grouped into 3 districts considering workload and proximity. E1 mobile teams control the installation for two days of the week in each district. For G2 operations, there is no constraint about the districts in a working day. These operations are executed in accordance with the work orders. All of the mobile teams’ workloads and routes to be followed are empirically determined. The company works in 6 days, except Sunday.
At the end of each day, following steps are examined to determine the next day’s mobile team workloads,
i. Demands of customers are collected for each district.
ii. G2 operations for each district and all operations including last two days in the districts which will be operated next day are determined.
iii. The number of mobile teams, workloads and routes for each mobile team are determined using digital maps and empirical data.
iv. The plans are printed to give to the mobile teams at the beginning of the next day.
Note that, the customers of each district are served in two days of the week for G2 operations. Therefore, in Step-ii the demands for the other days are accumulated and served their service days. For example, districts D1, D2 and D3 are served in Monday-Thursday, Tuesday-Friday and Wednesday-Saturday, respectively. At the end of Wednesday, demands of the district D1 for G1 operations which are received in Monday, Tuesday and Wednesday are accumulated and served in Thursday that is the service day of the district D1. Mobile teams have a flexible working time depends on the workloads which starts at 9:00 am and ends at 5:30 pm.
In the current system, city is grouped into 3 districts considering closeness neighbourhoods from each other. The number of neighbourhoods and their workloads (average number of operations) in each district are shown in Table 2.
Table 2. Workloads in each district
Districts Number of neighbourhoods Average workload
District 1 72 4,850
District 2 37 4,702
District 3 27 5,830
Totally, there are 123,777 natural gas subscribers in the neighborhoods which consume natural gas. The number of subscribers varies between 157 and 12,376 depends on the size and development of the neighborhood. The difference in the number of the subscribers affects the amount of demand.
The new system should be designed considering the following weaknesses of the current system, legislation constraints and policies, and expectations of company managers.
Empirically determined workloads and routes cause several problems such as load deviation between mobile teams, high routing costs etc. Moreover, mobile teams may change the routes according to their own empirical data and may use their new routes. So these changes may cause deviations on the time which is informed to the customer about starting the processes. If the time changes, the mobile teams will arrive the customers early or late. Early arrive causes that some customers are not at home and teams have to wait for the customers or revisit the customer later. On the other hand, lateness causes customer dissatisfaction, since they maybe are no home too. Therefore, it is suggested that determination of districts, assignments of workloads to the mobile teams and defining of corresponding routes should be determined using specific solution methodologies and should not be changed through the day.
Mobile teams are divided into two groups. The first group (E1) carries out the operations in G1 group (i.e. installation control, mounting and dismounting gas meters) and the second group (E2) carries out the operations in G2 group (i.e. cut off and supply of gas). E1 mobile teams consist of technicians but E2 mobile teams are not qualified for the operations in G1 group. This grouping requires more mobile teams, investment (purchasing new vehicles) and operational costs (routing cost including fuel cost). In the proposed system, it is suggested that one type of mobile teams will be assigned to all operations instead of two different types of mobile teams.
Grouping the neighbourhoods into three districts and each district’s installation control (O1) operations for two days of the week are continued in the proposed system. However neighbourhoods will be re-grouped by smoothing workload distributions. O1, O3, O4 and O6 operations will be performed in 6 days, except Sunday. O2 and O5 operations will be performed in weekdays. Mobile teams have to drive away from the company at 08.30 and drive back to the company at 5:30 pm. Workloads and routings of the each mobile team have to be determined by the minimizing total number of mobile teams.
DEFINITION OF THE PROBLEMS FOR THE NEW SYSTEM
In this section we define the problem that determining the number of mobile teams and related routes under the restrictions given in previous section with minimum cost. To achieve this goal, we divide the problem into two sub-problems which are described in detail as given in the following subsections.
Districting Problem
In the literature, the problem of dividing a district into smaller sub-districts and assignment of neighborhoods into these sub-districts by minimizing the population difference among the sub-districts is called Political Districting Problem (PDP). Some of the application areas of PDP in practice can be found in electoral district design, sales territory design, power meter reading, designing the local authority services such as street sweeping, garbage collection etc. (Tasn{di, 2011; Ricca et al., 2013) The PDP is formally defined as follows.
Let ( ) be a connected graph where is the set of nodes (neighborhoods) and *( ) + is the set of edges that represent connectivity of neighborhoods i.e. there is an arc between two neighborhoods sharing at least one common border. Various attributes are associated with each node summarized as given below:
geographical coordinates of the center of the districts ( )
geographical coordinates of the boundaries of the districts ( )
The PDP is to determine the predefined number of groups (ND) of neighborhoods (or territories, counties, townships) that minimizes some given measures such as population balance (all districts should have nearly the same populations) and/or compactness (each district closely and neatly packed together, thus a round-shaped district is deemed to be acceptable, while an octopus-or an eel-like one is not) under following restrictions:
Integrity: Each neighborhood cannot be split between two or more districts.
Contiguity: The neighborhood units of each district should be geographically contiguous, that
is, one can walk from any point in the district to any other point of it without ever leaving the district.
PDP has been studied for 50 years and numerous solution techniques have been developed for solving the problem. We refer the interested readers for the solution techniques to the review papers of Duque et al. (2007), Tasn{di (2011) and Ricca et al. (2013). We also refer to the Song et al. (2013) for the variety of common measures of urban land use mix.
Because of the computational complexity of the PDP, classical heuristic approaches and meta-heuristic approaches have been successfully implemented to the problem. Ricca and Simone (2008) have developed four different meta-heuristic techniques (namely Multistart Descent Search, Tabu Search, Simulated Annealing, and Old Bachelor Acceptance) and evaluated the performance of the algorithms on five Italian Regions where the number of the districts varies from 246 to 1208. Bozkaya et al. (2011) have proposed a decision support system including multi-criteria mathematical model, tabu search and geographical information system to design the electoral district design for the city of Edmonton. Royuela and Duque (2013) have considered the identification of housing market segmentation and proposed a spatially constrained clustering heuristic for the problem. This heuristic includes the problem specific initial solution construction procedure and tabu search as a local search procedure. The heuristic is applied to the housing market in the city of Barcelona (Spain).
In addition to heuristic methods, there is a considerable amount of paper using a mathematical modelling approach as a solution method for the PDP in the literature. These models can be grouped following modelling approaches;
Location approach: These papers consider the PDP as a warehouse location-allocation problem
(WLAP) and use the modelling approaches for the WLAP to develop the model for the PDP (Weaver and Hess, 1963; Hess et al., 1965; George et al., 1997; Salazar-Aguilar et al., 2011b; Salazar-Aguilar et al., 2012; Ríos-Mercado and López-Pérez, 2013; Salazar-Aguilar et al., 2013). In these models, predefined number of districts is selected as the center of the territories and other districts are assigned to these territories.
Set Partitioning Approach: In this approach, feasible combinations of districts are determined and
some of them are selected using set partitioning formulation (Garfinkel and Nemhauser, 1970; Nygreen, 1988; Mehrotra et al., 1998). The main difficulty for this approach is to determine the feasible combination of districts since the number of them can be huge. Therefore, the solution time of the methodology is considerably high.
Network Flow Approach: The PDP is converted to network flow problem by extending the current
graph (Nemoto and Hotta, 2003). Then, the problem is reformulated using standard network flow models and solved using commercial optimization software. Although, there is no experimental result provided by the authors (Nemoto and Hotta, 2003), it can be easily observed that the network extension is a major weakness in this approach.
Quadratic Modelling Approach: Li et al. (2007) have proposed a quadratic model for the PDP by
considering population equality and compactness. The authors applied the formulation for the design of the congressional districts of the State of New York having 62 territories and 29 districts. Salazar-Aguilar et al. (2011a) have developed another quadratic model for the PDP. The authors have also proposed new valid inequalities to strength the model and a branch-and-cut procedure to obtain optimal solutions. Experimental results have shown that the solution time of the algorithm is significantly lower than other models especially for the larger instances.
In PDP, one of the main difficulties is determination of a compact shape of districts (compactness). In most of the papers, the authors consider the distance between centers of districts ( ), and try
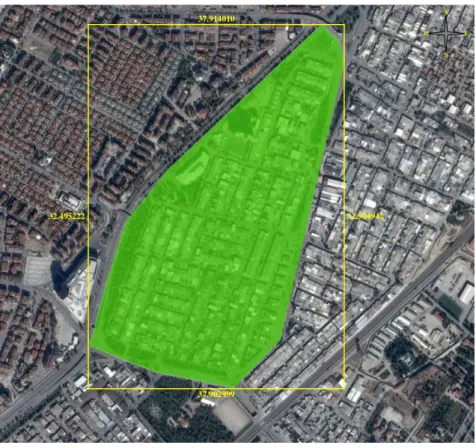
to minimize the sum of the distances between district pairs (Aguilar et al., 2011b; Salazar-Aguilar et al., 2012; Ríos-Mercado and López-Pérez, 2013; Salazar-Salazar-Aguilar et al., 2013) or minimize the maximum distance between district pairs (Salazar-Aguilar et al., 2011b; Salazar-Aguilar et al., 2012; Ríos-Mercado and López-Pérez, 2013; Salazar-Aguilar et al., 2013). However, there is some deficiency for this approach. Consider the neighborhood in city as illustrated in Figure 1.
Figure 1. A sample neighborhood in city
The shape of this district is amorphous and determining the center point of the district ( ) is difficult, therefore the miscalculation of distance between districts is possible. In order to eliminate this deficiency, we developed a new calculation scheme for compactness as the difference between Northernmost ( ) and Southernmost ( ) coordinates (i.e. latitudes) and Westernmost ( ) and Easternmost ( ) coordinates (i.e. longitudes).
To define the model, we first expand the graph with only one node (base location of the company) as follows: Let ̅ ( ̅ ̅) be a connected graph where ̅ * + is the set of nodes in which “0” and represent the base location of the company and neighborhoods, respectively, and ̅ *( ) ̅+ is the set of edges represent connectivity of neighborhoods. The edge set ̅ is composed of the original edge set ( ) and edges connecting the base location and all neighbors ( ̅ ).
The decision variables and the proposed formulation which is inspired by a flow based formulation for the location routing problem (Karaoglan et al., 2012) are as follows:
Decision Variables: { ( ( ) ̅) { ( ) 37.914010 37.902999 32.495222 32.504942 N S E W
: Temporary variable to control the workload-balance among districts ( ( ) ̅)
̅ : The northernmost coordinate of neighborhood units which are assigned to district q ( )
̅ : The southernmost coordinate of neighborhood units which are assigned to district q ( )
̅ : The easternmost coordinate of neighborhood units which are assigned to district q ( ) ̅ : The westernmost coordinate of neighbourhood units which are assigned to district q (
)
The formulation of the mathematical model as follows:
Model: Minimize ( )( ) (1) Minimize ( )(( ) ( )) (2) Subject To: ∑ (3) ∑ (4) ∑ ∑ (5) (6) ∑ ∑ (7) ∑ (8) ∑ (9) (10) ̅ ( ) (11) ̅ ( ) (12) ̅ ( ) (13) ̅ ( ) (14) * + (15) * + (16) ̅ ̅ ̅ ̅ (17) (18)
where is relatively large number and is set to zero when ( ) ̅. The first objective function
(1) minimizes the maximum workloads among districts. Similarly, the second objective function (2) minimizes the maximum compactness measure which is calculated as the sum of the differences between northernmost/southernmost and easternmost/westernmost coordinates.
Constraint (3) ensures that the number of districts must be equal to the predefined number of districts. Constraint set (4) ensures that each neighborhood unit is associated with depot or another neighborhood unit.
Constraint sets (5)-(7) are flow conservation constraints and define the workload of districts. Constraint set (5) guaranties that the difference between incoming and outgoing arcs is equal to the workload (number of dwelling) for each district. The role of the constraint set (6) is to eliminate the positive flow on unselected connections, and constraint (7) ensures the outgoing workload from the base location is equal to the total workload.
Constraint sets (8)-(10) organize the assignment of nodes and feasible connectivity of districts. Each node must be assigned to one and only one district by constraint set (8). While, constraint set (9) implies that two neighborhood units are assigned to the same district when they are connected, constraint set (10) ensures that the two different neighborhood units leaving from the depot as different branches are not assigned to the same district.
Constraint sets (11)-(14) evaluate the endpoint of the districts for each direction (i.e. north, south, west and east) for each district.
Finally, constraint sets (15)-(18) are known as integrality constraints which define the nature of the decision variables.
As can be seen easily, because of the maxi-min structure objective functions (1) and (2) the model is non-linear. In order to linearize the model, the following additional variables and constraints are included:
Additional Decision Variables:
: Maximum workload amongst districts : Maximum compactness amongst districts
Model: Minimize (19) Minimize (20) Subject To (3)-(18) and (21) ( ) ( ) (22) (23)
The model has a multi objective structure and several solution methodologies can be used to solve it (i.e. sequential solution, normalization of objective functions to a single one). In this paper we solved this model in two stages. At the first stage, the model was solved by minimizing the maximum workloads among districts (i.e. equation (19)). At the second stage, a new constraint is added to the model using the optimal solution of the first stage ( ) as given below;
(24)
Constraint (24) gives flexibility for the maximum workload to obtain more compact districts.
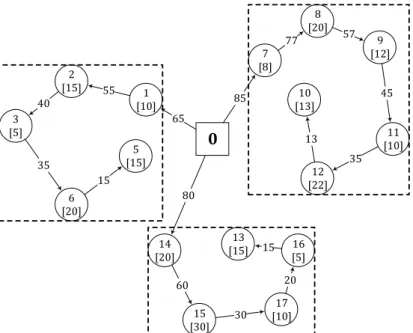
The network representation of the case study can be found in Figure 2. In this sample includes 17 neighborhood having demand (number of operation for the particular day) between 5 and 30 (the number in brackets). The solution gives us there are three districts whose total demands are ,
and , respectively.
Figure 2. The network representation for a sample problem
2 [15] 3 [5] 1 [10] 6 [20] 13 [15] 10 [13] 8 [20] 9 [12] 11 [10] 12 [22] 5 [15] 16 [5] 17 [10] 14 [20] 15 [30] 7 [8]
0
40 35 55 65 15 85 77 57 45 35 13 60 80 30 20 15Route Planning Model
The problem of assigning daily operations to mobile teams with the objective of minimizing the number of mobile teams and defining the routes of teams corresponds to "travelling salesman problem with side constraints" in the literature. The proposed model for route planning of mobile teams is developed based on the model presented by Kara and Bektaş (2006). The proposed model is given below:
Indices:
: number of nodes
: neighborhood unit
Parameters:
: processing time of neighbourhood unit
: workday length
: transition time from neighborhood unit to neighbourhood
Decision Variables:
{
: time to start task at neighborhood unit i : total number of mobile team
Model: Minimize ∑ ∑ (25) ∑ (26) ∑ (27) ∑ (28) ∑ (29) ( ( )) ( ) (30) ( ) (31) * + (32) (33) The objective function (25) minimizes the total time. Constraint sets (26) and (27) identify the number of mobile team leaving and entering from the base location. Constraint sets (28) and (29) ensure that the numbers of entering and leaving arcs to each neighborhood units are one. Constraint sets (30) and (31) are called as subtour elimination and time constraint. Finally, constraint sets (32) and (33) are integrality constraints.
The first four constraints define the number of mobile teams and ensure that each neighborhood unit is visited once. The remaining constraints are known as Miller-Tucker-Zemlin subtour elimination constraints in the literature (Miller et al., 1960).
The proposed mathematical models are the main novelty and contribution of this study for the literature. Although the models are proposed based on the necessity of the natural gas industry, they can easily be applied to other industries such as electricity distribution, water distribution, telecommunication, etc.
COMPUTATIONAL RESULTS
This section presents our computational results to investigate the performance of the proposed formulation. The state-of-the-art LP/MIP solver CPLEX (version 10.2) is used to solve the MIP
formulation. We used the default CPLEX parameters to solve the formulation, and the total computation time for CPLEX has been limited to one hour (3600 s). All experiments were performed on computer equipped with 2.4 GHz and 2 GB memory.
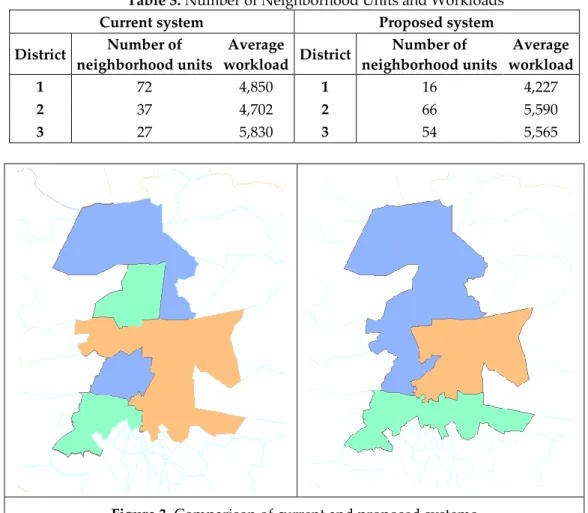
The current system and proposed system are compared with workload balance and number of mobile teams required. For these systems, the number of neighbourhood units and number of workloads are shown in Table 3 and graphical representation can be found in Figure 3.
Table 3. Number of Neighborhood Units and Workloads
Current system Proposed system
District Number of neighborhood units Average workload District Number of neighborhood units Average workload 1 72 4,850 1 16 4,227 2 37 4,702 2 66 5,590 3 27 5,830 3 54 5,565
Figure 3. Comparison of current and proposed systems
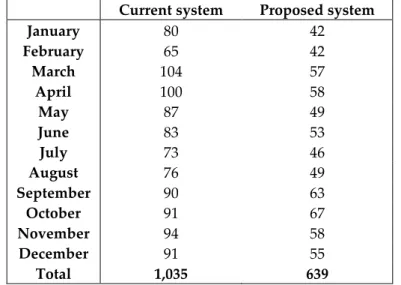
According to these results the maximum workload is found as 5,590 while it was 5,830 for the current system. The required number of mobile teams is also compared with the current and proposed system and the results are shown in Table 4. According to the required number of mobile teams, current system needs to 1,035 teams×month while for the proposed system it is identified as 639 teams×month. These results show that the proposed system requires less workforces than the current system requires.
Table 4. Comparison of the number of mobile teams required (teams×month) Current system Proposed system
January 80 42 February 65 42 March 104 57 April 100 58 May 87 49 June 83 53 July 73 46 August 76 49 September 90 63 October 91 67 November 94 58 December 91 55 Total 1,035 639 CONCLUSIONS
In this study, we proposed new mathematical models for the workload balance and route planning of mobile teams under the time constraints which is identified by the law and regulations about the customer services in natural gas system. The proposed system is implemented on a natural gas distribution company in Turkey.
Solution of the problem is performed in two stages. At the first stage, 136 neighborhood units which are served by the company are grouped into three districts. The proposed mathematical models fill an important gap in the literature with regard to compactness and smoothness. The second stage is related to assigning mobile teams to districts to planning services using the mathematical model of multiple travelling salesman problem.
The computational results show that the proposed system is well suited for the real-life usage. The computational effort, compared with the current system by means of the number of mobile teams, determining the districts and number of workloads. The computational results show that the number of mobile teams of proposed system is 37% lower than the current system.
REFERENCES
Bozkaya, B., Erkut, E., Haight, D., Laporte, G., 2011, "Designing New Electoral Districts for the City of Edmonton", Interfaces, Vol. 41 (6), pp. 534-547.
Duque, J. C., Ramos, R., Suriñach, J., 2007, "Supervised Regionalization Methods: A survey", International
Regional Science Review, Vol. 30 (3), pp. 195-220.
Energy Information Administration, 2006, Energy Information Administration, International Energy Outlook. Chapter 4: Natural Gas p.
Garfinkel, R. S., Nemhauser, G. L., 1970, "Optimal Political Districting by Implicit Enumeration Techniques", Management Science, Vol.16 (8), pp .B495-B508.
George, J. A., Lamar, B. W., Wallace, C. A., 1997, "Political District Determination using Large-Scale Network Optimization", Socio-Economic Planning Sciences, Vol. 31 (1), pp. 11-28.
Hess, S. W., Weaver, J. B., Siegfeldt, H. J., Whelan, J. N., Zitlau, P. A., 1965, "Nonpartisan Political Redistricting by Computer", Operations Research, Vol. 13 (6), pp. 998-1006.
Kara, I., Bektas, T., 2006, "Integer Linear Programming Formulations of Multiple Salesman Problems and İts Variations", European Journal of Operational Research, Vol. 174 (3), pp. 1449-1458.
Karaoglan, I., Altiparmak, F., Kara, I., Dengiz, B., 2012, "The Location-Routing Problem with Simultaneous Pickup and Delivery: Formulations and a Heuristic Approach", Omega, Vol. 40 (4), pp. 465-477.
Kemal Ozturk, H., Hepbasli, A., 2004, "Natural Gas Implementation in Turkey. Part 2: Natural Gas Pipeline Projects", Energy Sources, Vol. 26 (3), pp. 287-297.
Li, Z., Wang, R., Wang, Y., "A Quadratic Programming Model for Political Districting Problem", In
Proceedings of the First İnternational Symposium on Optimization and System Biology (OSB), Beijing,
China, August 8–10, 2007.
Mehrotra, A., Johnson, E. L., Nemhauser, G. L., 1998, "An Optimization Based Heuristic for Political Districting", Management Science, Vol. 44 (8), pp. 1100-1114.
Miller, C. E., Tucker, A. W., Zemlin, R. A., 1960, "Integer Programming Formulations and Travelling Salesman Problems", Journal of the Association of Computing Machinery, Vol. 7, pp. 326-329.
Nemoto, T., Hotta, K., 2003, "Modelling and Solution of the Problem of Optimal Electoral Districting",
Communications of the OR Society of Japan, Vol. 48, pp. 300–306.
Nygreen, B., 1988, "European Assembly Constituencies for Wales - Comparing of Methods for Solving a Political Districting Problem", Mathematical Programming, Vol. 42 (1-3), pp. 159-169.
Ricca, F., Simeone, B., 2008, "Local Search Algorithms for Political Districting", European Journal of
Operational Research, Vol. 189 (3), pp. 1409-1426.
Ricca, F., Scozzari, A., Simeone, B., 2013, "Political Districting: From Classical Models to Recent Approaches", Annals of Operations Research, Vol. 204 (1), pp. 271-299.
Ríos-Mercado, R. Z., López-Pérez, J. F., 2013, "Commercial Territory Design Planning with Realignment and Disjoint Assignment Requirements", Omega, Vol. 41 (3), pp. 525-535.
Royuela, V., Duque, J. C., 2013, "HouSI: Heuristic for Delimitation of Housing Submarkets and Price Homogeneous Areas", Computers, Environment and Urban Systems, Vol. 37 (1), pp. 59-69.
Salazar-Aguilar, M. A., Ríos-Mercado, R. Z., Cabrera-Ríos, M., 2011a, "New Models for Commercial Territory Design", Networks and Spatial Economics, Vol. 11 (3), pp. 487-507.
Salazar-Aguilar, M. A., Ríos-Mercado, R. Z., Gonz{lez-Velarde, J. L., 2011b, "A Bi-Objective Programming Model for Designing Compact and Balanced Territories in Commercial Districting", Transportation Research Part C: Emerging Technologies, Vol. 19 (5), pp. 885-895.
Salazar-Aguilar, M. A., Ríos-Mercado, R. Z., Gonz{lez-Velarde, J. L., Molina, J., 2012, "Multiobjective Scatter Search for a Commercial Territory Design Problem", Annals of Operations Research, Vol. 199 (1), pp. 343-360.
Salazar-Aguilar, M. A., Ríos-Mercado, R. Z., Gonz{lez-Velarde, J. L., 2013, "GRASP Strategies for a Bi-Objective Commercial Territory Design Problem", Journal of Heuristics, Vol. 19 (2), pp. 179-200. Song, Y., Merlin, L., Rodriguez, D., 2013, "Comparing Measures of Urban Land Use Mix", Computers,
Environment and Urban Systems, Vol. 42, pp. 1-13.
Tasn{di, A., 2011, "The Political Districting Problem: A survey", Society and Economy, Vol. 33 (3), pp. 543-554.
Weaver, J. B., Hess, S. W., 1963, "A Procedure for Nonpartisan Districting: Development of Computer Techniques", The Yale Law Journal, Vol. 73 (2), pp. 288-308.