International Journal of
Intelligent Systems and Applications in Engineering
ISSN:2147-67992147-6799 www.ijisae.org Original Research Paper
Diagnosis of Mesothelioma Disease Using Different Classification
Techniques
Kemal Tutuncu*
1, Ozcan Cataltas
1Accepted : 11/07/2017 Published: 31/07/2017 DOI: 10.1039/b000000x
Abstract: Mesothelioma, which is a disease of the pleura and peritoneum, is an asbestos-related environmental disease in undeveloped
countries. Although the incidence of this disease is lower than that of lung cancer, the reaction it creates in society is very high. In this study, 9 different classification algorithms of data mining were applied to the Mesethelioma data set obtained from real patients in Dicle University, Faculty of Medicine and loaded into UCI Machine Learning Repository, and the results were compared. When the obtained results were examined, it has been seen that Artificial Neural Network (ANN) had %99.0740 correct classification ratio.
Keywords: Artificial Neural Network, Classification Algorithms, Classification Ratio, Data Mining, Mesothelioma Disease
1. Introduction
Malignant mesothelioma (MM) is very aggressive tumors of the pleura. These tumors are associated with exposure to asbestos, as well as with simian 40 virus infections and genetic predisposition. Molecular mechanisms and rural life may also be effective in the development of mesothelioma. Soil mixtures containing asbestos are mainly found in Turkey and Greece.
Along with the development of computer technologies, the amount of data that is being used every day is rapidly growing. According to an estimate, the amount of data in the world is doubled every 20 months [1]. In the past decade, data mining has been disciplined in analyzing data to gain useful and meaningful information, and has become a focus of attention in the academic field as well as in industry, economics, and business circles. Data mining methods used in many fields such as health, basic sciences, banking, finance, market research have many algorithms [2].
The purpose of data mining is to extract information that can be meaningful, confidential and useful by analyzing large data sets. The information extracted from the data set studied has an accuracy degree and is not deterministic information. The success of the algorithms used by the criterion such as accuracy, precision, sensitivity and f-criterion which determine the performance grades of the generated models.
Although evaluation of data mining algorithms in comparison with empirical means has been done in all scientific studies, there is criticism that such studies in academic literature will not produce objective and definite results [3]. These criticisms are due to the fact that the model performances generated by the users who are implementing the steps such as data pre-processing, parameter selection, test and learning clusters applied at the steps of modelling are based on the user who performs the application. Another criticism is that comparisons of applications in academic
studies where a new algorithm is compared to existing algorithms do not result in an objective result with the developer's bias. The final criticism is that the most majority of the comparative studies done in the academic literature do not use real data, and thus the implemented evaluations have not produced the correct results [4]. Despite all these criticisms, the necessity of comparison of algorithms has been accepted as a common view, and has taken place in academic studies and current practice in terms of implementation and development.
There are different studies in the literature to compare data mining algorithms. Some of these studies are based on the acceptability of the developed algorithm by comparing it with previous algorithms using different data sets.
Compared to different data mining classification algorithms within the scope of the European Stat Logs project, a comprehensive study has been conducted to find out which algorithms better to meet the industry needs in the work called “Machine Learning, Neural and Statistical Classification”. In the study, statistical, machine learning and ANN methods were compared on different data sets. As a result, it is emphasized that different algorithms produce better models in different data sets [5].
Other similar comparative studies have achieved different results [6,7,8,9,10,11].
In this study different classification algorithms of data mining have been used to diagnose Mesothelioma disease. A comparison of these algorithms for this specific data set has been implemented. This paper is organized as follows. In section 2, brief information is presented about the classification algorithms of this study. In section 3, the properties of Mesothelioma dataset is explained. In section 4, the comparative analysis of the results obtained is given. In section 5, a general evaluation of the study and some suggestions are presented.
2. Theoretical Background
In this study, 9 different classifying algorithms of data mining were used. Short information about each of the classifying algorithms namely J48, Bayes Net, SMO, LMT, Logistic, Multi Class Classifier, Random Committee, PART and ANN will be mentioned in the following paragraphs.
_______________________________________________________________________________________________________________________________________________________________________________________________________________________________________________________________________________________________________________________________
1 Selcuk University, Faculty of Technology, Electrical and Electronics
Engineering, Konya, Turkey
* Corresponding Author: Email: [email protected]
Note: This paper has been presented at the 5th International Conference on Advanced Technology & Sciences (ICAT'17) held in Istanbul (Turkey), May 09-12, 2017
2.1. J48
The J48 classifier is a simple version of C4.5 decision trees that produces binary trees. Decision trees approach is the most useful method in classification problems. With this technique, a tree that models the classification process is constructed. When the tree is built, the tree is applied to each group in the database and results in the classification of that group. J48 method can be produce pruned or unpruned C4.5 decision tree [12,13].
2.2. Bayes Net
A Bayesian network (BN) is a directed acyclic graph (DAG) where nodes are random variables and directed edges represent probability dependencies among variables. Each node and its parents are associated with a conditional probability distribution (CPD), which quantifies the effect of the parents on the node. A BN provides a compact representation of a joint probability distribution over the set of random variables [14].
2.3. SMO
SMO implements John Platt's sequential minimal optimization algorithm for training a support vector classifier. This implementation globally replaces all missing values and transforms nominal attributes into binary ones. It also normalizes all attributes by default. (In that case the coefficients in the output are based on the normalized data, not the original data — this is important for interpreting the classifier.) Multi-class problems are solved using pairwise classification (1-vs-1 and if logistic models are built pairwise coupling according to [15]). To obtain proper probability estimates, use the option that fits logistic regression models to the outputs of the support vector machine. In the multi-class case the predicted probabilities are coupled using Hastie and Tibshirani's pairwise coupling method [16,17,18].
2.4. LMT
The Logistics Model Tree (LMT) is a standard decision tree structure with logistic regression functions on the leaves. As in traditional decision trees, a test of attributes is associated with each inner node. For a nominal feature of K, the node has k child nodes, and the samples are sorted into k branches depending on the attribute value. For numerical attributes, the node has 2 child nodes and the test consists of comparing the attribute value and a threshold value. If attribute value of the instance is less than threshold value than it sorted down left branch. Otherwise, if attribute value of the instance is more than threshold value than it sorted down right branch [19].
2.5. Logistic
It is a class for building and using a multinomial logistic regression model with a ridge estimator. There are some modifications, however, compared to the paper of leCessie and van Houwelingen [20,21]:
If there are k classes for n instances with m attributes, the parameter matrix B to be calculated will be an m*(k-1) matrix. In order to find the matrix B for which L is minimised, a Quasi-Newton Method is used to search for the optimized values of the m*(k-1) variables. Note that before we use the optimization procedure, we 'squeeze' the matrix B into a m*(k-1) vector. Although original Logistic Regression does not deal with instance weights, we modify the algorithm a little bit to handle the instance weights.
can be converted to multi-class classification by two approaches. One is to combine a number of two-category classification SVMs in a certain manner to form a multi-class classifier, while the other is to directly solve a multi-class classification function with the training samples [22]. The decision-making functions of the latter are difficult to fulfil. Training and testing processes are also long processes. So the first method is more practical and various algorithms are derived from this method: the one-against-rest method, the one-against-one method [23].
2.7. Random Committee
Class for building an ensemble of randomizable base classifiers. Each base classifiers are built using a different random number seed (but based on the same data). The final prediction is a straight average of the predictions generated by the individual base classifiers [24].
2.8. PART
This class is a class that creates a PART decision list. In each iteration, it builds a partial C4.5 decision tree and transforms the best leaf into a rule [16].
2.9. Artificial Neural Network
ANN is an information technology that is developed by inspiring the human brain's information processing technique. ANN mimics the way a simple biological nervous system works. Imitated nerve cells contain neurons, which connect to each other in various ways to form a network. These networks have the capacity to learn, memory, and reveal the relationship between the hosts. In other words, ANN normally provide solutions to problems that require a person's natural abilities to think and observe. The basic reason for a person to be able to produce solutions for the problems that require his / her ability to think and observe is the ability to learn by living or trying to have the human brain and therefore the human being [25].
In biological systems, learning occurs through the adjustment of synaptic connections between neurons. That is, people begin their learning process from their birth to life. In this process, the brain is continuously developing. As we live and experience, synaptic connections are established and even new connections are
established. Learning occurs at this point. This also applies to ANN. Learning happens by using examples through training; In other words, the realization occurs by processing the input / output data, that is, by using the training algorithm to repeatedly adjust the connection weights until a convergence is achieved.
ANNs are mathematical systems consisting of many processing units (neurons) connected together in a weighted fashion. A transaction unit is an equation that is often referred to as a transfer function. This processing unit receives signals from other neurons;
neurons and are interconnected in a network; This structure also constitutes neural networks [25].
At the heart of neural computation are distributed, adaptive and nonlinear processing concepts. ANN operate differently than traditional processors. In conventional processors, a single central processing unit performs each movement in turn. ANN consist of a large number of simple transaction units, each of which deals with a piece of a major problem. In its simplest form, a processing unit weighs a set of weights, transforms nonlinearly, and generates an output value. At first glance, the way the work units’ work is misleading. The power of neural computation comes from the intensive connection between the processing units that share the total processing load. In these systems, healthier learning is provided by the method of back propagation [25].
In most ANN, neurons with similar characteristics are structured in layers and the transfer functions are run simultaneously. Almost all networks have data-receiving neurons and output-generating neurons.
The mathematical function, the main element of ANN, is shaped by the architecture of the network. More specifically, the basic structure of the function determines the size of the weights and the operation of the processing elements. The way in which ANN relate behaviour, that is, input and output, is first influenced by the transfer functions of neurons, how they are connected to each other, and the weights of these connections [25].
3. Material and Methods
In this study, data set named “Mesothelioma disease data set” which was prepared at Dicle University Faculty of Medicine and loaded on UCI (University of California, Irvine) Machine Learning Repository database was used.
This dataset contains 324 patient records. Each record has 34 features. These are; Age, gender, city, asbestos exposure, malignant mesothelioma type of MM, duration of asbestos exposure, diagnosis method, side the duration of symptoms, respiratory distress (dyspnea), ache on chest, weakness, habit of cigarette, performance status (performance) (White blood cell count WBC), hemoglobin (HGB), platelet count PLT, sedimentation, blood lactic dehydrogenase LDH, alkaline phosphatase ALP, (Total protein), albumin (albumin), glucose, pleural lactic dehydrogenase, pleural protein, pleural albumin, pleural glucose, Pleural effusion, pleural thickness on tomography, pleural level of acidity pH and C-reactive protein (C-reactive protein, CRP). There is also a variable for each record that represents the diagnostic class. Of 324 records, 228 were identified as healthy and 96 as patients [26].
ANN classification is implemented by Alyuda NeuroIntelligence 2.2. whereas others were implemented by WEKA (The University of Waikato).
4. Experimental Study
First, the J48 algorithm, a C4.5 decision tree type, was applied to the Mesothelioma dataset and the obtained results are shown in Table 1. As can be seen from Table 1, 283 of the 324 samples in the related database were correctly classified. Thus, the correct classification ratio of J48 algorithm is %87.3457.
Table 1: Accuracy Ratio of J48 Application
Parameters Value Accuracy Ratio
Correctly Classified Instances 283 % 87.3457
Kappa statistic 0.6938
Mean absolute error 0.1419
Root mean squared error 0.3427 Relative absolute error % 33.9784 Root relative squared error % 75.0394 Total Number of Instances 324 Weighted
Average TP
Rate FP Rate Precision Recall F-Measure ROC Area 0.873 0.186 0.872 0.873 0.873 0.852
The Bayes Net algorithm, was applied to the Mesothelioma dataset and the obtained results are shown in Table 2. As can be seen from Table 2, 286 of 324 samples in the related database were correctly classified. Thus, the correct classification ratio of Bayes Net algorithm is %88.2716.
Table 2: Accuracy Ratio of Bayes Net Application
Parameters Value Accuracy Ratio
Correctly Classified Instances 286 % 88.2716
Kappa statistic 0.7045
Mean absolute error 0.1423
Root mean squared error 0.2691 Relative absolute error % 34.0761 Root relative squared error % 58.9315 Total Number of Instances 324 Weighted
Average TP
Rate FP Rate Precision Recall F-Measure ROC Area 0.883 0.212 0.881 0.883 0.879 0.954
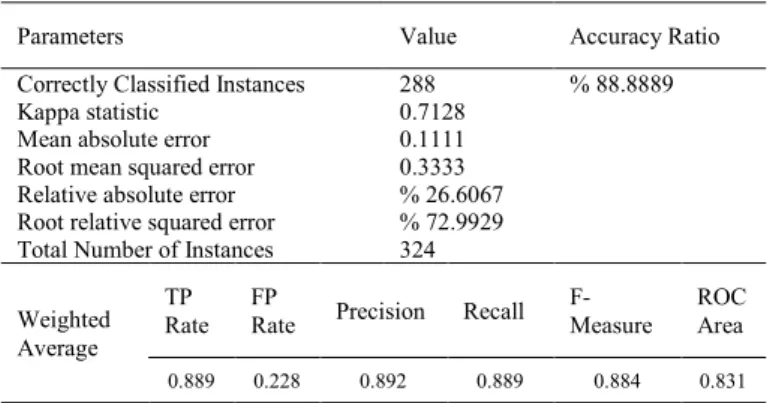
The SMO algorithm, was applied to the Mesothelioma dataset and the obtained results are shown in Table 3. As can be seen from Table 3, 288 of 324 samples in the related database were correctly classified. Thus, the correct classification ratio of SMO algorithm is %88.8889.
Table 3: Accuracy Ratio of SMO Application
Parameters Value Accuracy Ratio
Correctly Classified Instances 288 % 88.8889
Kappa statistic 0.7128
Mean absolute error 0.1111
Root mean squared error 0.3333 Relative absolute error % 26.6067 Root relative squared error % 72.9929 Total Number of Instances 324 Weighted
Average TP
Rate FP Rate Precision Recall F-Measure ROC Area 0.889 0.228 0.892 0.889 0.884 0.831
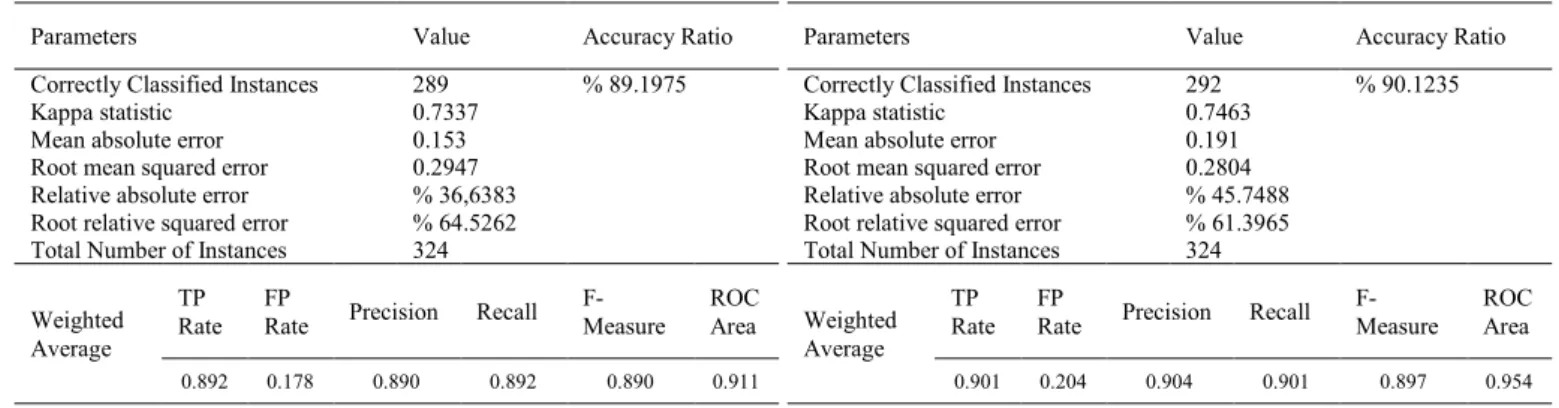
The LMT algorithm, was applied to the Mesothelioma dataset and the obtained results are shown in Table 4. As can be seen from Table 4, 289 of 324 samples in the related database were correctly classified. Thus, the correct classification ratio of LMT algorithm is %89.1975.
Table 4: Accuracy Ratio of LMT Application
Parameters Value Accuracy Ratio
Correctly Classified Instances 289 % 89.1975
Kappa statistic 0.7337
Mean absolute error 0.153
Root mean squared error 0.2947 Relative absolute error % 36,6383 Root relative squared error % 64.5262 Total Number of Instances 324 Weighted
Average TP
Rate FP Rate Precision Recall F-Measure ROC Area 0.892 0.178 0.890 0.892 0.890 0.911
The Logistic algorithm, was applied to the Mesothelioma dataset and the obtained results are shown in Table 5. As can be seen from Table 5, 290 of 324 samples in the related database were correctly classified. Thus, the correct classification ratio of Logistic algorithm is %89.5062.
Table 5: Accuracy Ratio of Logistic Application
Parameters Value Accuracy Ratio
Correctly Classified Instances 290 % 89.5062
Kappa statistic 0.7405
Mean absolute error 0.1451
Root mean squared error 0.308 Relative absolute error % 34.7401 Root relative squared error % 67.4366 Total Number of Instances 324 Weighted
Average TP
Rate FP Rate Precision Recall F-Measure ROC Area 0.895 0.177 0.894 0.895 0.893 0.896
The Multi Class Classifier was applied to the Mesothelioma dataset and the obtained results are shown in Table 6. As can be seen from Table 6, 290 of 324 samples in the related database were correctly classified. Thus, the CCR of Multi Class Classifier algorithm is %89.5062.
Table 6: Accuracy Ratio of Multi Class Classifier Application
Parameters Value Accuracy Ratio
Correctly Classified Instances 290 % 89.5062
Kappa statistic 0.7405
Mean absolute error 0.1451
Root mean squared error 0.308 Relative absolute error % 34.7401 Root relative squared error % 67.4366 Total Number of Instances 324 Weighted
Average TP
Rate FP Rate Precision Recall F-Measure ROC Area 0.895 0.177 0.894 0.895 0.893 0.896
The Random Committee algorithm was applied to the Mesothelioma dataset and the obtained results are shown in Table 7. As can be seen from Table 7, 292 of 324 samples in the related database were correctly classified. Thus, the CCR of Random Committee algorithm is %90.1235.
Table 7: Accuracy Ratio of Random Committee Application
Parameters Value Accuracy Ratio
Correctly Classified Instances 292 % 90.1235
Kappa statistic 0.7463
Mean absolute error 0.191
Root mean squared error 0.2804 Relative absolute error % 45.7488 Root relative squared error % 61.3965 Total Number of Instances 324 Weighted
Average TP
Rate FP Rate Precision Recall F-Measure ROC Area 0.901 0.204 0.904 0.901 0.897 0.954
The PART algorithm, was applied to the Mesothelioma dataset and the obtained results are shown in Table 8. As can be seen from Table 8, 294 of 324 samples in the related database were correctly classified. Thus, the correct classification ratio of PART algorithm is %90.7407.
Table 8: Accuracy Ratio of PART Application
Parameters Value Accuracy Ratio
Correctly Classified Instances 294 % 90.7407
Kappa statistic 0.778
Mean absolute error 0.1027
Root mean squared error 0.3013 Relative absolute error % 24.597 Root relative squared error % 65.9728 Total Number of Instances 324 Weighted
Average TP
Rate FP Rate Precision Recall F-Measure ROC Area 0.907 0.129 0.907 0.907 0.907 0.877
ANN was applied to the Mesothelioma Dataset. Of the 324 samples, 220 were in training, 52 were in validation, and 52 were allocated to test the network. The network topology used was 41-42-1. The network topology used was 41-42-1 and logistic was used as input and output activation function. Quick propagation algorithm was used for training network and the obtained results are shown in Table 9. As can be seen from Table 9, overall correct classification ratio of ANN algorithm is %99.0740. In Fig 2, the ROC curve of the ANN application is presented.
Table 9: Correctly Classified Ratio of ANN Parameters Value Training CCR %100 Validation CCR %93.6170 Test CCR %100 Overall CCR %99.0740
5. Conclusion
In this study, 9 different classification methods of data mining were applied on the database prepared by Dicle University Medical Faculty using real patients’ data for the detection of mesothelioma disease. Classification accuracy ratios of instances were found as % 87.3457, %88.2716, %88.8889, %89.1975, %89.5062, %89.5062, %90.1235, %90.7407 and %99.0740 for J48, Bayes Net, SMO, LMT, Logistic, Multi Class Classifier, Random Committee, PART and ANN respectively as can be seen from Table 10.
Table 10: Accuracy Ratio of Classification Algorithms Classifier Rules Method Accuracy Ratio
J48 % 87.3457
Bayes Net % 88.2716
SMO % 88.8889
LMT % 89.1975
Logistic % 89.5062
Multi Class Classifier % 89.5062
Random Committee % 90.1235
PART % 90.7407
Artificial Neural Network % 99.0740
These results have shown that ANN has the most successful prediction ratio among the ten algorithms on related data set. This doesn’t guarantee to have most successful classification results for ANN on every data set. Further studies are required for finding an algorithm that will always or mostly have highest correct classification ratio on different data sets. The authors of this paper will analyze different classification algorithms on different data sets for at least to come up with a suggestion of most successful ones regardless of type, size and properties of data set in the future studies.
References
[1] H.I. Witten, E. Frank, “Data Mining, Practical Machine Learning Tools and Techniques”, Morgan Kaufmann, USA; 2005.
[2] C. Coşkun, A. Baykal, “An Application for Comparison of Data Mining Classification Algorithms”, XIII. Akademik Bilişim Konferansı, February 2011
[3] D. J. Hand, “Classifier Technology and the Illusion of Progress”, Statistical Science, Vol. 21; Institute of Mathematical Statistics, pp. 1-15, 2006
[4] L Salzberg, “Methodological Note On Comparing Classifiers: Pitfalls to Avoid and a Recommended Approach”, Data Mining and Knowledge Discovery 1, Kluwer Academic Publishers, Boston, pp. 317–328, 1997
[5] D. Michie, D. J. Spiegelhalter, “Machine Learning, Neural and Statistical Classification”, Taylor, C. C., Prentice Hall, 1994. [6] R. L. Wilson, R. Sharda, “Bankruptcy prediction using neural
networks”, Decision Support Systems, Vol. 11, Issue 5, Elsevier Science Publishers B. V. Amsterdam, The Netherlands, pp. 545-557, 1994
[7] M. Lin, S. Huang, Y. Chang, “Kernel-based discriminant technique for
educational placement”, Journal of Educational and Behavioral Statistics, Vol 29, pp. 219-240, 2004
[8] R. D. King, C. Feng, A. Sutherland, “StatLog: Comparison of Classification Algorithms on Large Real-World Problems”, Applied Artificial Intelligence, Vol 9, Issue 3, pp. 289-333, 1995
[9] J. Zurada, S. Lonial, “Comparison of The Performance of Several Data Mining Methods for Bad Debt Recovery in The Healthcare Industry”, The Journal of Applied Business Research Vol 21, pp. 37-53, 2005 [10] V. N. Rajavarman, S. P. Rajagopalan, “Comparison between
Traditional data mining Techniques and Entropy-based Adaptive Genetic Algorithm for Learning Classification Rules”, International Journal of Soft Computing Vol 2 Issue 4, pp. 555-561, 2007 [11] H. Sabzevari, M. Soleymani, E. Noorbakhsh, “A comparison between
statistical and Data Mining methods for credit scoring in case of limited available data”, Eleventh Annual APRIA Conference, 2007. [12] T. R. Patil, S. S. Sherekar, “Performance Analysis of Navie Bayes and
J48 Classification Algorithm for Data Classification”, International Journal of Computer Science and Applications, Vol. 6, No. 2, pp. 256-261, April 2013
[13] A. K. Sharma, S. Sahni, “A Comparative Study of Classification Algorithms for Spam Email Data Analysis”, IJCSE, Vol. 3, No. 5, pp. 1890-1895, 2011
[14] WEKA, http://www.cs.waikato.ac.nz/~ml/weka/ Last access: 10.04.2017
[15] T. Hastie, R. Tibshirani, “Classification by pairwise coupling”, The Annals of Statistics, Vol. 26, No. 2, pp. 451-471, 1998
[16] E. Frank, I. H. Witten, “Generating Accurate Rule Sets Without Global Optimization”, Fifteenth International Conference on Machine Learning, pp. 144-151, 1998.
[17] J. Platt, “Machines using Sequential Minimal Optimization.”, Advances in Kernel Methods - Support Vector Learning, 1998. [18] S.S. Keerthi, S.K. Shevade, C. Bhattacharyya, K.R.K. Murthy,
“Improvements to Platt's SMO Algorithm for SVM Classifier Design.”, Neural Computation, 13(3):637-649, 2001
[19] N. Landwehr, M. Hall, E. Frank, “Logistic model Trees”, Machine Learning, 59, pp. 161-205, 2005
[20] M. Sumner, E. Frank, M. Hall, “Speeding up Logistic Model Tree Induction.”, 9th European Conference on Principles and Practice of Knowledge Discovery in Databases, 675-683, 2005
[21] T. Hastie, R. Tibshirani, “Classification by Pairwise Coupling.”, Advances in Neural Information Processing Systems, 1998.
[22] J. Weston, C. Watkins, “Multi-class support vector machines.”, In: Proc. ESANN, pp. 1–2, 1999
[23] H. Qian, Y. Mao, W. Xiang, Z. Wang, “Recognition of human activities using SVM multi-class classifier”, Pattern Recognition Letters 31, pp. 100-111, 2010
[24] I.H. Witten, E. Frank, “Data Mining-Practical Machine Learning Tools and Techniques”, Second Edition
[25] O. Er, “Esnek Hesaplama ve BiyoBilişim Teknikleri ile Bir Klinik Karar Verme Simülatörünün Oluşturulması”, PhD Thesis, in Turkish [26] O. A. Er, A. C. Tanrikulu, A. Abakay, “An approach based on
probabilistic neural network for diagnosis of Mesothelioma's disease”, Computers & Electrıcal Engıneerıng, Volume: 38 Issue: 1, pp. 75-81, 2012.