An Empirical Investigation of the Uncertain
Information Hypothesis:
Evidence From Borsa Istanbul
Soner AKKOÇ*
Nasıf ÖZKAN**
Abstract
This paper investigates the reaction of investors to the arrival of major political and economical news in Borsa Istanbul from October 2004 to September 2011. While the empirical results of the paper cannot support the prediction of Overreaction Hypothesis, they are consistent with the Uncertain Information Hypothesis which means investors in Turkey set security prices below their fundamental values in response to unexpected information. In comparison with the studies examining previous periods, we found that this impact is diminishing and Borsa Istanbul has become more efficient for the period of 2004 to 2011. Key Words: Uncertain Information Hypothesis, Overreaction Hypothesis, Efficient Market Hypothesis, Borsa Istanbul
JEL Classification: G14, G15
Özet -
Belirsiz Bilgi Hipotezi Üzerine Ampirik Bir İnceleme: Borsa İstanbul ÖrneğiBu çalışma, Ekim 2004 ile Eylül 2011 arasında Borsa İstanbul’a ulaşan, büyük öneme sahip, politik ve ekonomik haberlere yatırımcıların verdiği tepkileri incelemektedir. Çalışmanın ampirik sonuçları Aşırı Tepki Verme Hipotezinin öngörülerini desteklememekle birlikte sonuçlar Belirsiz Bilgi Hipotezi ile tutarlı bulunmuştur. Dolayısıyla Türkiye’deki yatırımcıların beklenmeyen bilgilere karşı menkul kıymet fiyatlarını temel değerlerinin altında belirlediği görülmüştür. Ancak çalışmanın sonuçları önceki dönemleri inceleyen çalışmalarla karşılaştırıldığında, bu etkinin azaldığı ve Borsa İstanbul’un 2004-2011 döneminde daha etkin hale geldiği sonucuna ulaşılmıştır.
Anahtar Kelimeler: Belirsiz Bilgi Hipotezi, Aşırı Tepki Verme Hipotezi, Etkin Piyasalar Hipotezi, Borsa İstanbul
JEL Sınıflandırması: G14, G15
* Doç. Dr., Dumlupınar Üniversitesi, Uygulamalı Bilimler Yüksekokulu, Bankacılık ve Finans Bölümü ** Arş. Gör., Dumlupınar Üniversitesi, Uygulamalı Bilimler Yüksekokulu, Bankacılık ve Finans Bölümü
1. Introduction
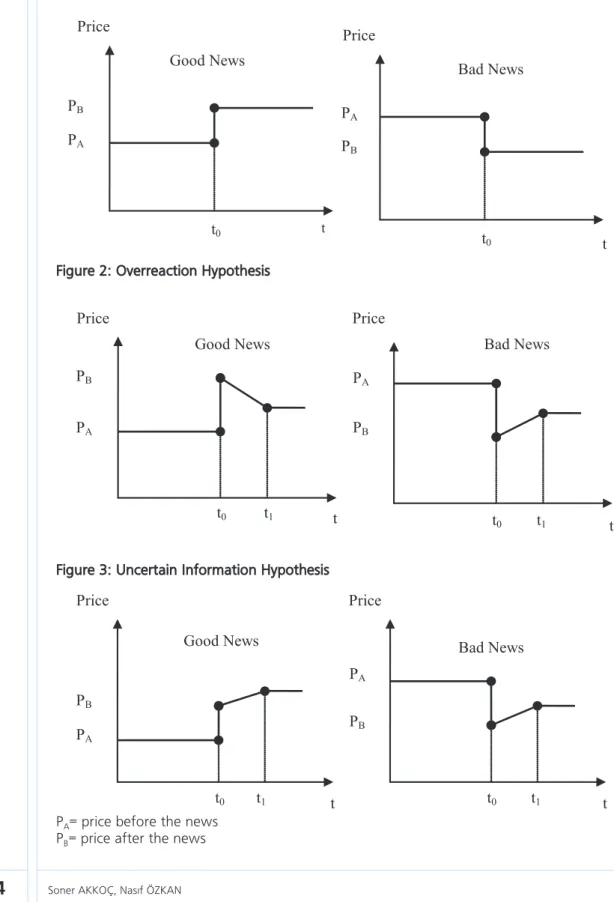
Since Efficient Market Hypothesis (EMH) has emerged in the 1960s (Cootner, 1964; Fama, 1965; Samuelson, 1965; Fama, 1970), it has been subject to great numbers of studies. Under the assumption of rational investor, this hypothesis proposes that stock prices fully reflect all relevant information and expectation, and that any new information is incorporated into stock prices rapidly (see Figure 1). On the contrary, empirical studies indicate that stock prices do not always reflect all available information. This contradiction has led to the emergence of new study fields in behavioral finance such as the Overreaction Hypothesis (OH) of De Bondt and Thaler (1985, 1987) and the Uncertain Information Hypothesis (UIH) of Brown et al., (1988, 1993) (Mehdian et al., 2008).
The OH argues that investors overreact to information in some cases such as stock price moves upward too far in reaction to favorable news and moves downward too far in reaction to unfavorable news, while under-react in others such as stock price does not move upward far enough in reaction to favorable news, or does not move downward far enough in reaction to unfavorable news (Bloomfield et al. 2000). Howe (1986) indicates that investors overreact to dramatic and unanticipated news in more cases. From these points of views, the OH suggests that stock prices tend to fall after an extreme reaction to favorable news, and rise after extreme reaction to unfavorable news. In addition, the rises and falls in stock prices will be as greater as the initial price movements (see Figure 2) (De Bondt and Thaler, 1985). Consistent with the prediction of the OH, De Bondt and Thaler (1985) find that the losers portfolios consistently beat the market index, while the winners portfolio consistently underperformed in the U.S. stock markets. Akkoc (2003) and Sevim et al. (2007) reach similar results for Borsa Istanbul. Sevim et al. (2007) suggest a trading strategy of buying past losers and selling past winners to achieve abnormal returns. There are numerous studies on the existence of the OH in international markets (Howe, 1986; Alonso and Robio, 1990; Zarowin, 1989; Pettengill and Jordan, 1990) but still there is not general consensus in the literature whether the OH holds true.
The UIH asserts that uncertainty and risk will increase in financial markets following the release of unexpected information. So that investors cannot properly
react to unexpected news and therefore they could initially set security prices below their fundamental values. According to the UIH, there will always be a positive market correction following both favorable and unfavorable events (see Figure 3) (Ajayi et al. 2006; Mehdian et al., 2008).
In recent years, there has been an increasing amount of literature examining the reactions of investors to the arrival of unexpected information in the small stock markets. However, these studies have reached different and contradictory results. Shacmurove (2002) examines the investor reactions in thirteen small European stock markets in order to find an international support for the presence of the above mentioned Hypotheses. The author indicates that the UIH is not supported by nine of thirteen stock markets because the return variances of favorable news are larger than the return variances of unfavorable news. The author also states that the arrival of unexpected information does not increase European stock market volatility. Consequently, he decides that the European investors operating in the small continental stock exchanges generally react to uncertain information in an efficient and rational behavior. In contrast to the findings of Shacmurove (2002), De Medeiros (2005) demonstrates that Brazilian investors do otherwise. In Brazilian stock market, following the release of positive (negative) events, investors increase (decrease) stock prices immediately, but they fall (rise) back to an intermediate level after about 5 days verifying that overreaction has occurred. Mehdian et al. (2008) cannot find a statistical support of significant price reversals following the release of unexpected news in the Turkish stock market while they indicate strong statistical evidence that the positive cumulative abnormal returns following both positive and negative events. A recent study, in Turkish stock market by Erzurumlu (2011) suggests that the OH holds true for BIST 100 Index especially following unfavorable events while the EMH is valid for BIST 30 Index. The author associates efficiency on BIST 30 Index to the highly liquid and informational efficient stocks in the Index. Another emerging market study by Rezvanian et al. (2011) get consistent results with the UIH. The authors conclude that investors in Chinese stock market initially set equity prices below their fundamental values in response to unexpected information.
Figure 1: Efficient Market Hypothesis
Figure 2: Overreaction Hypothesis
Figure 3: Uncertain Information Hypothesis
PA= price before the news PB= price after the news
PA PB t0 t t0 PA PB Bad News Price Good News t Price PA t0 t1 t Price t0 t1 t PA PB Price PB
Good News Bad News
PB Bad News Good News t t1 t0 PA Price t0 t1 t Price PA PB
Mehdian et al. (2008) states that there is a need to study on investors’ reaction in emerging equity markets with high volatility such as Turkey. In this context, the aim of this paper is to examine investor reaction to the arrival of major political and economic events in Borsa Istanbul from 2004 to 2011. This paper can be seen as a follow up study of Mehdian et al. (2008) study. We use daily returns from the five major Borsa Istanbul indices (BIST 100 Index, BIST 30 Index, BIST All-Share Index, BIST Industrials Index, BIST Financials Index) following 27 major unexpected events to investigate whether investors’ reaction are consistent with the predictions of the EMH, the OH, and the UIH.
This paper has been organized in the following way. The data and methodology are presented in Section II. Section III presents the empirical results and Section IV includes a conclusion.
2. Data and Methodology
The data for this study were collected from Borsa Istanbul website and consist of daily closing values for five major Borsa Istanbul indices from 11 October 2004 to 19 September 2011. These indices include BIST 100 Index (BIST 100), BIST 30 Index (BIST 30), BIST All-Share Index (BIST TUM), BIST Industrials Index (BIST SIN), and BIST Financials Index (BIST MAL). The 2004-2011 sample period is appropriate for this study since Mehdian et al. (2008) examines the preceding period.
The daily rates of return for each Turkish stock market index are calculated as follows:
Rit = ln(IIit
it−1) ∗ 100
(1)
where Rit denotes the daily percentage rate of return for stock index i on day t; Iit and Iit−1 represent the closing values of stock index i on day t and t-1 respectively; and ln is the natural log. To avoid inappropriate interpretation of the analysis, all stock market indices returns are tested for stationary using the Augmented Dickey Fuller unit root tests (Dickey and Fuller, 1981). The test results show that daily stock returns are stationary for the all stock market indices.
Table 1: Summary statistics for the stock indices
Index Mean Return (%) SD (%) Maximum (%) Minimum (%)
BIST 100 0.0539 1.8833 12.1272 -9.0137
BIST 30 0.0510 2.0154 12.7255 -9.7398
BIST TUM 0.0565 1.8095 11.6517 -8.9134
BIST SIN 0.0503 1.5668 8.3876 -9.6219
BIST MAL 0.0583 2.2041 14.1217 -10.8776
The sample period is from 11 October 2004 to 19 September 2011
Table 1 presents the summary statistics of daily mean returns for all stock market indices included in the analysis. Compared to the 0.0539% daily mean return for BIST 100, the basic index for the Borsa Istanbul, two of the indices have lower returns (BIST 30 and BIST SIN) and two of the indices have higher returns (BIST TUM and BIST MAL). The figures in Table 1 demonstrates that the BIST MAL generates the highest daily mean return (0.0583%) and standard deviation (2.2%) while the daily mean return for the BIST SIN records the lowest return (0.0503%) with a lowest standard deviation (1.57%) among the indices.
In order to determine event days, we use simple and similar approach consistent with Atkins and Dyl (1990), Cox and Peterson (1994), Bremer et al. (1997), and Pham et al. (2008). We examine all daily rates of return for BIST 100 Index that were less (greater) than or equal to -5 (+5) percent over the period from October 2004 to September 2011. We then define these rates of returns as extreme price change events. Atkins and Dyl (1990), and Bremer et al. (1997) state that extremely large one-day price changes are caused by unexpected information related to the value of the stock such as unexpected operating results, or unanticipated government decisions. Therefore, it can be said that these events provide an opportunity to discover whether stock prices accurately reflect unexpected information or overreact to such information (Pham et al., 2008). Using this method, we identify 27 major political and economic events which had a significant impact on Borsa Istanbul Indices either positively (11 events) or negatively (16 events) (see Table 2). Furthermore, we track daily stock returns over a 30-day window after each event and define a total of 441 post-event days1.
Post-event days consist of 198 post-favorable and 243 post-unfavorable Post-event days. The rest of the sample, 1254 days, is called as non-event days which do not fall within any of the 30 day windows following major events.
1 All event days are not followed by a full 30 day post event window because there are several cases where two events
We next investigate whether the arrival of unexpected information (favorable or unfavorable) affects the volatility of the stock market returns. In order to do this, we calculate the variance of daily stock returns for the post-event days (favorable and unfavorable events) and for the non-event days. The variances are computed as follows: Var =N 1 j− 1 �(Rit− R�ij) 2 Nj t=1 (2)
where Nj is the number of days in each category (post-event or non-event days), Rit denotes the daily return of stock index i on day t, R�ij represents the average return of each category (post-event or non-event days), while j=1, 2, 3 stands for
unfavorable events, favorable events and non-events, respectively. Then, F-test is performed and F-statistics is calculated to compare the volatility of
all post-event days to the volatility of the all non-event days. The null hypothesis of the F-test asserts that the variance of returns for post-event days is equal to the variance of returns for all non-event days. Due to unexpected events increase market volatility and uncertainty, we expect that the variance of returns in post-event windows to be significantly higher than the variance of returns for non-post-event days. Therefore, the null hypothesis needs to be rejected in consistent with the UIH. Moreover, similar procedures can be employed to test for any differences between the variances of returns for favorable events and the variances of returns for unfavorable events (Bush et al., 2010).
In order to determine whether the pattern of stock returns following unexpected information is consistent with the predictions of either the Overreaction Hypothesis or the Uncertain Information Hypothesis, we compute cumulative abnormal returns (CARs) for each favorable and unfavorable event periods by using the method of calculation outlined by Ajayi and Mehdian (1994) and reproduced by Mehdian et al. (2008) and Rezvanian et al. (2011). This method involves several steps.
Ta bl e 2: D at es a nd s ou rc es o f un ex pe ct ed f av o ra bl e an d un fa vo ra bl e ev en ts D at e D ai ly R et ur n (% ) Ev en t BI ST 1 00 BI ST 3 0 BI ST T U M BI ST S IN BI ST M A L U nf av or ab le n ew s 22. 05. 2006 -8. 67 -8. 53 -8. 51 -8. 62 -8. 59 FE D in cr eas ed in te re st r at es , at tac k ag ai ns t C ou nc il of St at e, an d ear ly e le ct ion ru m ors 13. 06. 2006 -5. 84 -5. 01 -5. 91 -7. 15 -5. 54 D ec lin e in m aj or w or ld in dic es 16. 08. 2007 -7. 03 -6. 94 -7. 03 -7. 09 -7. 26 U nc er ta in ty o f th e pr es ide nt ia l ele ct io n, A bdu lla h Gu l m ade pu blic h is pr es ide nt ia l can di dac y an d gov er nm en t for m at ion p roc es s. A ls o, t he s har p de cl in e in A si an m ar ke ts ov er t he la st t hr ee yea rs . 21. 01. 2008 -6. 61 -6. 65 -6. 39 -6. 07 -6. 51 C on ce rn s ab ou t th e eco no m ic reces si on in th e U S eco no m y af ter a $1 50 bi lli on eco no m ic st im ul us p ack ag e an no un ced b y th e Pr es id en t Bu sh 17. 03. 2008 -7. 75 -7. 70 -7. 42 -7. 10 -8. 15 Th e o pe ni ng o f t he c lo su re c as e a ga in st t he r ul in g J us tic e a nd D ev el op m en t P ar ty 01. 07. 2008 -5. 51 -6. 11 -5. 35 -5. 65 -6. 20 O il pr ices r ea ch ed r eco rd l ev el s beca us e of a n in cr ea si ng t en si on b et ween I ra n an d Is ra el . H ig h in ter es t ra te le vel s beca us e of T rea su ry ’s d om es tic deb t pa ym en ts a nd in cr ea sin g in te rn al po lit ic al te ns io n (o ng oin g po lit ic al un cer ta in ty a ft er t he cl os ur e ca se aga in st t he r ul in g Ju st ic e a nd D ev el op m en t P ar ty ) 15. 09. 2008 -5. 42 -5. 25 -5. 37 -4. 85 -6. 48 Ba nk ru pt cy a nn ou ncem en t of Leh m an B ro th er s 03 -06. 10. 2008 * -14. 65 -15. 97 -14. 39 -11. 43 -17. 73 O ng oin g co nc er ns a bo ut a s lo w do w n in t he U S ec on om y alt ho ug h th e $700 billio n ba ilo ut p ack ag e wa s accep ted b y th e H ou se of R ep res en ta tiv es 10. 10. 2008 -8. 03 -7. 24 -8. 09 -8. 10 -9. 98 Th e a nn ou nc em en t o f t he U S f or ei gn t ra de d ef ic it f or A ug us t ( 59 .1 4 billio n) a nd in cr ea si ng s al es in wo rld s to ck m ar ket s 16 -17. 10. 2008 * -12. 94 -15. 01 -12. 28 -6. 94 -17. 24 Se ve re de clin e in t he D ow J on es a nd S& P 500 in dic es ( 7. 87% a nd 9% r es pe ct iv ely ) 05. 11. 2008 -5. 20 -5. 51 -4. 99 -3. 71 -7. 05 Th e IM F sp ok es m en an nou nc ed t hat Tu rk ey d id n ot r equ es t a ne w e con om ic p rog ram 17 -18 -19. 11. 2008 * -14. 79 -15. 25 -14. 10 -14. 67 -15. 70 A nn ou nc em en ts of se ve ral m aj or in st itu tion s: St an dar d & Poor ’s re vi se d Tu rk ey ’s ou tlook t o ne gat iv e. Th e Eu rop ean C en tr al B an k cl ai m ed t hat t he f in an ci al s ys te m of in du st ria liz ed co un tr ie s w as im pe rile d du e to g lo ba l cr is es . Fit ch a ss er te d th at T ur ki sh ba nk s fa ce ch al len ges i n th e sh or t ter m . M er ril l Ly nch S ur ve y in dic at ed th at e co no m ic re ce ss io n w ill co nt in ue in 2009 t oo . 01. 12. 2008 -5. 53 -6. 23 -5. 34 -4. 63 -6. 98 Eu ro z on e m an uf ac tu rin g PM I in de x fe ll to it s lo w es t le ve l. Tu rk is h Ex po rt er s A ss em bly st at ed th at e xpo rt v olu m e fe ll by 22 % in N ov em be r. C en tr al Ba nk o f th e Re pu blic o f Tu rk ey M on et ar y Po lic y C om m itt ee in dic at ed th at t he g lo ba l cr edit c on dit io ns w ou ld lim it th e in te rn al an d ex te rn al de m an d. (c on tin ue d o n ne xt p age )
Ta bl e 2 (c on ti nu ed ) D at e D ai ly R et ur n (% ) Ev en t BI ST 1 00 BI ST 3 0 BI ST T U M BI ST S IN BI ST M A L 08. 01. 2009 -6. 22 -6. 34 -6. 08 -5. 26 -7. 59 In du st ria l pr odu ct io n de cr ea se d by 1 3. 9% in N ov em be r. GD P fig ur es f ro m t he E ur o zo ne sh ow ed t ha t E ur o z on e’ s e co no m y s hr un k b y 0 .2 % i n th e t hi rd q ua rt er o f 2 00 8. D ev el op m en ts in t he fr am ewo rk o f th e Er gen ek on ca se. 30. 10. 2009 -6. 59 -6. 55 -6. 63 -5. 95 -7. 42 U S co ns um er s pe ndin g fig ur es r ec or de d th e sh ar p de cr ea se b y 0. 5% in 2009 05 -08 -10. 08. 2011 * -16. 49 -17. 12 -16. 61 -16. 64 -18. 85 St an da rd & P oo r’ s d ow ngr ad ed t he U S’ s A A A c re di t r at in g b y o ne n ot ch t o A A + Favo ra bl e ne w s 20. 07. 2006 5. 10 5. 65 4. 88 3. 54 5. 74 Rat e cu t ex pe ct at ion s in t he U S 19. 09. 2007 6. 48 7. 18 6. 06 3. 85 7. 62 Th e FE D c ut in te re st r at es b y 50 ba sis po in ts 24. 01. 2008 5. 65 6. 08 5. 42 4. 58 5. 68 Ex pe ct at io ns f or a no th er r at e c ut i n t he U S a nd th e g ro w in g p ro sp ec t o f e xp an de d eco no m ic res cu e pl an 12. 02. 2008 5. 18 5. 99 4. 82 2. 96 5. 23 Wa rr en B uf fe t of fe re d he lp to t ro ubl ed bo nd in su re rs b y re in su rin g $800 billio n w or th o f m un ic ipa l bo nds 30. 07. 2008 5. 44 6. 66 4. 90 1. 59 6. 89 Tu rk ey 's C on st itu tion al C ou rt de cide d no t to c lo se t he r ulin g Ju st ic e an d D ev elo pm en t Pa rt y 19. 09. 2008 12. 13 12. 73 11. 65 8. 39 14. 12 M ood y’ s si gn al ed t hat it m ay in cr eas e Tu rk ey ’s c re di t rat in g 14. 10. 2008 5. 29 5. 37 5. 12 4. 87 5. 54 A nn ou nc em en t of t he U S’ s de cis io n to h elp th e ba nk s by $250 billio n 30. 10. 2008 9. 39 10. 71 9. 17 7. 99 12. 12 Th e F ED c ut it s b en ch m ar k i nt er es t r at e b y h al f a p er ce nt age p oi nt t o 1 % 24. 11. 2008 9. 43 10. 26 9. 11 7. 69 10. 90 Ris e in g lo ba l s to ck m ar ket s an d ex pec ta tio n of a n ew ag reem en t bet ween T ur key a nd IM F 29. 04. 2009 5. 20 5. 52 4. 80 2. 69 6. 56 O pt im is tic e xpe ct at io ns r eg ar din g th e Tu rk is h ba nk s’ ba la nc e sh ee ts f or t he 1 st qu ar te r 10. 05. 2010 6. 90 6. 97 6. 88 6. 46 7. 69 Eu ro pe’ s fin an ce m in is ter s ap pr ov ed a r es cu e pa ck ag e wo rt h €750 billio n D ai ly r et ur ns o f th e co ns ecu tiv e da ys a dd ed t og et her
In the first stage, the abnormal return for each index i on day t (t=+1,...,+30) following the unexpected event d, ARitd, is calculated as by structuring the mean return of each index i (R�i3) from the daily return on the same index:
ARitd = Ritd − R�i3 (3)
where d = 1, . . . , n, is the number of favourable or unfavourable events in each index i. Ritd denotes the return of each index i on day t for event d, and R�i3 equals the mean return of each index i for non-event days.
In the second step we obtain the mean abnormal return, AR����it, on day t by adding the abnormal return for every event and divide them into the number of such events (n) as follows:
AR ����it =1 n �� ARitd n d=1 � , (t = +1, … , +30) (4)
Eventually, the CARs are calculated by adding the mean abnormal returns over 30 days as:
CARit= CARi(t−1)+ AR����it (5)
The statistical significance of the CARs is tested by using a standard t-test of the null hypothesis in which the CARs for each day are equal to zero during the post-event window. T-statistic is obtained as:
t =[Var(CARCARit it)]1/2
(6)
The graphical representations of CARs for post-event windows following unfavorable and favorable events are presented for each index to determine whether investor reactions to unexpected information consistent with the predictions of the OH or the UIH (Bush et al., 2010).
3. Empirical Results
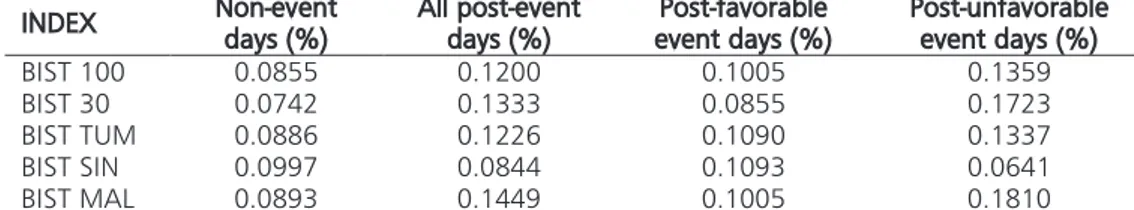
Table 3 provides the daily mean returns for all non-event days, post-event days, post-favorable event days, and post-unfavorable event days for each Borsa Istanbul Indices. As Table 3 displays, the post-event daily mean returns are higher than the non-event daily mean returns for all indices, except the BIST SIN index. In addition, as the figures in Table 3 shows, the daily mean returns for the post-unfavorable events days are higher than the daily mean returns for the post-favorable event days for all indices, but this is not the case for the BIST SIN index.
Table 3 : Mean daily returns for non-event days, all post-event days, post-favorable event days and post-unfavorable event days
INDEX Non-event days (%) All post-event days (%) event days (%) Post-favorable Post-unfavorable event days (%)
BIST 100 0.0855 0.1200 0.1005 0.1359
BIST 30 0.0742 0.1333 0.0855 0.1723
BIST TUM 0.0886 0.1226 0.1090 0.1337
BIST SIN 0.0997 0.0844 0.1093 0.0641
BIST MAL 0.0893 0.1449 0.1005 0.1810
Non-event days, all post-event days, post-favorable event days and post-unfavorable event days consist of 1254, 441, 198, and 243 number of days respectively.
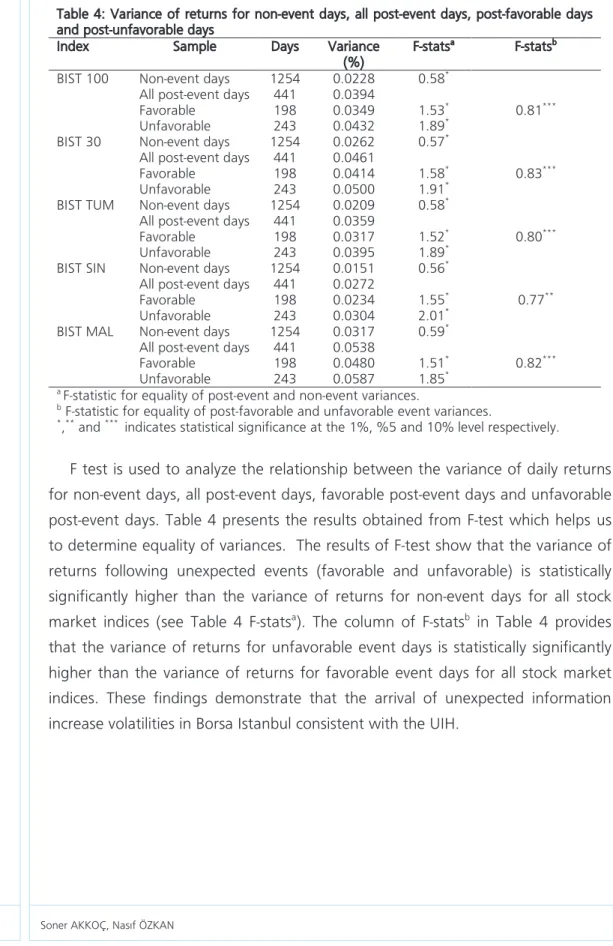
In order to test whether unexpected events increase market volatility and uncertainty, predicted by UIH, we examine the variances of the return volatilities following unexpected events (see Table 4). The reason is that many papers report that unexpected events cause increased volatility statistics. In order to sustain the UIH, it is also suggested that variance volatilities following unfavorable news should be higher than volatilities following favorable news (Shachmurove, 2002).
Table 4: Variance of returns for non-event days, all post-event days, post-favorable days and post-unfavorable days
Index Sample Days Variance
(%) F-stats
a F-statsb
BIST 100 Non-event days 1254 0.0228 0.58* All post-event days 441 0.0394
Favorable 198 0.0349 1.53* 0.81***
Unfavorable 243 0.0432 1.89* BIST 30 Non-event days 1254 0.0262 0.57*
All post-event days 441 0.0461
Favorable 198 0.0414 1.58* 0.83***
Unfavorable 243 0.0500 1.91* BIST TUM Non-event days 1254 0.0209 0.58*
All post-event days 441 0.0359
Favorable 198 0.0317 1.52* 0.80***
Unfavorable 243 0.0395 1.89* BIST SIN Non-event days 1254 0.0151 0.56*
All post-event days 441 0.0272
Favorable 198 0.0234 1.55* 0.77**
Unfavorable 243 0.0304 2.01* BIST MAL Non-event days 1254 0.0317 0.59*
All post-event days 441 0.0538
Favorable 198 0.0480 1.51* 0.82***
Unfavorable 243 0.0587 1.85* a F-statistic for equality of post-event and non-event variances.
b F-statistic for equality of post-favorable and unfavorable event variances.
*,** and *** indicates statistical significance at the 1%, %5 and 10% level respectively.
F test is used to analyze the relationship between the variance of daily returns for non-event days, all post-event days, favorable post-event days and unfavorable post-event days. Table 4 presents the results obtained from F-test which helps us to determine equality of variances. The results of F-test show that the variance of returns following unexpected events (favorable and unfavorable) is statistically significantly higher than the variance of returns for non-event days for all stock market indices (see Table 4 F-statsa). The column of F-statsb in Table 4 provides
that the variance of returns for unfavorable event days is statistically significantly higher than the variance of returns for favorable event days for all stock market indices. These findings demonstrate that the arrival of unexpected information increase volatilities in Borsa Istanbul consistent with the UIH.
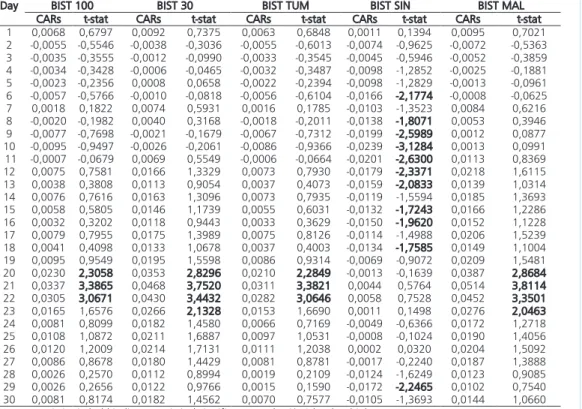
Table 5: Post-event cumulative abnormal returns (CARs) for BIST 100, BIST 30, BIST TUM, BIST SIN, BIST MAL indices: Unfavorable events
Day BIST 100 BIST 30 BIST TUM BIST SIN BIST MAL
CARs t-stat CARs t-stat CARs t-stat CARs t-stat CARs t-stat 1 0,0068 0,6797 0,0092 0,7375 0,0063 0,6848 0,0011 0,1394 0,0095 0,7021 2 -0,0055 -0,5546 -0,0038 -0,3036 -0,0055 -0,6013 -0,0074 -0,9625 -0,0072 -0,5363 3 -0,0035 -0,3555 -0,0012 -0,0990 -0,0033 -0,3545 -0,0045 -0,5946 -0,0052 -0,3859 4 -0,0034 -0,3428 -0,0006 -0,0465 -0,0032 -0,3487 -0,0098 -1,2852 -0,0025 -0,1881 5 -0,0023 -0,2356 0,0008 0,0658 -0,0022 -0,2394 -0,0098 -1,2829 -0,0013 -0,0961 6 -0,0057 -0,5766 -0,0010 -0,0818 -0,0056 -0,6104 -0,0166 -2,1774 -0,0008 -0,0625 7 0,0018 0,1822 0,0074 0,5931 0,0016 0,1785 -0,0103 -1,3523 0,0084 0,6216 8 -0,0020 -0,1982 0,0040 0,3168 -0,0018 -0,2011 -0,0138 -1,8071 0,0053 0,3946 9 -0,0077 -0,7698 -0,0021 -0,1679 -0,0067 -0,7312 -0,0199 -2,5989 0,0012 0,0877 10 -0,0095 -0,9497 -0,0026 -0,2061 -0,0086 -0,9366 -0,0239 -3,1284 0,0013 0,0991 11 -0,0007 -0,0679 0,0069 0,5549 -0,0006 -0,0664 -0,0201 -2,6300 0,0113 0,8369 12 0,0075 0,7581 0,0166 1,3329 0,0073 0,7930 -0,0179 -2,3371 0,0218 1,6115 13 0,0038 0,3808 0,0113 0,9054 0,0037 0,4073 -0,0159 -2,0833 0,0139 1,0314 14 0,0076 0,7616 0,0163 1,3096 0,0073 0,7935 -0,0119 -1,5594 0,0185 1,3693 15 0,0058 0,5805 0,0146 1,1739 0,0055 0,6031 -0,0132 -1,7243 0,0166 1,2286 16 0,0032 0,3202 0,0118 0,9443 0,0033 0,3629 -0,0150 -1,9620 0,0152 1,1228 17 0,0079 0,7955 0,0175 1,3989 0,0075 0,8126 -0,0114 -1,4988 0,0206 1,5239 18 0,0041 0,4098 0,0133 1,0678 0,0037 0,4003 -0,0134 -1,7585 0,0149 1,1004 19 0,0095 0,9549 0,0195 1,5598 0,0086 0,9314 -0,0069 -0,9072 0,0209 1,5481 20 0,0230 2,3058 0,0353 2,8296 0,0210 2,2849 -0,0013 -0,1639 0,0387 2,8684 21 0,0337 3,3865 0,0468 3,7520 0,0311 3,3821 0,0044 0,5764 0,0514 3,8114 22 0,0305 3,0671 0,0430 3,4432 0,0282 3,0646 0,0058 0,7528 0,0452 3,3501 23 0,0165 1,6576 0,0266 2,1328 0,0153 1,6690 0,0011 0,1498 0,0276 2,0463 24 0,0081 0,8099 0,0182 1,4580 0,0066 0,7169 -0,0049 -0,6366 0,0172 1,2718 25 0,0108 1,0872 0,0211 1,6887 0,0097 1,0531 -0,0008 -0,1024 0,0190 1,4056 26 0,0120 1,2009 0,0214 1,7131 0,0111 1,2038 0,0002 0,0320 0,0204 1,5092 27 0,0086 0,8678 0,0180 1,4429 0,0081 0,8781 -0,0017 -0,2240 0,0187 1,3888 28 0,0026 0,2570 0,0112 0,8994 0,0019 0,2109 -0,0124 -1,6249 0,0123 0,9085 29 0,0026 0,2656 0,0122 0,9766 0,0015 0,1590 -0,0172 -2,2465 0,0102 0,7540 30 0,0081 0,8174 0,0182 1,4562 0,0070 0,7577 -0,0105 -1,3693 0,0144 1,0660 Note: t-statistics in bold indicate statistical significance at the %10 level or higher
Figure 4: Unfavorable post-event cumulative abnormal returns
-0,03 -0,02 -0,010,00 0,01 0,02 0,03 0,04 0,05 0,06 1 2 3 4 5 6 7 8 9 10 11 12 13 14 15 16 17 18 19 20 21 22 23 24 25 26 27 28 29 30 CARs Post-event days
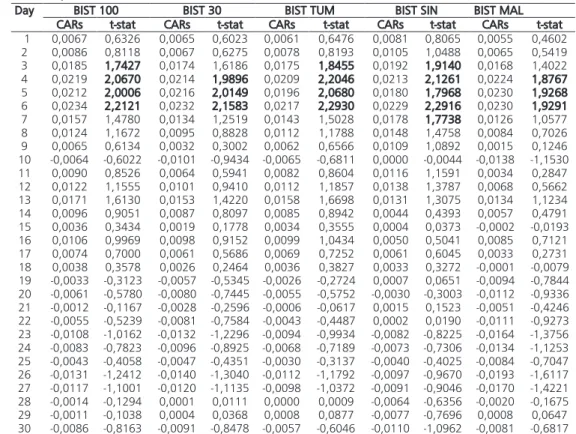
Table 6 : Post-event cumulative abnormal returns (CARs) for BIST 100, BIST 30, BIST TUM, BIST SIN, BIST MAL indices: Favorable events
Day BIST 100 BIST 30 BIST TUM BIST SIN BIST MAL
CARs t-stat CARs t-stat CARs t-stat CARs t-stat CARs t-stat 1 0,0067 0,6326 0,0065 0,6023 0,0061 0,6476 0,0081 0,8065 0,0055 0,4602 2 0,0086 0,8118 0,0067 0,6275 0,0078 0,8193 0,0105 1,0488 0,0065 0,5419 3 0,0185 1,7427 0,0174 1,6186 0,0175 1,8455 0,0192 1,9140 0,0168 1,4022 4 0,0219 2,0670 0,0214 1,9896 0,0209 2,2046 0,0213 2,1261 0,0224 1,8767 5 0,0212 2,0006 0,0216 2,0149 0,0196 2,0680 0,0180 1,7968 0,0230 1,9268 6 0,0234 2,2121 0,0232 2,1583 0,0217 2,2930 0,0229 2,2916 0,0230 1,9291 7 0,0157 1,4780 0,0134 1,2519 0,0143 1,5028 0,0178 1,7738 0,0126 1,0577 8 0,0124 1,1672 0,0095 0,8828 0,0112 1,1788 0,0148 1,4758 0,0084 0,7026 9 0,0065 0,6134 0,0032 0,3002 0,0062 0,6566 0,0109 1,0892 0,0015 0,1246 10 -0,0064 -0,6022 -0,0101 -0,9434 -0,0065 -0,6811 0,0000 -0,0044 -0,0138 -1,1530 11 0,0090 0,8526 0,0064 0,5941 0,0082 0,8604 0,0116 1,1591 0,0034 0,2847 12 0,0122 1,1555 0,0101 0,9410 0,0112 1,1857 0,0138 1,3787 0,0068 0,5662 13 0,0171 1,6130 0,0153 1,4220 0,0158 1,6698 0,0131 1,3075 0,0134 1,1234 14 0,0096 0,9051 0,0087 0,8097 0,0085 0,8942 0,0044 0,4393 0,0057 0,4791 15 0,0036 0,3434 0,0019 0,1778 0,0034 0,3555 0,0004 0,0373 -0,0002 -0,0193 16 0,0106 0,9969 0,0098 0,9152 0,0099 1,0434 0,0050 0,5041 0,0085 0,7121 17 0,0074 0,7000 0,0061 0,5686 0,0069 0,7252 0,0061 0,6045 0,0033 0,2731 18 0,0038 0,3578 0,0026 0,2464 0,0036 0,3827 0,0033 0,3272 -0,0001 -0,0079 19 -0,0033 -0,3123 -0,0057 -0,5345 -0,0026 -0,2724 0,0007 0,0651 -0,0094 -0,7844 20 -0,0061 -0,5780 -0,0080 -0,7445 -0,0055 -0,5752 -0,0030 -0,3003 -0,0112 -0,9336 21 -0,0012 -0,1167 -0,0028 -0,2596 -0,0006 -0,0617 0,0015 0,1523 -0,0051 -0,4246 22 -0,0055 -0,5239 -0,0081 -0,7584 -0,0043 -0,4487 0,0002 0,0190 -0,0111 -0,9273 23 -0,0108 -1,0162 -0,0132 -1,2296 -0,0094 -0,9934 -0,0082 -0,8225 -0,0164 -1,3756 24 -0,0083 -0,7823 -0,0096 -0,8925 -0,0068 -0,7189 -0,0073 -0,7306 -0,0134 -1,1253 25 -0,0043 -0,4058 -0,0047 -0,4351 -0,0030 -0,3137 -0,0040 -0,4025 -0,0084 -0,7047 26 -0,0131 -1,2412 -0,0140 -1,3040 -0,0112 -1,1792 -0,0097 -0,9670 -0,0193 -1,6117 27 -0,0117 -1,1001 -0,0120 -1,1135 -0,0098 -1,0372 -0,0091 -0,9046 -0,0170 -1,4221 28 -0,0014 -0,1294 0,0001 0,0111 0,0000 0,0009 -0,0064 -0,6356 -0,0020 -0,1675 29 -0,0011 -0,1038 0,0004 0,0368 0,0008 0,0877 -0,0077 -0,7696 0,0008 0,0647 30 -0,0086 -0,8163 -0,0091 -0,8478 -0,0057 -0,6046 -0,0110 -1,0962 -0,0081 -0,6817 Note: t-statistics in bold indicate statistical significance at the %10 level or higher
Figure 5: Favorable post-event cumulative abnormal returns
-0,03 -0,02 -0,01 0,01 0,02 0,03 0,04 1 2 3 4 5 6 7 8 9 101112131415161718192021222324252627282930 CARs Post-event days
Table 5 displays the post-event CARs next to their related t-statistics for each of the 30 days following the unfavorable events and Table 6 shows the same results for the favorable events for each stock market index. T-statistics are computed to test the null hypothesis that the CARs are equal to zero. We generally observe an upward trend in the CARs following the arrival of both favorable and unfavorable news. As can be seen in Table 5, the CARs do not exhibit a statistically significant increase for the BIST 100, BIST 30, BIST TUM, and BIST MAL indices during the 19 day period following the arrival of unfavorable news. The CARs reach their highest level at day 21 following unfavorable news for these indices. In addition, when the CARs are their highest level, they are statistically different from zero for all of these indices. On the other hand, there is a downward trend in the CARs of BIST SIN and they are statistically significant in the first 18 days (see Table 5). The CARs of all indices exhibit statistically significant increases during the first 6 days following the arrival of favorable news. Then, the CARs of all indices exhibit decreases which are not statistically different from zero (see Table 6).
Figure 4 and 5 present the graphs of the CARs over the entire 30-day post-event windows for each index. The patterns displayed in these figures are consistent with the discussion and the statistical analysis in Table 5 and 6. In Figure 4, there is an upward trend in the CARs of BIST 100, BIST 30, BIST TUM, and BIST MAL for almost 21 days, after which the CARs decrease. On the other hand, Figure 5 illustrates an upward trend in the CARs for all indices for approximately 6 days, after which the CARs exhibit declining trends ranging. Table 4, 5, 6 and Figure 4, 5 indicate that the arrival of unexpected news (favorable or unfavorable) increase uncertainty and volatility of markets, and there is an upward price movement following the arrival of unexpected information in Borsa Istanbul. The empirical results presented in this paper provide a support for the prediction of the UIH, and are consistent with the findings of Mehdian et al. (2008). As Mehdian et al. (2008) state in their study, these findings also indicate that the reaction of investors following unexpected news in Borsa Istanbul is not characterized by subsequent price reversals. Therefore, a contrarian trading rule of buying current losers and selling current winners may not produce abnormal returns in the short term.
4. Conclusion
This study investigates the reaction of investors to the arrival of major political and economical news in Borsa Istanbul from October 2004 to September 2011. In
order to examine whether investors’ reaction are consistent with the predictions of the Efficient Market Hypothesis (EMH), Overreaction Hypothesis (OH), and Uncertain Information Hypothesis (UIH), daily stock returns are used from the five major Borsa Istanbul indices. These indices include BIST 100 Index, BIST 30 Index, BIST All-Share Index, BIST Industrials Index, and BIST Financials Index.
The empirical results demonstrate that the arrival of unexpected information do not cause statistically significant price reversals in Borsa Istanbul, contrary to the OH. On the other hand, the findings show that the arrival of unexpected information increase volatilities in Borsa Istanbul consistent with the UIH. The UIH is also supported with the positive cumulative abnormal returns (CARs) following the arrival of both favorable and unfavorable information. These empirical results indicate that investors in Turkey set security prices below their fundamental values in response to unexpected information. However, when we examine the post-event CARs for Borsa Istanbul indices, we determine that the average CARs approaches 0%. In other words, we can say that the prediction of UIH seem no to hold true anymore. Therefore, we conclude that the efficiency of Borsa Istanbul has increased since 2004, in comparison with the study of Mehdian et al. (2008) examining the period 1997 to 2004. The reasons for this decision are as follows; the reduced budget deficits, a reasonable debt level, the decreased inflation and interest rates, a growing political stability and the high growth rates.
References
1. Ajayi, R. A., and Mehdian, S. (1994). Rational Investors’ Reaction to Uncertainty: Evidence From The World's Major Markets. Journal of Business Finance and Accounting, 21: 533−545.
2. Ajayi, R. A., Mehdian, S., and Perry, M. J. (2006). A Test of US Equity Market Reaction to a Surprise in an Era of High Trading Volume. Applied Financial Economics, 16: 461-469.
3. Akkoc, S. (2003). Overreaction Hypothesis and an Empirical Study on the Istanbul Stock Exchange. Unpublished master’s thesis, Eskisehir Osmangazi University, Eskisehir, Turkey.
4. Alonso, A. and Gonzalo, R. (1990). Overreaction in the Spanish Equity Market, Journal of Banking and Finance, 14 (2-3): 469-481.
5. Atkins, A., and Dyl, E. (1990). Price Reversals, Bid-ask Spreads, Market Efficiency. Journal of Financial and Quantitative Analysis, 25: 535–547. 6. Bloomfield, R., Libby, R., and Nelson, M. W. (2000). Underreactions,
Overreactions and Moderated Confidence. Journal of Financial Markets, 3: 113-137.
7. Bremer, M., Hiraki, T., and Sweeney, R. J. (1997). Predictable Patterns after Large Stock Price Changes on the Tokyo Stock Exchange. Journal of Financial and Quantitative Analysis, 32(3): 345–365.
8. Brown, K. D., Harlow, W. V., and Tinic, S. M. (1988). Risk aversion: Uncertain Information, and Market Efficiency. Journal of Financial Economics, 22: 355−385.
9. Brown, K. D., Harlow, W. V., and Tinic, S. M. (1993). The Risk and Required Rate of Common Stock Following Major Innovations. Journal of Financial and Quantitative Analysis, 28: 101−116.
10. Bush, P. J., Mehdian, S. M., and Perry, M. J. (2010). A Cross-Industry Analysis of Investors’ Reaction to Information Surprises: Evidence from NASDAQ Sectors. International Review of Accounting, Banking and Finance, 2(2): 85-103.
11. Cootner (Ed.), P. H. (1964). The Random Character of Stock Market Prices. MIT Press, Cambridge, Massachusetts.
12. Cox, D. R., and Peterson, D. R. (1994). Stock Returns Following Large One-day Declines: Evidence on Short-term Reversals, Long-term Performance.
Journal of Finance, 49: 255–267.
13. De Medeiros, O. R. (2005). Reaction of the Brazilian Stock Market to Positive and Negative Shocks. http://ssrn.com/abstract=868464.
14. DeBondt, W. F., and Thaler, R. H. (1985). Does the Stock Market Overreact?
Journal of Finance, 40: 793−805.
15. DeBondt, W. F., and Thaler, R. H. (1987). Further Evidence on Investor Overreaction and Stock Market Seasonality. Journal of Finance, 42: 557−581. 16. Dickey, D. A. and Fuller, W. A. (1981). Likelihood Ratio Statistics for
Autoregressive Time Series with a Unit Root. Econometrica, 49(4): 1057- 1072.
17. Erzurumlu, Y. O. (2011). Investor Reaction to Market Surprises on the Istanbul Stock Exchange. Dogus Universitesi Dergisi, 12 (2): 213-225.
18. Fama, E., (1965). The Behavior of Stock Market Prices. Journal of Business,
38: 34–105.
19. Fama, E. (1970). Efficient Capital Markets: A Review of Theory and Empirical Work. Journal of Finance, 25: 383-417.
20. Howe, J. S. (1986). Evidence on Stock Market Overreaction. Financial Analysts Journal, 74-77.
21. Mehdian, S., Perry, M. J., and Nas, T. (2008). An Examination of Investor Reaction to Unexpected Political and Economic Events in Turkey, Global Finance Journal, 18: 337-350.
22. Pettengill, G. N. and Jordan, B. D. (1990). The Overreaction Hypothesis, Firm Size, and Stock Market Seasonality, Journal of Portfolio Management, 16 (3): 60-64.
23. Pham, V. T. L., Nguyen, D. Q. T. and Tô, T. (2008). Abnormal Returns after Large Stock Price Changes: Evidence from Asia-Pacific Markets. In M. McKenzie, and S. Kim (Eds.), Asia-Pacific Financial Markets: Integration, Innovation and ChallengesInternational Finance Review, 8: 205-227.
24. Rezvanian, R., Turk, R. S. and Mehdian, S. M. (2011). Investors’ Reactions to Sharp Price Change: Evidence from Equity Markets of the People’s Republic of China. Global Finance Journal, 22: 1-18.
25. Samuelson, P., (1965). Proof That Properly Anticipated Prices Fluctuate Randomly. Industrial Management Review, 6: 41–49.
26. Sevim, S., Yildiz, B., and Akkoc, S. (2007). Overreaction Hypothesis and an Empirical Work on the Istanbul Stock Exchange. Istanbul Stock Exchange Review, 9 (35): 21-36.
27. Shachmurove, Y. (2002). The Behavior of Secondary European Stock Markets to Positive and Negative Shocks. International Journal of Business,7(2): 1-16. 28. Zarowin, P. (1989). Does the Stock Market Overreact to Corporate Earning