3.0-
9
2 . 5 -a
s2
2.0- a, 3 [r F 1.5- 1.0- 0.5I
-- 3 ’ 4 5 distance d, m ( x i 0-3)Pig. 3 Vtrricition of’ T M ) I and TM,, rnode ,fkqirencies with rli.c.ttrnce
between centres c~f‘riio,s ,fiw different E,. cind h (r, = 0.04 i n , r2 = 0. Oh tn) - - - - cxpcrimental ~ thcorctical 0 c, = 2.2, h = 0.0008 I l l A 0 ~,.=4.28, h=0.0016 111 = 10.2, / I = 0.00066 111
Concl~ision: Empirical formulas to determine thc rcsonaiice frcquen- cies of the dominant modes of a crescent shapcd dual-port microstrip antenna arc dcveloped. These calculations arc validated by cxpcri- mental results and the pcrccntage error is found to be less than 2.
Acknowledgnzents: S.O. Kundultulam (Young collaborator pro-
gramme) and C.K. Aanandan (Associate schcine) gratefully acknowlcdgc the financial support and Facilities provided by the Ahdus Salam Intcrnational Ccntrc for Theoretical Physics (ICTP), Trieste, Italy.
fc>
IBE 2002Electronics Letter.s Online No: 20020956 DOI: 111.1049/e1:20020956
S.O. Kundukulam, M. Paulson, C.K. Aanandan, P. Mohanan and K.C. Nair (Centre ,fhr Research ill Electlomagnetics and Antennas. Departnzent
of
Blectronic,s, Cochin University o j Science andTechnology, Cochin 682 022. India) E-mail: aanandan~doe.cusat.cdu
I I A4arcA 2002
References
1 KUNDUKIJLAM, S.O., PAULSON, M., AANANDAN, C.K , and MOHANAN, I?:
‘Dual frequency dual polarised crcsccnt-shaped microstrip antenna’. Proceedings ol‘ seventh national syniposiiini on Antennas and Propagation, Cochin, 2000, pp. 90-93
N A I R , K.G.: ‘Broadband dual frequency microstrip antcnna’, Electron.
Lett., 1996, 32, pp. 1531-1532
3 BAHL, I.J., and BIIARTIA, r.: ‘Microstrip antennas’ (Artecli tloiisc,
Dedham, MA, 1981)
2 DLI!PUKUMAR, M., GEOIIGI~, .I., AANAND.4N, C , K , MOIIANAN, P., >Uld
Detection of microcalcifications in
mammograms using local maxima and
adaptive wavelet transform analysis
A.M.
Bagci and A.E. Cetin
A incthod for coniputcr-aided diagnosis o r microcalcificalion cluster? in mammogram iinages is prcscnkd. R~icrocalcilicatioii clustcrs which
are an early sign of breast canccr appcar a s isolatcd bright spots i n inammogratns. Therefore thcy corrcspond to local inaxinla of the iinagc. Thc local maxima o r the iinagc is Lirst dctccted and thcy are ranked according to a higher-order statistical test perforincd ovcr thc subband domain data.
Introduction: Microcalcification clustcrs are an early sign of breast canccr. Thc survival ratc approaches I00 per cent if cancer is dctccted carly. Microcalcifications (MC) appcar as isolated bright spots on mammograms images [ 1-41,
MCs correspond to local maxima of a mammogram as thcy are relatively bright and tiny regions in the image. The first step of our mcthod is the detection of thc local maxima of the mammogram image. Although a typical mammogram is much smoother than most natural images there arc thousands of local maxima in a mammogram imagc. After detecting the maxima locations we rank them according to a higher-ordcr statistical test perforincd ovcr the subband domain data obtained by the adaptivc wavclct transform. The distribution of wavclct data corrcsponding to the regular brcast tissuc is almost Gaussian [3,4]. l-iowevcr, MCs arc different in naturc than regular breast tissue and they produce outliers in the subband domain. Wc take advantage of this fact and rank thc local maxiina according to a higher-order statistical test estiinatcd in the ncighbourhood of cach local maximum. When the data is Gaussian thc test statistics becomes zero. The highcr thc value of thc test, the higher the rank of the maximum. Peaks due to MCs receive high ranks. Thc maxima due to small variations in thc pixel values and smooth edgcs bccame low ranks.
We rccenlly developed methods for detection of MCs bascd on higher-ordcr statistics, and wavelct analysis [3, 41. In these schemes thc suhband (or unvclct) domain image J.r//,j
+
J-v//J+
J.rhr81 of the mammogram image x is dividcd into overlapping sinall windows and a higher-ordcr statistic (HOS) [5] is estimated in cach window. The windows with HOS values higher than a threshold value Tare marked as regions containing MC clustcrs. A weakness of the methods [3, 41 is that the threshold T should bc estimated from a set of training imagcs. Tlic threshold has to bc adjustcd from scanner to scanner and according to the data set. In addition, we computc thc HOS tcst only around maxima locations instcad of the entire imagc, thus achicving a compu- tationally morc cfficicnt method than [3, 41. Thc HOS test is reviewcd later in this Lettcr.Another important feature of this Lcttcr is that an adaptive wavelet (subband) transform [6] is used instead of a regular wavelet transform (WT). It is experimentally observed that adaptivc WT providcs better results than the ordinary Daubcchies WT.
Adiiplive wavelet trwnxf~rni: Classical adaptive prediction conccpts are combined with the perfect reconstruction filter bank theory in [6] whcrc the key idea is to dccorrelate the polyphasc components of the multichannel structurc using an adaptivc prcdictor P as shown in Fig. I . Adaptation of the prcdiclor coefficients are carried out by a least mean squarc (LMS)-type algorithm.
L i
Pig. 1 Analyis .rtnge of two-chiinnel cidtipiive ,filter honk striictiire
(P, represents un u&ip/ive predictor)
In Fig. 1, xl(n) is the downsamplcd vcrsion of the original signal, s(n), thus it consists of the even samples of x(n). Similarly, the signal x2(n) consists of the odd samples. An LMS-based FIR predictor ofx2(n) from s l ( n ) can bc expressed as ,i2(n) = w(n)x’{(n) where x , ( n ) = [xI(n - L), . . . , xl(n
+
L)]’ is the observation vcctor, and thc 2 L + 1 vector w(n) is thc vector of predictor cocfficicnts which is adapted by the equationwliere the error signal e(n) = xz(n) - i 2 ( n ) .
Thc filterbank struclurc shown in Fig. I is thc simplest adaptive wavclct transform (AWT) structure. In this structurc, thc ‘highband signal’ is essentially the prediction crror and as a result the subsignals are expectcd to be decorrelatcd. Othcr AWT structures with antialising filters for the upper branch signal can be found in [6].
This one-dimensional filtcrbauk is cxtcndcd to two dimensions in a separable manner. The main advantage of the AWT over the standard WT is the use of adaptive prediction to compute the subimages .qjZ,
and xi,h. Since MCs are isolated bright spots, they cannot be predicted using the background pixels corresponding to the breast tissue. ,4s a rcsult they produce outliers and the prediction error image pixels deviate from Gaussianity around MC locations. Conversely, back- ground pixels corresponding to the breast tissue are vcry effectively estimated by the adaptive filter.
The downsampling operation in the AWT docs not cause any data loss even if a MC consists of a single pixel. The AWT structure either tries to estimate this pixel by its neighbours or it is used in prediction of other pixels. In both cases it produces outliers in subimages as in the first case it cannot be predicted from its neighbours and in the second case it destroys the prediction process.
4 HOS test: Thc higher-order statistical (HOS) test used here is based
on thc sample estimates of the first four moments I , , 12, I,, and I4 of the wavelet data. Estimates of the moments are given by
~ k = I/(MX N)
CL,C&’=,ek[m,
/ I ] , IC= 1, 2, 3 , 4 where e =(Ix/J~I
+
lxhll+
Ixh/J). The subimages ,Y//~, xk/, x/i/l are obtainedfrom the AWT of the inammograin image. In the limit ll + p ,
12 + c2
+
p 2 , /, + p3+
3n2p and I4 + 1 1 ~+
6p2c2+
3c4, where / I and cr2 denote the incan and the variancc o r the error e, respectively. As a result, the statisticsh 3 ( I , , 1 2 , 1 3 ) = f 3 - 3 1 , ( 1 2 - I f ) - f ; (2)
(3) and
h4(ll, I,, 1,) = 14
+
21: - 3 1 .are equal to zero for Gaussian distributed data in the limit. When thcrc are outliers in the data, h and H dcviatc fiotn zero. The test statistic used in this Letter is H = h3
+
h4.I O
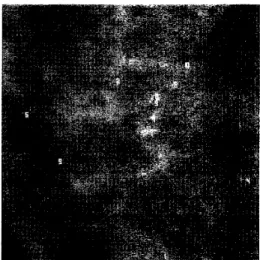
Fig. 2 384 x 384 region
of
image c06c beaks nzarlced 3, 7, 8; 4; and 5, lire niicroculc[ficutions)Detection method and experimentnl results: The detection algorithin consists of three steps. First, we analyse the mammogram image and detect the local maxima. We simply do this in two steps. We determine pixels withthe property t h a t x ( i , j ) > x ( i + / , j + l ) , IC, l = - 2 , - I , I , 2. We also divide the mammogram image into overlapping windows of size M = 15 x A‘= 15 and determine the pixels which are greater than 5% of the mean of cach block even if they do not satisfy the above condition. i n a 2 x 2 K mammogram image we detcrinine about 1000 candidate pixels for MC locations. I n the second step we process the image using the analysis part of the AWT structure described in the second section of this Letter and we obtain the quarter size image
IX//~I
+ +
I X / ~ J J .
In the third stcp, we estimate the higher-order statistic, H , in an M x N window around each maximum location and the maxima are ranked according to thcir H valuc. A typical output image with the first 10 maxima is shown in Fig. 2.Table 1: Ranks given to MCs by algorithm based on adaptive wavelet transform followed by HOS test (upper) and ordinary WT followcd by HOS test (lower)
cO9c I region 1, 4, 6 c13c 1 rcgion 3 . 7 c15c I region c l h c I region cl8c 2 regions
I
Detection results are suminarised in Tablc 1 for 13 mammograms obtained from the Nijinegen University and University of Florida databases which h a w bccn studicd by radiologists. For example, the image e050 has two regions containing MC clusters. The adaptive wavelct based method inarks the MCs in the first (second) cluster as 2 (5) whereas in the wavelet transform based ranking the same MCs are ranked as 14 and 121, respectively. The AWT-based test produces better results in terms of ranking accuracy, as shown in Tablc I ,
I n anothcr experiment the tnaxiina are ranked according to the variance around the maxima locations instead of the higher-order statistical (HOS) test. The average of ranks assigned to MC clusters by the AWT
+
HOS method is 4.28, whilc it is 9.6 in AWT and variance based ranking.Radiologists can use the proposed method as a computer-aided diagnosis tool to obtain a second opinion or to verify their findings.
83
iEE 2002Electronics Letters Online No: 20020907
Dol: I O . 1049/el:2OO2OYO7
A.M. Bagci and A. Enis (Department of Electrical and Electronics Engineering, Billent University, Anlcura, 06533, Turkey)
E-mail: [email protected]
24 April 2002
References
1 YOSl !IDA, H., et a/.: ‘An improved computer-assisted diagnostic scheme
using wavelct transform for dctcctiiig of clustered microcalcifications in digital mammograms’, Acud Rudiol., 1996, 3, pp, 621-627
2 STRICTLAND, R.N., and HAHN, H.I.: ‘Wavelet transforms for detecting microcalcifications in mammograms’, IEEE Trans. Med Inzag,, 1996,
15, pp. 218-229
3 GURCAN, M.N., YARDIMCI, Y., and CUTIN, A.E.: ‘Microcalcification
detection using adaptivc filtcring and Gaussianity tcsts’. Proc. of 4th Int. Workshop on Digital Mammography, Nijmegen, The Netherlands, 1998, pp, 157-164
GURCAN, hl.N., YAKDIMCI, Y., CETIN, A . E , and ANSARI, R.: ‘Detection O f
microcalcifications in maintnograins using higher order statistics’, IEEE Signal Process Lett., 1997, 4, ( X ) , pp. 21 3-216
4