A
LONGITUDINAL ANALYSIS OF SEARCH
ENGINE QUERY LOGS – TEMPORAL
COVERAGE
A THESIS
SUBMITTED TO THE DEPARTMENT OF COMPUTER ENGINEERING AND THE GRADUATE SCHOOL OF ENGINEERING AND SCIENCE
OF BILKENT UNIVERSITY
IN PARTIAL FULLFILMENT OF THE REQUIREMENTS FOR THE DEGREE OF
MASTER OF SCIENCE
By
Oğuz Yılmaz
September, 2012
iii
ABSTRACT
LONGITUDINAL ANALYSIS OF SEARCH ENGINE
QUERY LOGS – TEMPORAL COVERAGE
Oğuz Yılmaz
M.S. in Computer Engineering Supervisor: Prof. Dr. Özgür Ulusoy
September, 2012
The internet is growing day-by-day and the usage of web search engines is continuously increasing. Main page of browsers started by internet users is typically the home page of a search engine. To navigate a certain web site, most of the people prefer to type web sites’ name to search engine interface instead of using internet browsers’ address bar. Considering this important role of search engines as the main entry point to the web, we need to understand Web searching trends that are emerging over time. We believe that temporal analysis of returned query results by search engines reveals important insights for the current situation and future directions of web searching.
In this thesis, we provide a large-scale analysis of the evolution of query results obtained from a real search engine at two distant points in time, namely, in 2007 and 2010, for a set of 630000 real queries. Our analyses in this work attempt to find answers to several critical questions regarding the evolution of Web search results. We believe that this work, being a large-scale longitudinal analysis of query results, would shed some light on those questions.
iv
ÖZET
ARAMA MOTORU SORGU KAYITLARININ UZUN
SÜRELİ ANALİZİ – ZAMAN BOYUTLU KAPSAM
Oğuz Yılmaz
Bilgisayar Mühendisliği, Yüksek Lisans Tez Yöneticisi: Prof. Dr. Özgür Ulusoy
Eylül, 2012
Gün geçtikte Internet büyümekte ve Web arama motoru kullanımı sürekli artmaktadır. Kullanıcıların internet tarayıcılarını başlatıkları ana sayfa, genellikle bir arama motorunun giriş sayfasıdır. Kullanıcıların çoğunluğu belirli bir siteye erişmek için, Internet tarayıcısının adres çubuğunu kullanmak yerine, arama motorunun ara yüzüne Web sayfasının ismini yazmayı tercih etmektedir. Arama motorlarının Web’e giriş noktasındaki bu önemli rolünü göz önüne alarak, kullanıcıların zaman içerisinde ortaya çıkan Web arama eğilimlerini anlamaya yönelik bir ihtiyaç olduğunu söyleyebiliriz. Arama motorları tarafından dönen sorgu sonuçlarının zamana göre değişiminin analizi, Web üzerinde gerçekleştirilen arama işleminin mevcut durumu ve gelecekteki yönelimleri ile ilgili önemli noktaları açığa çıkaracaktır.
Tez çalışmamızda, 630000 gerçek sorgu seti için gerçek bir arama motoru tarafından 2007 ve 2010 yıllarında sağlanan iki ayrı zamana ait sorgu sonuçlarının büyük ölçekli analizini gerçekleştirdik. Yaptığımız analizler Web arama sonuçlarının gelişimi konusundaki bir kaç kritik soruya cevap aramaktadır. Çalışmamız, sorgu cevaplarının büyük ölçekli boylamsal analizi açısından, bu kritik sorulara ışık tutacaktır.
v
Acknowledgement
I would like to express my sincere gratitude to my supervisor Prof. Dr. Özgür Ulusoy for his invaluable guidance and understanding during this thesis.
I am thankful to Assoc. Prof. Dr. İbrahim Körpeoğlu and Assoc. Prof. Dr. Ahmet Coşar for kindly accepting to be in the committee and also for giving their precious time to read and review this thesis.
I am very grateful to Dr. İsmail Sengör Altıngövde for his endless support, guidance, and encouragement during this research. Furthermore, I would also like to thank to my colleagues Dr. Rifat Özcan and Şadiye Alıcı.
I am grateful to The Scientific and Technological Research Council of Turkey (TÜBİTAK-BİDEB) for the financial support they provided during the timespan of this thesis.
I would like to thank to my office mate Erdem Sarıgil for their friendship and our interrail trip. I would also like to thank my friends Durmuş, Sefa, Fehmi, Mehmet for their endless friendship. Also thank my friends Salim, Can, İsmail, Mustafa, Zeynep, Çağlar, Çağrı, Yiğit, Hayrettin, Saygın, Sami, Şükrü, Enver and Burak from Bilkent University for their valuable friendship and understanding.
I would also like express my gratitude to my family and my niece Nehir.
Last but not least, I would like to thank, Ceyda Sel, for being with me all the time. With very special thanks, I dedicate this thesis to her.
vi
Contents
1 INTRODUCTION ... 1
2 RELATED WORK ... 5
2.1 TEMPORAL ANALYSIS OF QUERY RESULTS ... 5
2.2 QUERY INTENT ... 8
2.3 CLASSIFICATION ... 9
2.4 DIVERSIFICATION OF SEARCH RESULTS ... 10
2.5 SENTIMENTAL ANALYSIS ... 10
3 TEMPORAL ANALYSIS USING DIFFERENT ASPECTS... 12
3.1 QUERY INTENT ... 16
3.2 DIVERSIFICATION OF QUERY RESULTS ... 18
3.3 SENTIMENT ANALYSIS ... 22
3.4 CLASSIFICATION ... 24
4 EXPERIMENTAL SETUP AND RESULTS ... 26
4.1 EXPERIMENTAL SETUP... 26
4.2 EXPERIMENTAL RESULTS ... 30
5 CONCLUSION ... 50
vii
List of Figures
1.1 Growth of the Internet from 1995 till today ... 2
3.1 Market share of top 5 search engines on May 2012 based on StatCounter data ... 13
3.2 The graphical representation of a word adopted by SentiWordNet ... 23
4.1 Result URL length ... 30
4.2 Result URL depth ... 31
4.3 Organizational extension overlap ... 32
4.4 Country extension overlap ... 33
4.5 Snippet similarity of search engine results at two distant times ... 38
4.6 Unique host count change ... 39
4.7 Evolution of country code for "tr" extension ... 40
4.8 Diversification of query results ... 43
viii
4.10 Number of occurrences of top-level Dmoz ... 46
ix
List of Tables
3.1 Different diversification levels for a sample query ... 20
4.1 Average snippet similarity scores for queries which return the same
document in 2007 and 2010 ... 34
4.2 Most frequent host names in 2007 and in 2010 ... 36
4.3 Count of queries which returned results from the same domain for
different cases ... 37
4.4 Search result overlap on the first results page of search engines in
February ... 41
4.5 Search result overlap on the first results page of search engines in August ... 41
4.6 Average triplet score of all queries in 2007 and 2010 ... 45
1
Chapter 1
Introduction
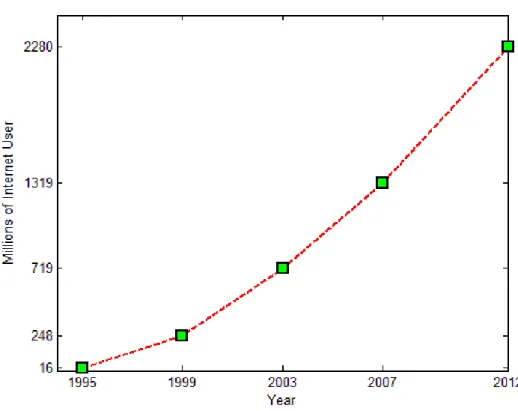
The Web is the largest community in terms of both content and users. The number of internet users has grown rapidly since mid-1990s [64], as shown in Figure 1.1. To obtain the most appropriate results from the web, nowadays search engines are considered as the only means. Search engines are the programs that present results in response to user queries specified in the form of keywords. Although web contains huge volumes of data, search engines generally present the most relevant results in less than a second when a user enters a query. In the past, most of the people were searching the required information beforehand in a set of encyclopedia which is allocated according to letters combination in alphabet. However web searching now helps people to find this information thanks to its effective index mechanism [63].
2
Figure 1.1: Growth of the Internet from 1995 till today
Many search engines were introduced since 1990 [5]. World Wide Web Worm (WWWW) is one of the first web search engines which indexed 110,000 web pages in 1994 [4]. The size of search engines index has shown an exponential increase with the growth of the web. Google index size is nowadays a little less than 50 billion [6].
The dynamicity of Web causes an increasing attention from the researchers as many studies investigating the changes in the Web content (e.g., [1]) and user queries (e.g., [2]) have emerged in the last years. While these works provide quite valuable insight on the dynamics of Web search, another important dimension is usually overlooked: How do the real life search engines react to this dynamicity? That is, how the changes in the underlying collection and in the search engine’s internal algorithms affect the query results presented to the end user?
3
In the literature lots of works have been done on considering temporal characteristics of web searching. These studies provide important insights into Web searching. In order to validate these findings considering search engines and time, new studies are required in addition to the existing ones. As Jansen et. al [3] said; “This is especially important because Web information systems are continually undergoing incremental, and sometimes radical, changes. Research is needed to evaluate the effect of these changes on system performance and on user searching behaviors over time”.
In this thesis, we provide a first large-scale analysis of the evolution of query results obtained from a real search engine at two distant points in time, namely, in 2007 and 2010, for the same set of 630,000 real life queries. As a common standard, search engines generally present ten results in their first result page. Most of the users are interested only in top 10 results and do not go beyond the first result page. That’s why search engines pay more importance to ranking strategy in order to provide the results in a more effective and efficient manner. For that reason we mostly considered the top 10 results of search engines in our analyses. In addition to data set mentioned above, we also collected query results for 2000 queries in Turkish language domain at two distant points in time. Thus, we have explored the behavior of different popular search engines in Turkish domain as well.
Our analyses attempt to find answers to several high-level questions regarding the evolution of Web search results, such as: How is the growth in Web reflected to top-ranked query results? Do the query results totally change within time? Does higher number of Web documents lead to results that are located deeper in the Web site hierarchies? Do the result titles and extracted snippets exhibit any variation in time? We believe that this work, being the largest-scale longitudinal analysis of query results, would shed some light on these questions. The results of this study are valuable both for search engine
4
designers and search engine users. Our comparative results may help people for their choices in web searching. The analysis we provide on the evolution of query results in Turkish language domain is another important contribution of this thesis.
The thesis is organized as follows. We present the literature background in the next Chapter. Detailed presentation of our analyses is provided in Chapter 3. Our findings take place in Chapter 4 and we summarize the entire work in Chapter 5.
5
Chapter 2
Related Work
Query logs are highly valuable assets for research community to understand the information needs of real users. In this thesis, we present a temporal analysis of query results using different resources, such as a large volume of queries from a real query log and relatively small data sets both in English and Turkish language domains. These analyses inspect queries and their results in several directions such as query intent, query classification, diversification of search results, and sentimental analysis of results. In this chapter, we provide the related work on each of these topics in the following sections.
2.1 Temporal Analysis of Query Results
The works that appear in the literature crawled the data hourly, daily [19, 30], weekly [1], at a specific point of time [28], or at two different points in time [9, 22, 25, 29, 32]. The common goal of these works is to provide detailed insights into different aspects of query logs such as queries, sessions, and click-throughs.
6
To show the dynamic nature of the web, some works [9, 10, 31] analyze changes in web considering different amounts of web pages. This kind of works aims to help designing more effective tools for users.
In a daily crawl work, Zhang and Moffat [19] used fifteen million user queries from United States provided by Microsoft MSN search service during one month period in May 2006. The authors present detailed analysis about queries, sessions, and click-throughs, and state that queries generally are more active on Monday, and a sharp decrease is observed over the weekend. Also user sessions are very short and the count of very frequent queries is low. In addition, users are generally interested in the first results page. The aim of that work is to improve search quality based on the obtained results. In another daily crawl work [30], 12-day MSN query logs were used, and randomly selected 10000 distinct users were used to evaluate personalized search strategies. The authors are interested in users with click information. Different evaluation metrics such as rank scoring, average rank, etc. to evaluate accuracy are used in that work. A significant improvement is observed only for the queries with large click entropy.
In a weekly crawl work [1], approximately 150 million HTML pages were crawled every week during a period of 11 weeks. Web crawlers are essential tools for downloading web pages [33]. Mercator web crawler was used for the crawling process. Fetterly et. al [1] state that it is important to understand the dynamic nature of the web to improve effectiveness of search engines. They investigated the issues such as whether web pages change a little or not, web site content is stable or not, as time passes, and so on. The results in that work indicate that changes in web pages occur in their markups and surprisingly large documents change more often than smaller ones.
In a work based on crawling the web data at a specific point in time [32], characterization of the Argentinian web domain was examined using 10 million
7
web pages. This work is similar to one part of our work to some extent. While in that work Argentinian web domain is used, we make use of Turkish web domain in our work as presented in Chapter 4. Studying national domains gives opportunity to analyze the features of a set of entities. Tolosa et.al [28] claims that it is the first work interested in Argentinian web domain, and to best of our knowledge, our analyses on Turkish domain is the first study in the literature. Almost half of the population (nearly 35 million people) use Internet in Turkey [34], and usually their first entry point to web is search engines. This situation shows the importance of understanding search characteristics in Turkish domain. Coming back to related work, we see that the work presented in [28] used Wire crawler for downloading web pages. The authors just consider pages which have the “.ar” extension in the first level domain. Most frequently used terms, page size, terms in site names, distribution of languages, pages age, url length, non-html documents, static vs. dynamic pages, file types etc. were analyzed as textual properties. The authors find that work valuable to improve user experience and suggest continuing to analyze the development process of the web.
As an example of the works which crawl at two different points, Jansen et. al analyzed nearly 575 million queries in AltaVista web search engine from 1998 to 2002 [9]. In our work, we analyze nearly 660000 queries in Yahoo! web search engine from 2007 to 2010. The main structure of two analyses can be considered to be similar. The aim of the work presented in [9] is to show the change in searching, and understand the characteristics of searching. Some aggregate results related with queries, terms, terms per query, session length, results pages viewed, etc. are provided. According to the presented results, interactivity between user and search engine increases, session times get longer, and the viewing percentage of not only the first result page but also consecutive pages increases. Also, the results about topical query classification are presented. For the classification, the authors randomly selected 2000 queries in 2002 and labeled these queries manually. In another work which also crawl the
8
web two different points in time, Jansen and Spink [29] used a million real queries submitted from real users to AlltheWeb.com which is a European search engine, both in February 2001 and May 2002. Regional differences and inclination in web searching, and the effectiveness of web search engines are looked into in that work. The experimental results obtained by changing query length, languages, session duration, number of documents viewed etc. are reported like in [9]. According to the results presented in that work, both the number of unique terms and the number of single query sessions increase. Up to 4 terms, the frequency of queries increases and then a sharp decline occurs. Like in [9], a sample of nearly 2500 random queries is classified. The authors discover that rank of the sexual content decreases. The study reveals some interesting searching patterns about the current state of European web searching.
2.2 Query Intent
In an early work on query intent, Rose and Levinson [16] try to understand the underlying goals of user searches. They classify search goals into three different categories, and different branches exist in some of these categories. Navigational, informational, and resource are the main search goals. According to the framework presented in that work, navigational queries are less prevalent than generally supposed. In one part of our work, which is performed in Turkish domain, we manually labeled the queries thanks to the user study conducted to understand query intent. We used nearly 660K queries as we mentioned before, and query intent information was obtained in an earlier work of our research group [35]. However in that data set, we do not have queries labeled as resource or transactional. Furthermore, informational queries are more prevalent than navigational queries in that set.
In another work related with query intent, Truran et.al [18] conduct experiments to measure search engine results stability and examine relationship
9
between user intent and result stability. Different from the other studies about query intention in the literature, the authors describe an additional query type called commercial. In the experiments, 10 queries are selected in each category (informational, navigational, transactional, and commercial) and submitted to search engine APIs every five days during two months. According to the results presented, informational query results are more stable than others. Another work on query intent [20], presents a query classification scheme. The differences of distribution, mutual information, the usage rate as anchor texts, and the POS information are used by this scheme for the classification. Also, additional algorithms are applied to obtain better results. In [21], classification is narrowed focusing on transactional queries applying an unsupervised approach. Using this approach, manual labeling effort is not required and a good classification accuracy is achieved. In [23], an automatic classification tool is provided. Some information for each category is presented to simplify categorization. Navigational queries contain company/business/organization/people names, and domain suffixes, etc. Transactional queries contain terms related to movies, songs, lyrics, obtain, download, etc. Informational queries use question words and contain informational terms such as list, playlist, etc.
2.3 Classification
Query classification based on topical information is crucial for search engines, because it may increase search engines’ retrieval effectiveness and efficiency. In [11], different approaches are presented for query classification. Conventional studies performed on search engine logs [3, 29] examine different metrics such as query and session length using whole data set resulting in some statistical outputs. However, the work presented in [17] considers topical information and examine the impact of query class on statistical results. The query log is segmented according to a previously developed classification algorithm and the characteristics of certain attributes are measured. The quality of classification is
10
evaluated by a group of users. Queries in particular classes indicate some specific features. For example, the longest queries belong to the category Places. Classes can also diversify according to click-through position and session length. The temporal characteristics of each category are also examined. The prevalence of a topical category may change as time passes. Based on certain characteristics of queries the authors observed, we can say that topical classification helps search engines in retrieval effectiveness and efficiency.
2.4 Diversification of Search Results
Understanding user intent is a hard task for search engines due to queries’ nature such as the length of query, or ambiguity in queries, etc. Therefore, search engines try to diversify search results for user satisfaction [7, 8, 26]. However a trade-off exists for search engines between result quality (i.e., presenting the most relevant results) and presenting diverse results in the first result page. In [24], the diversification performance of two search engines, Bing and Google was evaluated. Also, a diversification approach based on query suggestion was provided. Minack et.al [27] surveyed recent approaches to search result diversification in both full-text and structured content search.
2.5 Sentimental Analysis
For sentiment analysis (opinion mining), the works presented in [12, 13] used SentiWordNet which is a lexical resource in which each WORDNET synset s is associated to three numerical scores Obj(s), Pos(s) and Neg(s), describing respectively how objective, positive, and negative the terms contained in the synset are [14, 15]. Denecke [12] used SentiWordNet for multilingual text classification. In his work the document language is determined by means of the language identification classifier and if it is not in English, the document is
11
translated into English using translation software. Documents are classified using various approaches such as LingPipe –a text classification algorithm- classifier and SentiWordNet classifiers. To determine whether a sentence has positive or negative sentiment, a classification rule is defined. To sum up, if positive score is larger than or equal to negative score, then the sentence is classified as positive. Otherwise, it is classified as negative. It is proven that SentiWordNet is a reliable resource for sentiment analysis in a multilingual context. In another work in sentiment analysis [13], 14 controversial queries were used such as abortion, islam, cloning, marriage, etc. and these queries were submitted to three different search engine APIs. The aim of that work was to learn whether sentiment in query results varies or not for different search engines. Average sentiment scores in top five results for three search engines were compared using SentiWordNet. It was observed that there is no significant difference between the scores of search engines.
12
Chapter 3
Temporal Analysis Using Different
Aspects
In this chapter, we present our work on temporal analysis of web search results. We start this chapter with a brief introduction to related concepts, such as search engines, queries, query results, etc.
Search engines help us to find information on the web. When we type something using a search engine interface, the search engine presents the results in a list form which is a de facto standard [38]. The result list can contain web pages, images, videos, etc.
Web searching has become a daily behavior and search engines are used as the main entry point to the web by nearly 70% of the users [3, 23]. An abrupt increase is observed in people’s frequency of using search engines [36]. Based on those findings, it is obvious that in the future more people will give place to search engines in their daily life. Moreover, the increase in search engine profits fortifies this assertion. In worldwide some of the most popular search engines are Google, Bing, Baidu, Yahoo, Ask.com, Yandex, etc. The market share of
13
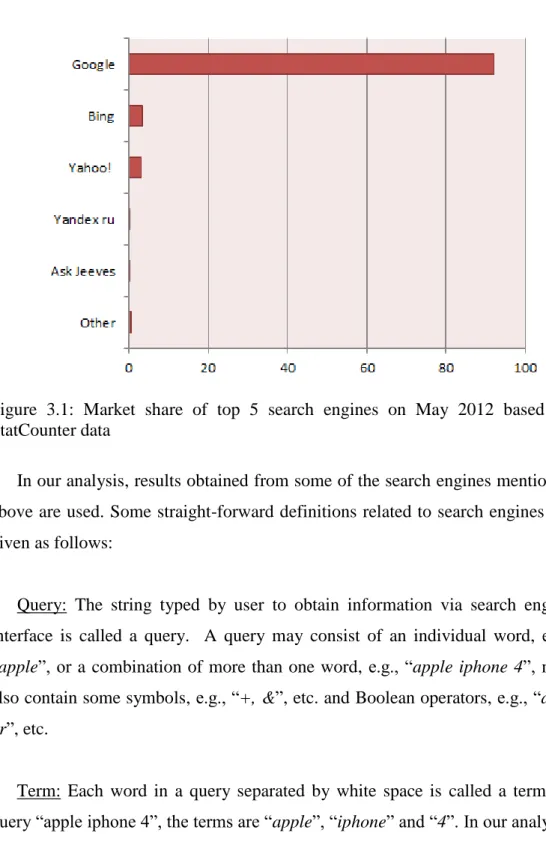
search engines in May 2012 is presented in Figure 3.1. As we see in the Figure, while Google mostly dominates the market, Yahoo and Bing having relatively few ratios come after Google. The ratios of search engines in the market are obtained from StatCounter which is a web traffic analysis tool [37].
Figure 3.1: Market share of top 5 search engines on May 2012 based on StatCounter data
In our analysis, results obtained from some of the search engines mentioned above are used. Some straight-forward definitions related to search engines are given as follows:
Query: The string typed by user to obtain information via search engine interface is called a query. A query may consist of an individual word, e.g., “apple”, or a combination of more than one word, e.g., “apple iphone 4”, may also contain some symbols, e.g., “+, &”, etc. and Boolean operators, e.g., “and,
or”, etc.
Term: Each word in a query separated by white space is called a term. In query “apple iphone 4”, the terms are “apple”, “iphone” and “4”. In our analyses
14
we used term count information in a query which is named as query length. In the example query given above (“apple iphone 4”), the query length is 3. Query length information is also used for search engine optimization [16].
Search engine results page: It present results to the user for a given query. It usually contains top-10 result [19, 39]. Also sponsored and advertorial links can be presented in search engine results page.
Result count: In the search engine result page, almost all search engines present how many results were found. For popular queries search engines can return millions of results, tons of pages. We used result count as a determinant feature in some of our analyses.
Rank: Search engines put results in order according to their relevance, popularity and other factors. Due to the importance of being first page results [19, 39], ranking is an important issue for search engines. The rank of the result at the highest position equals to 1, and following results are assigned respectively. In rank assignment process sponsored and advertorial links are ignored.
Title: Each result is generally presented by title, url, and snippet trio. Title usually contains terms from the user query and its derivatives. Clicking on the page title one can display the corresponding page.
Snippet: It presents a brief summary of the document. Like in title, snippet contains terms from the user query, and these terms are usually presented in boldface type. Based on a small user study, the authors estimate that “14% of highly relevant and 31% of relevant documents are never examined because their summary is judged irrelevant” [40]. That’s why snippet generation is an important issue for search engines as well as ranking strategy.
15
Url: Web address of a search result is denoted by url. Url information is very valuable for our analyses; for instance, we measure url overlap in two distant times using Jaccard Similarity.
Jaccard Similarity: In daily life, people generally compare two different things in the same concept and ask how similar two models are? To answer this question, Jaccard similarity, in other words Jaccard index can be used. It is a statistical measure between sample sets. Let’s assume we have two sets A and B. Jaccard similarity is defined as the cardinality of intersection of A and B divided by the cardinality of union of A and B [41]. In our analyses we use Jaccard similarity frequently. In mathematical notation we can show this as follows:
Some of the features required for our analyses are not provided in search engine html or its’ API explicitly. Thus we have extracted the following features from url information:
Host: A standard URL usually starts with protocol information such as http, https, then continues with abbreviation of world wide web, i.e., www, after that if sub-domain does not exist, main domain comes. To obtain host information of a url, we split all protocol information, any tag, and symbol. For example, url is “http://www.google.com.tr”, host is “google.com.tr”.
Organizational extensions: Organizational extension takes place between the main domain of web site and country code if available. Some common organizational extensions are com, org, net, gov, etc. In the example url above (“http://www.google.com.tr”), organizational extension is “com”.
Country codes: The last part of the url gives us country code information. Generally web-sites do not contain county code. If url of a result does not
16
contain country code, we assign it “def” code as default. Some common country codes are us, uk, de, ru, tr, etc. The prevalence of regional specific results is presented in the next chapter.
In the following sections we present our work on temporal analysis of web search results considering different aspects.
3.1 Query Intent
Understanding user query goal helps search engine designers for optimization, relevance, user interface design etc. [16]. In this section, we try to find answer to the question of “what a user is aiming at with his search?”. We investigate whether the user wants to get information on something, or navigate to a specific web page, or perform additional operations such as downloading, buying, etc.? For the sake of user satisfaction, fundamentally, queries can be divided into three different classes according to their intent. These classes are informational, navigational, and transactional.
i. Informational queries: The main goal is to obtain information about the query topic. For example, “what is a crawler”, “education system in Turkey”, “iphone 4 features”, etc.
ii. Navigational queries: This kind of queries focuses to navigate certain web cites. For example, “milliyet.com”, “bilkent university”, “unicef”, “facebook”, etc.
iii. Transactional queries: Transactional queries provide web-sites where user can perform a certain internet based transaction defined in user query. For example, “download shutter island movie”, “buy flight ticket”, “vote mvp in nba playoffs”, etc.
17
As we mention in Chapter 2.2 a work in the literature [18] describes one more class for query intent which is commercial. However this case is ignored in our work, because the distinction between transactional and commercial classes is not so explicit.
Discovering intent of a query is performed in two ways: Automatic classification and manual classification. Automatic classification may need a machine learning approach and also require to train the system with already classified queries. On the other hand, for manual classification some definitions [23] might be used for user goal deduction by looking at the query itself. The characteristics of each category are as follows [23]:
Informational searching:
question words are used (i.e., ‘ways to’, ‘how to’, ‘what is’, etc.);
queries include natural language terms;
queries contain informational terms (e.g. list, playlist, etc.);
queries beyond the first query are submitted;
the searcher views multiple results pages;
query length is usually greater than 2.
Navigational searching:
queries contain company/business/organization;
queries contain domains suffixes;
queries specify ‘Web’ as the source;
query length is usually less than 3; and
the searcher views the first results page.
Transactional searching:
queries contain terms related to movies, songs, lyrics, recipes, images, humor, and porn;
18
queries have ‘obtaining’ terms (e.g. lyrics, recipes, etc.);
queries have ‘download’ terms (e.g. download, software, etc.);
queries are related to image, audio, or video collections;
queries specify ‘audio’, ‘images’, or ‘video’ as the source;
queries have ‘entertainment’ terms (pictures, games, etc.);
queries have ‘interact’ terms (e.g. buy, chat, etc.); and
queries contain movies, songs, lyrics, images, and multimedia or compression file extensions (jpeg, zip, etc.).
Although above characteristics do not cover all cases, it may help researcher to a great extent. Due to their nature, some queries may be vague or multi-facet, and we may ignore such minor exceptions.
While in one part of our work, query intents are obtained from an earlier work of our research group [35], in the second part of our work, a user study is conducted to determine query intent. In this study, not only query intents, but also topical query classes, named entities, etc. are determined. The guide in the user study for query intent decision is based on Jansen et.al’s work [23]. In most of our analysis the differences and similarities in temporal change are observed considering intent behind the query.
3.2 Diversification of Query Results
Queries submitted by search engine users are usually short and ambiguous. The clear implication of user may not be clear at the first glance, due to queries’ nature. Different meanings can exist for an ambiguous query. For example, let’s assume that the user query is “jaguar”. This query may nowadays refer to more than one meaning. The query may relate with car brand jaguar, or animal jaguar, else operating system jaguar, etc. Therefore, search engine decision mechanism should not focus on just one direction such as car brand or animal.
19
Because of the lack of knowledge about user intent, search engine should diversify its results to satisfy user with at least one or two results. On the contrary, when results cover just one topic, user may switch to another search engine resulting in profit loss for the first search engine. The diversity described above refers to word-sense level diversity. However diversity can also be required and achieved at information-resource level as different resources may exist for a particular word-sense.
For the purposes of our analysis, the above discussion is extended and two orthogonal dimensions of diversification are defined, namely, domain name and content. The first dimension (i.e., domain (host) name) represents the diversification based on the domain of the result URLs. Note that, host collapsing (i.e., including the highest scoring, say two, results from each host) is a commonly applied practice by search engines. Based on our observations on the dataset, diversification on the domain name dimension is further refined and four levels of diversification are defined, as follows:
For a given answer ai from the top-k result set R, we strip all protocol information (http, www, etc.) from the host name of the answer. It is assumed that the remaining host name hi of an answer ai is composed of four substrings, as S.D.E.C where S is the sub-domain of the host name (if more than one, all are concatenated to one string; note that this is not common at top results), D is the main domain name, E is the organizational extension, and C is the country extension. For instance, for the hostname “web-ir.group.cs.bilkent.edu.tr”, S = web-ir.group.cs, D = bilkent, E = edu, C = tr.
For any given two answers ai with Si, Di, Ei, Ci and aj with Sj, Dj, Ej, Cj from the top-k result set R, we consider four levels of diversity:
20
File-path level diversity: In this level of diversity, host names are exactly the same, and the rest of the path to the resource differs (i.e., Si = Sj, Di =
Dj, Ei = Ej, Ci = Cj).
Sub-domain level diversity: Two host names only differ with respect to sub-domain names; i.e, Di = Dj, Ei = Ej, Ci = Cj but Si ≠ Sj. In this case, the resources are retrieved from the same organization located in a particular country, but from its different divisions.
Country level diversity: Host names have the same main domain and extension, but located in different countries, which may or may not be parts of the same entity (Di = Dj, Ei = Ej, Ci ≠ Cj, Si dontCare Sj).
Main domain and extension level diversity: In this case, results are diverse with respect to main domain name and organizational extension, i.e., Di ≠ Dj and Ei ≠ Ej (sub-domains and county components are irrelevant).
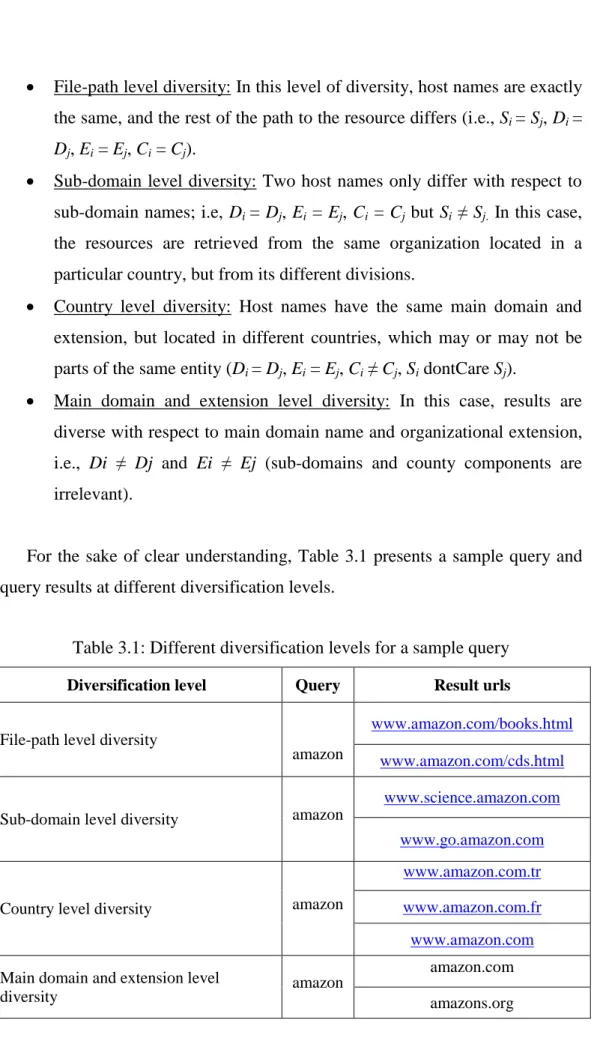
For the sake of clear understanding, Table 3.1 presents a sample query and query results at different diversification levels.
Table 3.1: Different diversification levels for a sample query
Diversification level Query Result urls
File-path level diversity
amazon
www.amazon.com/books.html www.amazon.com/cds.html
Sub-domain level diversity amazon
www.science.amazon.com www.go.amazon.com
Country level diversity amazon
www.amazon.com.tr www.amazon.com.fr www.amazon.com
Main domain and extension level
diversity amazon
amazon.com amazons.org
21
The second dimension of diversification is the content. Ideally, there are three levels:
Level 0 - No diversification, where results include very similar or almost duplicate content are returned.
Level 1 – Syntactic/surface-diversification, where result contents are different but on a single aspect.
Level 2 – Semantic/deep-diversification, where result contents are different and cover different aspects (note that definitions of aspects depend on the broadness of the initial query).
Obviously, for any large query log, it is almost impossible to automatically evaluate diversification at level 2, or even level 1, without explicit knowledge of the different aspects of the queries at hand. Instead, we take an approach that would approximate the above diversification levels, and compute the average pairwise similarity of the top-k results for every query. The higher similarity values would converge to level 0, whereas the lower values would probably imply diversity at level 1 or 2. Note that, pairwise similarity of results is also used by several diversification approaches while computing the diversity objective function. In our analysis, while computing similarity titles and snippets are used as the representative of the result documents. Cosine similarity is used to measure similarity between query results.
Cosine Similarity: Using this metric, cosine of the angle between two vectors is measured [42]. According to the result, it is determined whether two vectors are similar or not. Cosine similarity is a commonly used metric in information retrieval. In our analyses, the elements of a vector are terms in title, and snippet for a query. Since the term frequencies (tf-idf weights) cannot be negative, the cosine similarity of two documents will range from 0 to 1 [42]. The tf*idf weight (term frequency–inverse document frequency) is a numerical
22
statistic. Using this measure we understand the importance of a word in a document in a collection or corpus [43].
3.3 Sentiment Analysis
The web is a rich source in terms of attitudes, opinions, and emotions expressed by internet user about a specific topic. With the increase in the utilization of social media such as blogs, social web-sites etc., we can say that the web nowadays provides more subjective contents. Thus, we wonder the change in sentimental meaning of search engine results as time passes and want to understand search engine’s behavior.
In our daily life we can categorize our opinions as positive, objective, or negative on a specific topic, good, service, or person, etc. When you visit a restaurant to eat something, after the service we can say that the foods and service was great as a positive opinion, or everything was disgusting as a negative opinion, else it was ok as an objective opinion. Furthermore, an opinion may also be strong positive or negative, and weak positive or negative. But we ignore degree of the opinions.
If we consider search engines as a reflection of the web or the prototype of the web content, it is a good opportunity to examine search engine results to understand the common view of the web, and behavior of search engines. A query result can be classified according to sentiment such as positive, objective, or negative [13]. In our work, to extract the sentiment information in query results we use SentiWordNet lexicon [14].
23
3.3.1 SentiWordNet
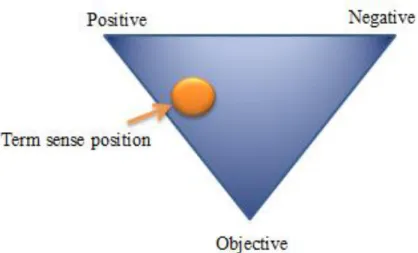
SentiWordNet is a publicly available lexicon resource for opinion mining [14]. This lexicon contains textual descriptions of terms [13]. A word in the sentence may have more than one meaning, and SentiWordNet provides positive, negative, or objective scores for each meaning of a word. For the sake of clarity, we present Figure 3.2, which is obtained from SentiWordNet web-based graphical user interface [14].
Figure 3.2: The graphical representation of a word adopted by SentiWordNet
SentiWordNet provides three numerical scores for each class (positive, negative, and objective) range in [0, 1] and sum of these scores is always equal to 1.0. Based on these descriptions a triple of three sentiment values is obtained like positive-score, objective-score, and negative-score. A term in the sentences can be adjective, adverb, noun, verb, etc. To calculate the sentiment score of a term, firstly the actual role of the term in the sentences should be found. If it is decided that the term is adjective, then the average of scores of this term in adjective class is taken.
Let’s consider an example: the word “last” has nine sentiment scores when it is adjective, eight sentiment scores when it is noun, two sentiment scores when it is adverb, and two sentiment scores when it is verb according to textual
24
information in SentiWordNet. To learn the actual role of a word in the sentences part-of-speech tagger is required. “A Part-Of-Speech Tagger (POS Tagger) is a piece of software that reads text in some language and assigns parts of speech to each word (and other token), such as noun, verb, adjective, etc.” As part-of-speech-tagger we use “Stanford Log-linear Part-Of-Speech Tagger” [44].
In Chapter 4, our approaches, results, and comments in sentiment analysis are presented. We mostly used words in title and snippet to extract opinions.
3.4 Classification
Query classification is an important concept in longitudinal analysis [48] and it has wide application areas: improvements in effectiveness and efficiency of search engines, page ranking, advertisement policy of search engine, personalization, etc. [46, 47]. Our aim with query classification analysis is to learn which query classes are prevalent in two different times, and to check existence of the concept drift issue which shows changes in features of a certain query as time passes [49].
To classify queries we use Open Directory Project (DMOZ) which is “the largest, most comprehensive human-edited directory of the Web. It is constructed and maintained by a vast, global community of volunteer editors” [45]. Dmoz provides major classes such as Arts, Games, Sports, etc. and also sub-classes for each class. In our classification analysis, top-10 urls of query results are considered. If a url exists in Dmoz database, this information is kept until at least 2 more matches exist for the same query. When at least 3 url matches occur in dmoz database, a class is assigned to the query based on majority voting, obtaining more reliable results. If a tie-break case exists, class is randomly assigned to one of the classes that have race in tie-break. We can explain the class assignment process through an example: 4 urls match in dmoz
25
for a query result. Let’s assume two of them are from Games class, and the other two from Sports class. Here tie-break exists and randomly one of the Games and Sports classes is chosen.
In our dataset 15 different classes exist which are: Arts, Business, Computers, Games, Health, Home, News, Recreation, Reference, Regional, Science, Shopping, Society, Sports, and World. As will be shown in the next chapter, the class for a specific query may change as time passes. We were interested in the difference in assigned classes, and thus examined queries and results. One of the reasons of the difference is query re-write operations of search engine. For example, consider the query “cent”; in 2007 this query was assigned to Art class, however in 2010 the query is re-written as “cnet” due to search engine re-write policy, and it is assigned to Computers class. The other reason for class change is concept drift. Consider the following example: “loading” was related to just carriage, transport, cargo, etc. a few years ago. However, nowadays this term is used mostly for computers to mean operating system start, or used in games industry for the intro of the game. As time passes technology develops and technical terminology takes up more space in human life. Thus a search engine should change its ranking policy considering concept popularity and represent new results different from the previous or old concept. In our classification analysis presented in Chapter 4, we check whether concept drift exists or not between two distant times. Another reason of the difference in class assignment arises from random assignment in tie-break case of the same queries.
26
Chapter 4
Experimental Setup and Results
We have presented various aspects in longitudinal studies on web search results in Chapter 3. We have performed lots of analyses considering these aspects in different data sets. The detailed explanation of our experiments, data sets, experimental results, and our comments on results are provided in the following sections.
4.1 Experimental Setup
In the previous chapter, we have mentioned about what kind of observations can be traced. However, some analyses focus on a specific domain; other ones need huge volumes of data, etc. That’s why we first provide the characteristics of our data sets and explain how we store and use these data sets.
4.1.1 Dataset
27
i. AOL Data set: This data set consists of 630,000 unique queries that are randomly sampled from AOL Query Log [50]. For these queries, top-100 results were obtained from Web using Yahoo!’s public search API, twice: in June, 2007 and in December, 2010. Experiments spanned the entire month in each case, due to large number of queries. We identified a few Web sites that only listed all AOL query strings and removed them from the results as they are not real answers. Lots of our analyses are based on AOL data set due to the availability of huge volume of real log. ii. Turkish Data set: While AOL data set is in English domain, this data set
is in Turkish domain, and this is the major difference between these two sets. Another feature that is specific to the Turkish data set is that we used four different search engines in constructing this set which are Bing, Google, Yahoo, and Yandex, while in AOL data set we just used Yahoo search engine. Moreover, here we do not have explicit queries beforehand. To obtain data in the AOL data set, we used the search engine’s publicly available APIs. However, search engine APIs are nowadays closed to both research and commercial purposes. That’s why we employed our own crawler for downloading html web pages. After downloading web pages, it was required to extract useful information from html pages such as url, title, snippet, result count etc. Our query selection strategy can be explained as follows: We collected Turkish queries using Bing [51], Google [52], Yahoo [53], and Yandex [54] suggestion APIs; fortunately suggestion APIs are still available for public usage. This work comprises of several steps. In the first step, we sent to each API all three letter combinations in Turkish alphabet and each API returned some suggestions. Then, we sent again these returned suggestions to each API.
The following algorithm provides the pseudo-code for creating query corpus.
28
Algorithm 1 Sample pseudo-codes for creating query corpus procedure Create_Corpus()
declare alphabet {a, b, c, … , v, y, z} › Array of all letters in Turkish alphabet declare search_engine {bing , …, yandex} › Array of four search
engines for i := 0 to alphabet.length do
for j := 0 to alphabet.length do for k := 0 to alphabet.length do
word := alphabet[i] + alphabet[j] + alphabet[k]
› Combination of all three letter words (meaningful and not-meaningful) for m:= 0 to search_engine.length do Submit_Word_Suggestion_Api(word, search_engine[m]) end for end for end for end for
procedure Submit_Word _Suggestion_Api(word, search_engine) url search_engine + word
set url_connection
set request_property(user_agent, browser-type) write_to_txt_file(url_connection.get(), encoding)
In the second step, we sent “letter + blank + letter” and “letter +
letter + blank” combinations to each API. In the third step, we created
two different sets which we call item1 and item2 based on the first and second steps. Item1 set consists of just one word unique suggestions. Item2 is created using suggestions which contain more than one word. We split the queries containing more than one word and ignored the words which occur in item1 list. Item2 list contains just one word unique suggestions like item1; however, two lists are totally different from each other. Our aim here is to expand our Turkish query database. By this means, when we select queries randomly from our Turkish database, there will not be any bias for queries. In the fourth step, we also used the
Milliyet (daily Turkish newspaper) data set which was collected in an
earlier work of our research group. In this step, we applied a stemming procedure. Item1, item2 and Milliyet data sets were stemmed as 4 letters.
29
These stemmed words were sent to each API again. The next step is very similar to Step 4; the stemming procedure is applied as 5 letters and these words were sent to each API. The aim of the following step was to learn whether the words in queries are totally Turkish or not. To check it, we used Turkish natural language processing tool Zemberek [55] in Google and Yandex suggestions. After that, we obtained unique query lists for each search engine. Then we randomly selected 250 queries from each search engine adding up to total 1000 queries. In addition to this, we combined all the lists constructing a unique list. We selected randomly additional 1000 queries. As a result, we obtained total 2000 queries and all of these queries were sent to each search engine interface by our script and the returned result pages in html were stored. This procedure was applied in two different times, in February 2012 and August 2012, like in constructing the AOL data set.
4.1.2 Simulation setup
In order to perform the experiments we need to store query and result information in a well-defined structure. To this end, we use a relational database [56] schema, which enables us to use SQL queries in some analyses. We use MySQL database system for storage. For the AOL data set, due to the huge volumes of data, we required to handle complex database operations such as join of more than one table relatively in short times. The server we use runs Linux operating system and has 32 GB memory. For the Turkish data set, we use a PC for database setup due to character encoding issue in Turkish language. The PC has two cores CPU with 2 GB memory. We store queries with a unique id, and query results are matched with this id. It was required to create indexes on some frequently used fields in the analyses. New tables and records can be easily added, deleted, and updated in our database schema.
30
4.2 Experimental Results
Throughout the experiments, we try to learn web searching trends to deduce interesting finding about the future. Most of our analyses are related with AOL data set. Like in Chapter 2 and Chapter 3, we present results, plots, tables, comments, etc. in separate sections organized according to different aspects of analysis. However, we start with some general analysis on the different data sets to see the change in general searching characteristics.
4.2.1 General analysis on AOL data set
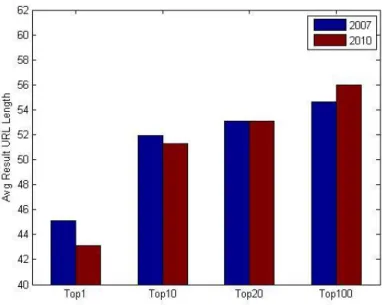
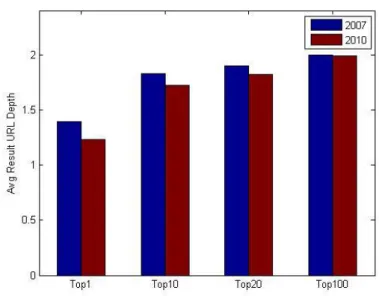
In Figures 4.1 and 4.2, we report the average length (in bytes) and depth of unique result URLs, respectively (the domain name is assumed to have a depth of 0). We investigate whether the increase in the number of documents causes a search engine to retrieve pages that are located in a deeper position at a Web site.
31
Figure 4.2: Result URL depth
In contrary to expectation, both URL length and depth decrease in 2010, which means that search engines prefer to retrieve pages at the top level of a domain most of the time. We also observed that the length and depth of URLs increase for those results that are ranked lower. The assessment of statistical significance of results is done using one sample t-test and paired t-test. In the tests 95% confidence interval is used (p < 0.05). In order to decrease t-test process duration, instead of comparing all paired top-10 results, we choose a hundred query results both in 2007 and in 2010. However, to make sure whether selected results can represent the entire data set or not for each year, we applied one sample t-test for top-10 results. According to test results, both in 2007 and 2010, at the 0.05 level, the population mean is not significantly different with the test mean in average url length experiment. That’s why we used these limited data sets for the paired t-tests. Our aim in paired t-tests is to compare the behavior of search engines for the same queries. When we consider average url length for top-10 results, at the 0.05 level, the samples are not significantly different.
32
We also made a query-wise analysis of our data. Our aim here is to discover the behavior of the search engine at two distant times by calculating some overlapped features such as dynamic url, domain, country, organizational extension, file extension, etc. In those experiments, we first computed the number of unique features in top-k results of a query in 2007 and in 2010. Then we found the number of overlapped unique features. Finally, we calculated the feature wise jaccard similarity using those numbers. For the sake of better understanding, let’s assume 5 different file type extensions (doc, docx, rdf, pdf, html) existing in top-10 results of a query in 2007, and 3 different file type extensions (pdf, html, xls) existing in top-10 results of a query in 2010. The number of overlapped file type extensions is 2 (pdf, html). Jaccard similarity score of that feature of the query is – . Based on that approach we present some results considering different features.
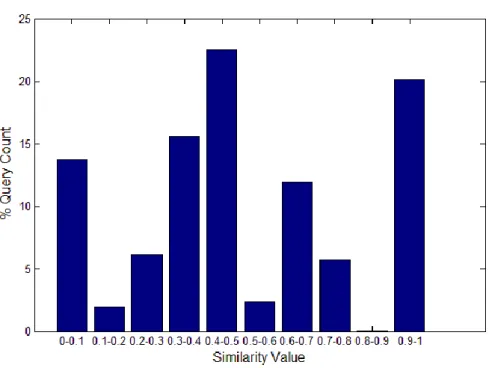
As we have stated in Chapter 3, some common organizational extensions are com, org, net, edu, etc. The unique organizational extension overlap of query results is presented in Figure 4.3.
33
Generally speaking, half of the organizational extensions of query results show similarities at two distant times. Furthermore, the query count ratio of the right-most column of the figure is higher than most of others. The high proportion of the results in our query set have “com” as an organizational extension. That’s why overlap score of those kinds of query results is 1.
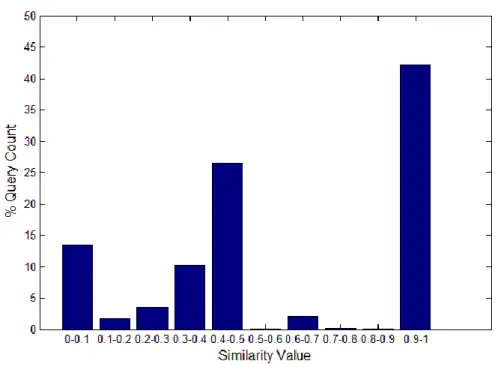
We measured the overlap of country codes which are us, tr, uk, etc. If a url does not contain country code information, we assigned def (default) keyword. The overlap of country codes is shown in Figure 4.4.
Figure 4.4: Country extension overlap
As it is seen in the figure, the country codes are too similar at two distant times, because most of the results have “def” keyword as country code information. Although the high proportion of the query results does not contain country code extension, the returned results contain various country information which are different from “def”.
34
We also examined the change in snippet generation process of the search engine. Our aim with this experiment is to learn whether generated snippets were changed or remained the same, if the same url was returned for a specific query in two different times.
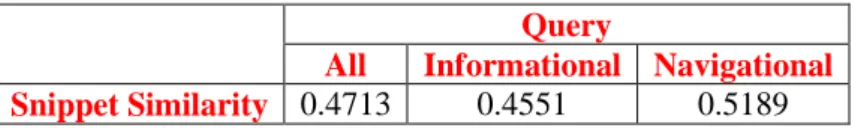
To calculate the similarity between the same documents’ snippets, we used Jaccard metric. In the preparation step of that analysis, we ignored stop-words and extracted individual words from snippets using delimiters. In the AOL data set top-10 results were evaluated. ~314K unique queries returned the same document and ~566K <query, document> pairs were observed. The contents of the snippet of ~141K documents (1/4 of <query, document> pair) are completely the same, in other words their jaccard similarity score equals to 1, while the contents of the snippet of ~36K documents (1/15 of <query, document> pair) are totally changed, in other words their jaccard similarity score equals to 0. We present the average snippet similarity scores in Table 4.1 for all ~566K <query,
document> pairs.
Table 4.1: Average snippet similarity scores for queries which return the same document in 2007 and 2010
Query
All Informational Navigational Snippet Similarity 0.4713 0.4551 0.5189
If the same documents were returned by the search engine both in 2007 and in 2010, the average of their snippets similarity is computed as 0.47. Almost half of the contents of a snippet are changed as time passes, due to the search engine’s snippet generation policy.
According to the results, snippet similarity is higher in navigational queries than that in transactional queries, if the same documents returned by the search engine exist in both 2007 and 2010. As the web has a dynamic structure, information is added, deleted, or updated continuously. For example, when a
35
user searches for a movie just by typing it’s name (e.g., “titanic”) based on navigational intent in two different times, most of the returned results present movie’s publish date, director, cast and summary in their snippets. The returned information does not exposure to too much change in snippet generation as time passes, because almost all presented information are static (i.e., publish date, director name, cast, etc.). However, when the user adds one more term to his query (e.g., “titanic reviews”) based on informational intent, the returned snippets will most probably change as time passes. Because new reviews can be added or existing reviews can be changed, or some reviews can be deleted.
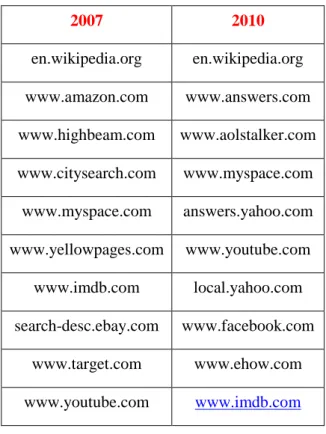
Another experiment is related with domains under the scope of general analyses. Appearance of hosts is a crucial concept in longitudinal analysis. We wonder the most popular web-sites and hosts in 2007 and in 2010. Before counting unique hosts in our dataset we used query frequency information. In other words, our results can be considered query frequency-weighted domain analysis to present more reliable results.
According to our results, in both years “en.wikipedia.org” has the highest rank. The top web-sites show similarities to some extent in 2007 and in 2010 that is shown in Table 4.2.
36
Table 4.2: Most frequent host names in 2007 and in 2010
2007 2010 en.wikipedia.org en.wikipedia.org www.amazon.com www.answers.com www.highbeam.com www.aolstalker.com www.citysearch.com www.myspace.com www.myspace.com answers.yahoo.com www.yellowpages.com www.youtube.com www.imdb.com local.yahoo.com search-desc.ebay.com www.facebook.com www.target.com www.ehow.com www.youtube.com www.imdb.com
Most of the top-10 domains found in the work of Mika et.al [57] overlap with our results. This means that top-10 popular web-sites keep their popularities during years. Also some web-sites’ prevalence increases, such as “www.facebook.com” which as we know is nowadays the most popular social network organization.
Furthermore with the scope of domain analysis experiment, we would like to validate a statement presented in [57] that is “as a general rule Yahoo does not return more than two results from the same host except when the query is a URL or site query”. To validate this quote we present the results in Table 4.3.
37
Table 4.3: Count of queries which returned results from the same domain for different cases
> 2 results from the same host all 10 results from the same host Informational Navigational Informational Navigational
2007 5973 32809 230 13853
2010 510 2374 6 181
In 2007 ~38K queries return more than two results from the same host, ~6K of these queries are informational and ~32K of them are navigational. We also examined queries which return all the results from the same host in their top-10 result list. In other words, all the results for a query are returned from just one domain. In 2007, ~14 K query results belong to just one domain. ~0.2K of these queries are informational and ~13K are navigational. In 2010 ~2.8K queries return more than two results from the same host, ~0.5K of these queries are informational and ~2.3K are navigational. In 2010, just 187 query results belong to only one domain. 6 of them are informational and 181 are navigational. According to these results it is obvious that as time passes search engines tend not to return more results from the same domain. Additionally, navigational queries are more biased towards to returning results from a single domain compared to informational queries.
4.2.2 General analysis on Turkish data set
We repeated some of the experiments described in the previous section in Turkish data set as well.
We calculated the snippet similarity using all four search engine results obtained at two distant times (in February 2012 and in August2012) for each search engine. To measure similarity we used the Jaccard metric. We ignored stop-words which are described in Can et.al’s work [58]. Our aim is to learn whether search engines change their presented results in the first page of
38
returned results and change the snippet generation algorithm in the short time distance. The results are presented in Figure 4.5.
Figure 4.5: Snippet similarity of search engine results at two distant times
According to the Figure 4.5, we can say that Google’s presented results are more similar than those of the other search engines. Yandex has the lowest similarity score. Because of the late entrance to Turkish search market, web pages indexed by Yandex may differ easily as time passes. Some additional analyses for Turkish data set may increase our understanding.
Another experiment we performed using Turkish data set is related with unique hosts. We examined the change in the number of unique hosts as time passes. We present the change in the number of unique hosts in Figure 4.6.
39
Figure 4.6: Unique host count change
In contrary to expectations, the number of unique hosts decreases in August especially with Google and Yandex, although Yandex has the highest number of unique hosts in February. We also check the number of returned results for each query. Apart from Google, the other search engines returned more results in August than those in February.
Furthermore, we investigate the prevalence of web sites which have “tr” extension located in search engine result urls. The differences and similarities between search engines considering time aspect can help user in web searching especially when requiring to reach web sites from Turkey. The evolution of country code for “tr” extension is presented in Figure 4.7.
40
Figure 4.7: Evolution of country code for "tr" extension
According to Figure 4.7, as time passes, all four search engines present more results from web sites in Turkey. Especially Google’s top-10 results have more tendency to web sites from Turkey than other search engines’ results. However, Yandex has the highest ratio in August.
In another experiment, we measured the unique and shared urls which are returned by more than one search engine. To be more specific, let’s consider that the query is “akor tablosu” and “http://www.gitardersi.com/Icerik02-Akor.asp”
is one of the top-10 urls returned by a search engine for this query. If this url is returned by just one search engine, it is evaluated as unique to that search engine. However if more than one search engine return the same url, then according to the number of those search engines we put the url to a suitable level (i.e., two engines, three engines or all four engines as stated in Table 4.4 and Table 4.5 headers). Our aim is to learn which search engines return similar results (same results) and the change on that situation as time passes. The experiments results are presented in Table 4.4 and Table 4.5.