1
Modulation of Multilayer InAs Quantum Dot Waveguides
under Applied Electric Field
Imran B. Akca1, Aykutlu Dana2, Atilla Aydinli2, Marco Rossetti3, Lianhe Li3, Andrea Fiore3, N. Dagli4 Material Science and Nanotechnology Program, Bilkent University, Ankara, Turkey1
Material Science and Nanotechnology Program and Physics Department, Bilkent University, Ankara, Turkey2 Institute of Quantum Electronics and Photonics, Ecole Polytechnique Fédérale de Lausanne EPFL,
CH-1015 Lausanne, Switzerland3
ECE Department, University of California at Santa Barbara, California, USA4 1[email protected]
Abstract: Electric field dependence of optical modulation in self assembled InAs quantum dot waveguides have been studied at 1300 and 1500 nm. Electro-absorption and electro-optic coefficients of these waveguides have been obtained at both wavelengths.
©2007 Optical Society of America
OCIS codes: (230.4110) Modulators; (250.7360) Waveguide modulators
Semiconductor quantum wells and quantum dots are known to be good candidates for switching and modulation devices in photonic integrated circuits [1]. In this regard, we characterized the electro-absorption and electro-optic properties of multilayer InAs quantum dot waveguides at 1309 and 1515nm.
We worked on three layers (3QDs) of quantum dots with the lengths of 1, 1.3, 1.6 mm. The samples are grown by molecular beam epitaxy. The active region is formed by three layers of self-assembled InAs QDs, which are covered by a 5-nm In0.15Ga0.85As QW and separated from each other by a 40-nm GaAs spacer layer. The areal dot density of our lens-shaped QDs is 3x1010cm-2. For each sample lasing is peaked at nearly 1285nm [2].
Measurement of the electro-absorption and electro-optic coefficients at 1.3 µm was carried out by coupling light from a tunable laser (Santec TSL-320) onto one end of the waveguide with a lens shaped fiber. At 1.5 µm, Santec Tunable LD Light Source TSL-520 was used. A controlled DC voltage source was used to apply 0 to 20 Volts reverse bias to the samples. At each voltage level, the transmission through the device is recorded as a function of wavelength and voltage.
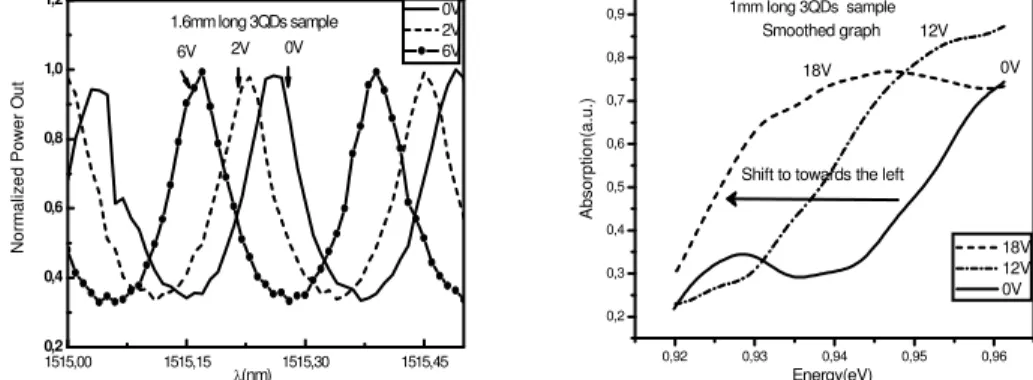
Figure 1. (a) Voltage dependency of FB resonances of 1.6mm long 3QDs sample. (b) Absorption versus energy graph of the 1 mm long 3QDs sample. The absorption spectra blue shifts under the applied voltages.
The average values for linear electro-optic coefficients (r41/ Γ) of 3QDs samples are given as 7.7x10⁻¹³m/V which is an enhancement compared to the bulk GaAs [1]. As a matter of fact examination of Fig. 1a reveals that full on/off modulation is possible for 1.6 mm long 3 QD sample using 6 V. This corresponds to less than 1 V-cm modulation efficiency. In other words using this modulator as the arms of a push pull driven Mach-Zehnder modulator, less than 1 V drive voltage would result for 1 cm long arms. We have also observed that absorption spectra of the samples blue shift with the applied voltage. We obtained the largest blue shift at the largest applied voltage of 18 Volts. The absorption spectrum is shown in Fig.1b.
In conclusion, we have observed the low voltage modulation in InAs quantum dot waveguides. We have obtained an enhancement in electro-optic coefficents compared to bulk GaAs and measurement results suggest that these waveguides are good candidates for use in electro-optic and electro-absorption modulators such as Mach-Zehnder devices.
This project is supported by Turkish Scientific and Technical Research Council (TUBITAK); Grant No: 103T115.
References:
[1]. L. Davis, K. Ko, W. Li, H.Sun, Y. Lam, T. Brock, S. Pang, and P. Bhattacharya, "Photoluminescence and electro-optic properties (25-35 nm diameter) quantum boxes", Appl. Phys. Lett., vol. 62, No.22, May 1993
[2]. A. Markus, J. X. Chen, C. Paranthoen, and A. Fiore," Simultaneous two-state lasing in quantum-dot lasers," Applied Physics Letter, vol. 82, No. 12, March 2003. 1515,00 1515,15 1515,30 1515,45 0,2 0,4 0,6 0,8 1,0 1,2 N o rm a liz e d P o w e r O u t λ(nm) 0V 2V 6V 1.6mm long 3QDs sample 6V 2V 0V 0,92 0,93 0,94 0,95 0,96 0,2 0,3 0,4 0,5 0,6 0,7 0,8 0,9 A b s o rp ti o n (a .u .) Energy(eV) 18V 12V 0V 1mm long 3QDs sample Smoothed graph
Shift to towards the left
0V 18V 12V