t Й íi J i g > | ¿ u«< Ci* br!^^ Λ :. .уА « -. ;··.·* W» «V·' '<^ W 'J 4P •Ш' Λ i .v'·’ ··· ·, ' ; .’-.SI л·* M.J ·,,.·!} Лч ' ■ í ' 1 ': ' · 7 « / u i . ' w ^ ..,;* 'mm J ,(!« 41 Ц :/· ;П Й i ' ■: '7:? tí,, y i. -a ',> ■■'?.’<, ,^v ..’ч, Ч·’ ·.■- fV ■■■» · ί . .»"■,/,· ’·■■· ^ ,1. '■/ - ’· ’ 'i\ '>1,.·' '1-' ií'j! «■ ¿?·,1. ·,ρ/ V V .·-■-../ Ч< J J fé ñ У-i w: * -'f ^ 'V i:^ |í y V Î ‘я * ■' nI Ifí .-U ■>4·' ■v#'' J ■ * ·! M 1»*'^ * « «' w » «I· # «MI' "«<>’ “H¿ 0 £ P > .?C ;^ :-.7 Э ? S i ^ v T :;' .-, ,.., . - I ■ -. ,Ηχ
FEMTOSECOND OPTICAL PARA.METRIC
OSCILLATORS BASED ON POTASSIUM TIT A .W L
PHOSPHATE CRYSTALS
A THESIS
SUBMITTED TO THE DEPARTMENT OF ELECTRICAL AND ELECTRONICS ENGINEERING
AND THE INSTITUTE OF ENGINEERING AND SCIENCES OF BILKENT UNIVERSITY
IN PARTIAL FULFILLMENT OF THE REQUIREMENTS FOR THE DEGREE OF
MASTER OF SCIENCE
By
Tolga Kartalogiii September 1996
ΤΚ
к' ІЗЭ'С
>.У* ^
I certiiy that I have read this thesis and that in my opinion it is fully adequate, in scope and in cpiality, as a thesis tor the decree of Master of Science.
Assist. Prof. Dr. Orhan Aytür (Supervisor^
I certiiy that I have read this thesis and that in my opinion it is Fully adequate, in scope and in quality, as a thesis ior the degree of Master of Science.
Prof. Dr. Avha.n Altıntaş
I certiiy that I have read this thesis and that in opinion it is fully ade' in scope and in quality, as a thesis for the degree of Master of Science.
Assist. Prof. Dr.HBlimel Ozbay
Approved for the Institute of Engineering cind Sciences:
Prof. Dr. Mehmet tOcrVTy
ABSTRACT
F E M T O S E C O N D O P T IC A L P A R A M E T R IC O S C IL L A T O R S B A S E D O N P O T A S S IU M T IT A N Y L P H O S P H A T E
C R Y S T A L S Tolga Kc\rtalogiii
M .S . in Electrical and Electronics Engineering Supervisor: Assist. Prof. Dr. Orhaii A ytiir
September 1996
In this thesis, we describe our experiments to construct and characterize optical parametric oscillators (OPO ) based on a potassium titanyl phosphate (K TP) crystals. The oscillator is synchronously pumped by a mode-locked Titanium:Sapphire laser at a wavelength of 745 nm, a pulse duration of 120 fs, and average power of 640 mW. The OPO converts the 745 nm pump beam to a signal beam at 1068 nm. The resonator is in the form of a ring cavity, with the KTP crystal positioned at the intracavity focus. The crystal is cut for type-II phase matching. We investigated the performance of the OPO with four different output coupler reflectivities. The 10% output coupler gives the best results with 170 m W of signal average power, corresponding to 27% conversion efficiency. The signal beam has an autocorrelation pulse width of 650 fs. In addition, we demonstrate phase-matched intracavity frequency doubling of the signal beam with the same KTP crystal, by placing a waveplate inside the resonator. The waveplate is used to rotate the polarization for type-II phase matching.
Keywords: optical parametric oscillation, self-doubling OPO, nonlinear
crystals, KTP, intracavity second harmonic generation, ultrafast lasers, fem tosecond, Ti:Sapphire.
ÖZET
P O T A S Y U M T İT A N İL F O SF A T K R İS T A L İ T E M E L L İ F E M T O S A N İY E O P T İK P A R A M E T R İK O S İL A T Ö R L E R
Tolga Kartaloğkı
Elektrik ve Elektronik Mühendisliği Bölümü Yüksek Lisans Tez Yöneticisi: Yar. Doç. Dr. Orhan A,ytür
Eylül 1996
Bu tez, potasyum titanil fosfat (K TP) kristali bazlı optik pcirametrik osi- latörler (OPO) kurmak ve değerlendirmek için yaptığımız deneyleri anlatmak tadır. Dalgaboyu 745 nm, darbe uzunluğu 120 fs, ve ortalama gücü 640 mVV olan bir Titanyum:Safir lazeri ile osilatörü senkronize olarak pompaladık. OPO,
745
nm dalgaboyundaki pompa ışınını 1068 nm dalgaboyundaki sinyal ışınma çevirdi. KTP kristalini bir halka resonatörün resonatör-içi odağına koyduk. Kristal tip-II faz uyumu için kesilmişti. Dört değişik yansıtma oranlı çıkış aynası ile O P O ’nun performansını inceledik, %10
’luk çıkış aynası, %27 lik dönüştürme verimine karşılık gelen, 170 m W ortalama gücüyle en iyi sonucu verdi. Sinyal ışını 650 fs otokorelasyon darbe uzunluğundaydı. Ayrıca, res- onatör içine dalga geciktirici koyarak, aynı KTP kristalinde faz uyumlu, re- sanatör içi sinyal ışınının frekans katlanmasını gösterdik. Dalga geciktirici, tip-II faz uyumu için sinyal polarizasyonunu çevirmekte kullanıldı.Anahtar kelimeler, optik parametrik osilator, kendiliğinden katlamalı OPO,
doğrusal olmayan kristaller, KTP, kovuk içi ikinci harmonik üretimi, ultra hızlı lazerler, femtosaniye, Titanyum:Safir.
ACKNOWLEDGEMENTS
I would like to thank Dr. Orhan Aytiir for his supervision, special guid ance, suggestion, and especially encouragement through the development of this thesis.
I am grateful to Kahraman Güçlü Köprülü for his help during the develop ment of the thesis and experimental work.
I would also like to express my thanks to the Turkish Scientific and Tech nical Research Council and NATO for their partial support of this work under Grant No. EEEAG-118 and Grant No. TU-MIMIC, respectively.
TABLE OF CON TEN TS
1 Introduction I
2 Theory of Optical Parametric Amplifiers and Oscillators 4
2.1
Nonlinear M aterials...4
2.2
Coupled Wave E qu ation s...6
2..3 Phase M a tch in g ...
10
2.4 Optical Parametric A m p lific a tio n ...
11
2.5 Optical Parametric O scillators... 15
3 Experimental Work 21 3.1 The L a s e r ... 22
3.2
Potassium Titanyl Phosphate C ry sta l...22
3.3 OPO C a v it y ... 24 3.4 Non-ideal E f f e c t s ... 26 3.5 Measurements and R e s u lts ... 27 3.6 Self Doubling O P O ... 35 4 Conclusion 38 A Optics of Crystals 40 B Phase Matching 43
vi
LIST OF FIGURES
2.1
Schematic of an OPA. I.3
2.2 Evolution of the normalized intensities of the signal, idler, and pump beams as a function of the normalized distance for A k = 0. 15
2.4 Schematic of an O PO... 16
2.5 Model of O P O ... 16
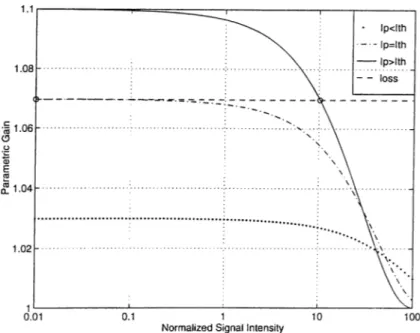
2.6
Gain curves for three different pump intensity... 172.7 Threshold intensity as a function of total loss... 18
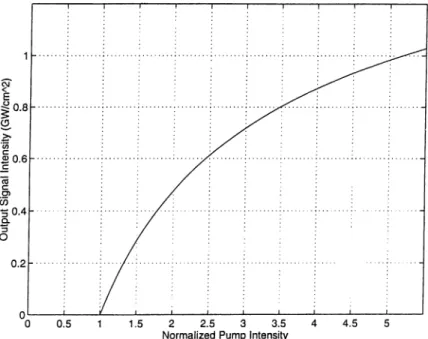
2.8 Output signal intensity as a function of pump intensity normal ized to the threshold... 18
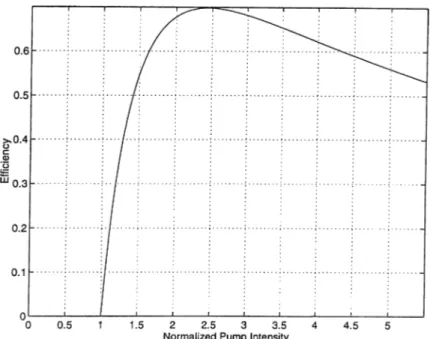
2.9 Conversion efficiency as a function of normalized pump intensity normalized to threshold... 19
2.10 Pump depletion as a function of the normalized pump intensity to the threshold... 19
3.1 Schematic view of our OPO experiment...
22
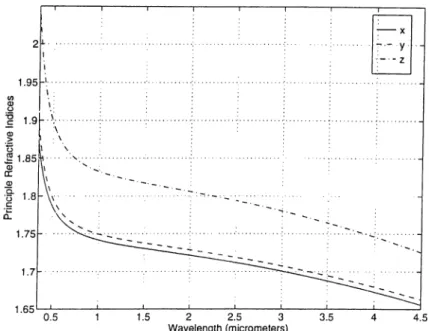
3.2 Principle refractive indices of KTP crystal... 23
3.3 Phase matched signal wavelengths at crystal angles Θ = 90° and Φ = 23°... 23
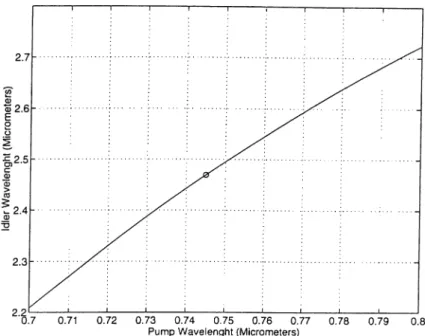
3.4 Phase matched idler wavelengths at crystal angles Θ = 90° and Φ = 23°... 24
3.5 Experimental setup. 25
3.6 The cavity focus size (beam waist radius of signal light at focus)
and stability range for distance between mirrors M l and M
2
. . . 253.7 Conversion efficiency for the 90% output couple with the theo retical plane wave curve... 29
3.8 Pump depletion for the 90% output couple with the theoretical plane wave curve... 29
3.9 The threshold powers with respect to output coupler reflectances. 30 3.10 Average signal power for the 87% output coupler... 31
3.11 Average signal power for the 90% output coupler... 31
3.12
Average signal power for the 95% output coupler... 323.13 Average signal power for the 98% output coupler... 32
3.14 Conversion efficiency for the 87% output coupler.
33
3.15 Conversion efficiency for the 90% output coupler.33
3.16 Conversion efficiency for the 95% output coupler.34
3.17 Conversion efficiency for the 98% output coupler. 34 3.18 Pump depletion for the 90% output coupler... 353.19 Self-doubling OPO setup. 35 3.20 Pump depletion as a function of pump power... 36
B .l Directions of polarizations for u i, U2, and for type-I and type-II phase matching in three wave mixing ( ω ι -J-ω
2
= ωβ). . . 44Chapter 1
Introduction
Ever since the invention of the laser by Maiman [
1
] in 1960, there has been a great deal of interest in the development of continuously tunable coherent sources. Such laser sources have broad applications in both research and in dustry. The development of such tunable lasers is difficult, since lasers operate at discrete wavelengths due to their nature of light generation with stimulated emission between quantized energy levels. Only when these quantized levels form a continuous bands of energy, a laser can be continuously tunable. Even then, the tuning range is quite limited. Therefore, converting the frequency of a laser beam to another frequency in a tunable way is an important task.The first example of frequency conversion was frequency doubling of a ruby laser using a quartz crystal by Fraken [2] in 1965. Due to the nonlinear response of the crystal, a light beam at the twice the frequency (second harmonic) of the laser beam was generated. This up-conversion process was of course not tunable.
There are many kinds of lasers operating at different frequencies. They produce pulsed or continuous wave beams with different characteristics. Two laser beams of different frequencies also nonlinearly interact with each other resulting in a beam at the sum or difference frequencies. Again, the generated frequencies have discrete values. Also, there are synchronization problems for the pulsed lasers; and also various beam characteristics may not match, resulting in further difficulties.
Second harmonic, sum and difference frequency generation are three-photon optical parametric processes. In the sum frequency generation process, two
photons at different frequencies are combined to produce a photon at the sum frequency. Second harmonic generation (SHG) is the special case in which the frequency of the two photons are same. The difference frequency generation process can be thought of as the reverse process of sum frequency generation in which one photon is split into two photons at lower frequencies.
Optical parametric oscillators (OPO) are truly tunable sources of coherent radiation. They are similar to lasers in that an optical resonator is used to provide feedback to a gain medium. However, they use material nonlinearities as the gain medium, where the virtual energy levels involved are tunable. As a result, very broad continuous tuning of frequency can be achieved. OPOs are optically pumped and generate beams of frequencies lower than the pump frequency. With the simultaneous use of SHG with OPO, we can obtain fre quencies both above and below the pump frequency.
The first proposal and theory of optical parametric oscillator were due to Kroll [.3] in 1962, and the first demonstration of optical parametric oscillation is by Giordmaine and Miller [4] in 1965. The main idea is the use of the spon taneous parametric process. In the spontaneous parametric process, a photon at frequency Up breaks down into signal and idler photons at lower frequencies
Us and Ui, respectively. In this process, energy and momentum are conserved,
that is Up = Us + Ui and kp = kg -f- kp The spontaneous parametric process, followed by repeated difference frequency generations, leads to a parametric amplification of the signal light. An optical parametric oscillator can be con structed by simply adding optical feedback, just as in a laser.
An OPO is analogous to the optically pumped three-level laser. The fre quency of the pump beam determines the top energy level. The mid energy level can be tuned through momentum conservation, which is called the phase matching condition. By changing material properties affecting the propaga tion of the light beams, the phase matching condition is satisfied for different frequencies. Therefore, frequency conversion to any desired frequency can be achieved.
There have been many demonstrations of optical parametric oscillators [5] with different kind of lasers as the pump source. A continuous wave pumped OPO generates continuous wave output. The cavity sizes can be as small as the length of nonlinear crystal. Generally, continuous wave lasers are not suitable for OPO application, because nonlinear processes are more efficient at high intensities. Q-switched lasers provide pulses with pulse widths in the order of 10 ns and high peak powers with low repetition rates. Pulsed OPOs pumped
by such lasers can be very efficient. A new oscillation starts with each pulse.
Although the ultrafast laser systems have pulsed outputs, their operation characteristic are similar to continuous wave lasers. The short duration of ul trafast pump pulses (on the order of
100
fs) clearly implies that synchronous pumping must be used. This means that the pump pulse propagates in syn chronism with the signal pulse in the nonlinear crystal and always meets the signal pulse as it travels back and forth in the cavity.The first femtosecond OPO was pumped by a Rhodamine
6
G dye laser [6
]. Since that time, there have been many demonstrations of Titanium:Sapphire (Ti:Sapphire) laser pumped femtosecond OPOs around 100 MHz repetition rate with less than 150 fs pulse widths.A Ti:sapphire laser produces nearly chirp-free pulses with pulse widths around
100
fs with repetition rates in the order of100
MHz. It is a tunable laser with a wavelength range between 700 and1000
nm. With the second harmonic generation process, the wavelength range can be extended from 350 to 500 nm. By using an OPO, the wavelength range can be extended above the1000
nm. The upper limit determined by the transparency of the todays nonlinear crystals is around d^am. With the SHG of the OPO output, the frec^uency gap between the output and the second harmonic of the Ti:Sapphire can also be covered, extending the continuous tunability range from 0.35 μχχι to 4 yum.In this thesis, we designed and implemented synchronously pumped fem tosecond optical parametric oscillators based on potassium titanyl phosphate (K T P ) crystals. We used a mode-locked Titanium:Sapphire laser as our pump source. In addition, we demonstrate phase-matched intracavity frequency dou bling of the signal beam with the same KTP crystal when a halfwave plate is placed inside the resonator.
In Chapter 2, the theoretical background for nonlinear media and optical parametric amplification and oscillation are given. Chapter 3 describes the experimental setup and our measurements. In this chapter, we also discuss the results. Remarks and conclusions are provided in Chapter 4.
Chapter 2
Theory of Optical Parametric
Amplifiers and Oscillators
In this chapter, we start with a description of nonlinear materials and dis cuss the interaction of three light waves through a quadratic nonlinearity. To describe three wave mixing, we derive three coupled wave equations starting from Maxwell’s equations. The general solution and parametric amplification as a special solution are given next. Finally, optical parametric oscillators are discussed.
2.1
Nonlinear Materials
Nonlinear behavior of materials was observed shortly after the invention of laser [2]. High optical intensities of lasers enable us to observe nonlinear behavior of materials. A variety of materials show large nonlinearities. Three wave mixing is the interaction of three light waves at different frequencies in a material showing a quadratic type nonlinearity. Second harmonic, sum frequency and difference frequency generation are examples of three wave mixing process.
In nonlinear materials, we assume that we can represent the total electric field E (r, t) of the optical waves that interact with each other as a discrete sum
of a number of frequency components as
E (r, i) = ; ^ Re(Ei(r)e^‘^··') = ^ ^ (E i(r )e ^ ‘^-‘ + E r(r)e-^‘"'‘ ) (2.1)
i ^ i
where E j(r) is the slowly varying electric field phasor at angular frequency u>i. As the light wave propagates through the material, it induces a polarization field P (r , i). The polarization field can also be written in terms of a sum of a number of frequency components as
P ( r . i) = E R e (P i(r)6 > "< ‘ ) = i E ( P i ( r ) e ' " “ + P · ( r ) e - ' “ ·'). (2 .2 )
i ^ i
Again, P (r ) is the slowly varying polarization field phasor at angular frequency
coi. The general relation between the polarization and the electric fields is non
linear and dispersive [7]. A nonlinear dependence of polarization can be ex pressed as a power series of the electric field in time domain. Dispersion, being a property that states frequency dependence, can be expressed as a multiplica tive function in the frequency domain. When we write the polarization field in time domain, this multiplicative function becomes a convolution. Also, all of the coefficients of the power series are tensors, because the materials involved are anisotropic. The relation between P (r, i) and E(r, i) can be given as
t
P ( r , t ) = eo J (')< « '+ —oo
t t
eo / /
f )
: E(r, tOE(r,
t")dt'dt"
-t- h.o.t.
(2.3)
— OO —oo
where en is the permittivity of free space, and is the linear
susceptibil-= ( 2)
ity tensor of second rank, and x is the second-order nonlinear susceptibility tensor of third rank. Each element of the tensor is first convolved with the com ponents of the electric field and then summed over the corresponding indices. In this representation, the first term.
P i r ,•,i) = io (2-4)
— OO is the linear polarization. The next term,
P ( r , t) = e„
j j
f ‘ " ’ (i t" ) : B ( r . i ' ) E ( r . i " ) * ' * ” . (2.5 ) — OO —oois the second-order nonlinear polarization term. In this term, the second order susceptibility tensor relates two electric fields to the polarization field. Also,
higher order terms (h.o.t.) that are smaller compared to the second-order term exist. Those terms are effective in centrosymmetric materials that have a center of inversion symmetry. In such materials, the second-order nonlinear susceptibility tensor vanishes. In the case of our experiment, we have nonzero = (2)
X and can neglect all higher order terms.
Two electric fields at frequencies 0J2 and u>i give rise to a nonlinear polar ization phasor at angular frequency u>3 = U2 + cui as
P ? V ) = -f LÜ2) : E i(r )E
2
(r)1 = (2)
-h-eoX (iua = CU2-Hcui) : E2(r)Ei(r).
(
2
.6
)Since, E i(r ) and E
2
(r) are associated with time dependences and ,respectively, the second-order nonlinear polarization resulting from their prod uct is at the sum frequency. Therefore, x ^ can be expressed as a function of three frequencies for which one of them is always related to the other two by sum or difference. Full permutation symmetry property and Kleinman’s symmetry condition [7] state that we can write
_ , X _ = (
2
). , X X ( ^ 3 — + <^2) — X {^3 — i<^2 + ) · Then, the second-order nonlinear polarization term takes formP^^^(r) =
: Ei(r)E2(r).
(2.7)
(2 .8) The important fact is that although we do not have an electric field at fre quency cua, we have a polarization at frequency 0J3. This induced time-varying
polarization acts as a source of electromagnetic radiation at freciuency 0J3.
Similarly,
p(2)(r) = eoX "Vcui = CU3 - u^) : Ea(r)EKr) (2.9) p f (r) = to x ''\o j2 = CU3 - cui) : E3(r)E*i(r) (2.10)
can be written. Equations (2.8), (2.9), and (2.10) show that there is a coupling between three fields at u^i, u;
2
, and uz = uii ujz through the second-ordernonlinearity.
2.2
Coupled Wave Equations
A set of equations can be used to describe the second-order nonlinear inter actions of three light waves. They are derived from Maxwell’s equations for a
source free, and lossless medium, V X E = V x H = V D dB
■
dt
dDdt
=
0 (2.1 1)(
2.
1 2)
(2.13) V . B =0
(2.14)and constitutive relations for a magnetically isotropic and inactive medium.
D = eoE + P B = ^oH.
(2.15)
where cq and fio are the permittivity and the permeability of free space, E and
H are the electric and magnetic fields, D and B are the electric and magnetic flux densities, and P is the induced polarization, respectively. The constitutive relation between the electric field and the electric flux density takes the form of
Dl = eoE + p W
(2.16) = Coer · E
D = Dl + P(2), (2.17) when we separate the linear and nonlinear parts of the polarization field, where Dl denotes the linear part of electric flux density and ?r is the relative per meability tensor defined as
= (2.18)
where
1
is a three by three identity matrix..Just as the homogeneous wave equation [
8
], the nonlinear driven wave equa tionV X V X E (r,t) + / í o ^ D L ( r , í ) = - /ío ^ P ^ ^ ^ ( r ,í) (2.19) is derived by taking curl of Equation (2.11) and using Equation (2.12). When the right hand side of Equation (2.19) is zero, it become the homogeneous linear wave equation.
Nonlinear interactions occur over distances and times that are much larger than the individual sinusoidal variation of the optical field. Therefore, a plane wave representation with slowly varying envelope functions can be used. For
light waves at frequencies uj\, ui^·, and uz = uiz + uix propagating along the direction, we can write the electric and polarization phasors as
E i(r) = a iA ,(z )e -'‘ ‘'
P f V ) =
i\Bi(z)e-»‘>
(
2
.20
)(
2
.21
)where i = 1,2,3. The unit vector ai represents the direction of polarization,
A i { z ) and B i { z ) represent the slowly varying envelope functions of the electric field and the second-order nonlinear polarization field, and ki and A:· are the propagation constants of the electric field and polarization.
Most nonlinear materials are optically anisotropic, and hence exhibit bire fringence. Birefringence is the dependence of the refractive index on the direc tion of the polarization of the optical radiation so that, for a given direction of propagation, there are two eigen-polarization directions corresponding to two eigen-refractive indices. We take these eigen-polarization directions to be
X and y directions of our coordinate system. Then, the relative permeability
tensor fr is diagonalized in our new frame with the diagonal elements being the square of the eigen-refractive indices. The unit vector a; is either x or y. Note that, this new coordinate system is a linear but not orthogonal coordi nate system; the plane wave propagation equations are now just like in the isotropic medium, a scalar refractive index is used. Details of propagation in an anisotropic medium can be found in Appendix A.
Relations between the slowly varying envelope functions A i { z ) and B i { z )
and between the propagation constants ki and k'i are found using Equa tions (2.8), (2.9), and (2.10) as
where
B i(z) = eodiA
3
(r)A ;(r) (2
.22
)Bziz) = eod2A z{r)A l{r) (2.23)
Bz{z) ~ eo<^3-^i(r)A2(r) (2.24)
kx — kz kz (2.25)
k'2 = kz — kx (2.26)
k'2 = kx + kz (2.27)
^ = (
2
). . ^ ^•ai -X [ojx = uJz - L02) '■ aaa
2
(2.28)J
1 - =(2)/ X ^ ^«3 = 2^3 -X (wa = wi + ÜJ2) : a ia
2
(2.30) are the effective second-order nonlinear coefficients. In a lossless medium, due to full permutation symmetry [7], all three effective nonlinear coefficients are equal and can be represented by a single real coefficientdgjf — d\ —
(¿2
— ^3
. (2.31)With the above definition of the electric field, polarization, and effective nonlinear coefficient, the nonlinear driven wave equation can be expressed in frequency domain as
V X V X âi
-yLioCow-fr · = noufaiB .iz)e~
Note that Since we have · âi = n -âi. (2.32) (2.33) V · E = V · (A(^)e-^'^'^ai) = 0 (2..34) We can use the vector identity, V x V x E = V ( V - E ) — V^E = — V'^E, and the wave equation takes the form
{Ai{z)e-^^'^) +fioeon^<^fAi{z)e-^'^'^] = ~i.cou;fBi{z)e-^^‘ \ (2.35) With the slowly varying envelope representation, we get three coupled equa tions for the envelope functions
= -ftoeou;ld,!,Asiz)A;{z)e-^^^^ (2.36)
- 2 j k 2 ^ ^ ^ = -fioeoojld,f,A3{z)Al{z)e-^^'^^ (2.37)
dz^
dz
= -liotoojld ,ü A ,{z)A2{z)e^^’^\ (2.38)
(JL^ \Jb^
where
Afc = ks — k2 — ki (2.39) is called the phase mismatch.
We can neglect the second-order z derivatives under the slowly varying envelope approximation,
(2.40)
d'^Ai(z)
<
d ^ z )
and the coupled equations take the form
iA,{z) ^
dz CTI3 where c = V^oT^ (2.41) (2.42) (2.43) (2.44) is the speed of light waves in free space. Equation (2.41) through (2.43) describe the evolution of the slowly varying envelopes in three wave mixing.2.3
Phase Matching
When we consider the coupled wave equations (Equations (2.41), (2.41), and (2.43)), there are two important quantities in all the equations. These quanti ties are important because they determine the strength of the nonlinear inter- ciction. One oi these quantities is the effective nonlinear coefficient defr; larger values make the interaction stronger. The other c^uantity is the phase mis match A k. The term has unity magnitude, but it effects the phase of the interaction. With advance in distance, it can change the sign of the fields and reverse the interaction. For the effectiveness of the interaction, the phase matching condition
A/t = 0 (2.45)
must be satisfied [7]. The phase mismatch depends on the direction of prop agation. For a given nonlinear material and interaction frequencies, A k can vanish for certain directions of propagation inside the nonlinear material.
We can re-write the phase matching condition
ks -
¿2
- = 0 (2.46)in terms of the angular frequencies and the refractive indices seen by each light wave as
U>3Tl3 — U>2n2 — UliTli = 0. (2-47) Using the frequency relation 0J3 = 0J2 -k u>i a reduced equation between the
angular frequencies and refractive indices can be obtained as
<^
2(^3
— ^2
) T ^1(^3
^1
) — 0 (2.48)10
Llie refi'cictive index of a material is a functioii of frequency due lo dispersion. There are two characteristic l^ehaviors of refractive index for optical materials. It is either monotonicalh· increasing or decreasing with the frequenc}'. For both cases, the above eciuation cannot be satisfied, since both terms have the same sign and the sum cannot vanish. However, many materials display birefrin gence, so that there are two refractive indices depending on the polarization of the optical field. As a result, we can satisfy the phase matching condition for a given set of frequencies at a certain propagation direction b}’ using different po larization directions for the interacting light waves. The details of anisotropic materials and phase matching can be found in Appendices A and B.
2.4
Optical Parametric Amplification
The general solution of the coupled mode equations are gi\'en in terms of .Jacol)i elliptic functions [9]. This section outlines thoise solutions. We assume that the int(-M'actiou Iregins at ·· = 0 and ends at c = L. The envelope functions can be written in i)olar form.
.-l„(.:·) = (2.49)
Tlu;' phase angle lor the interaction is defined as 0 — AA“ T '*•^3 — Oi — · By defining the total intensity as
/ = /i(0) + /2(0) + /:3(0)
the envelope functions can be normalized using
u).nl
The normalized distance
deff(
(eoConin2n3)T2 and the normalized phase mismatch
AA;r (eoConi??2n3)^/‘^ A 5 = AA· (2.50) ( 2. Ô1 ) (2. Ô2) (2.Ô3) (2. ml) (f (4ff(2a.’ia.’2u.’:j/)T2
are also defined. A parameter that depends on the initial \-alues of the nor malized lengths and the phase is given as
r = n i(
0
)a2
(0
)i/.3
(0
)cos(d(0
)) + :^A5«^(0).11
There are three invariants over the normalized length defined as
(2.56) m
2
= U3
+ ul (2.57)m
3
— ul — ul (2.58)These invariants correspond to Manley-Rowe relations and represent the con servation of the number of photons for a lossless medium. With the roots Wg/j, and of the cubic polynomial
ti
3
(mi - U3
)(m2
- Ug) - (T - -0
(2..59)^^3c — ^^36 — —
0
(2.60) and substitutionsy ~ ~ ~ ^ha) (2.61)
7^ = («.36 - Aa)/iuic - ■^4a) (2.62) the solution to the normalized envelope functions are given as
y(0 = sn((i
4
- + 6 ))-7 ‘ ) (2.63) ;!/(0
) = sn((ii'^. - (2.64) ^0 = F(arcsin(i/(0
) ) ,7
''^)/(i4
~ (2.65) «3(0
= ‘4 + («36 “ «.L )y'('f) (2
.66
)«?(0
=■'«1
- «.3(0
= «'f(0
) + «3
(0
) - «.3(0
(2.67) «2(0
= m 2- uKO = «2
(0
) + «.3
(0
) - «3(0
(2
.68
) where sn(.'c, m) is the .Jacobi elliptic function and F(?5', m) is the elliptic integral of the first kind [10
].Optical parametric amplification is the process where two optical fields at frequencies
0^3
and uji interact to produce light wave at the difference frequency Cc’2
= CJ3
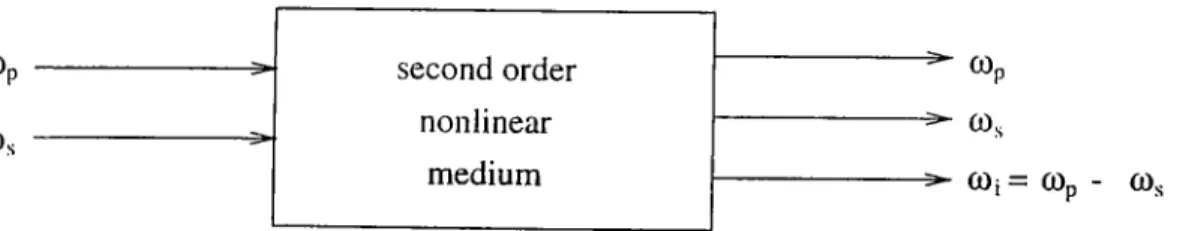
— Ldi. In this process, a photon at frequency C03 is split into two photons at frequencies ui and 0J2 I’esulting in an increase in the number of photons at frequency u i. The field at frequency is called the pump, since it is the energy source for the newly created photons. The field at frequency ui\ is called the signal, since it is the amplified field through the process, and the field at frequency oj'i is called the idler.We use the subscripts s, i and p instead of
1
, 2 and 3 to represent the signal, idler, and pump fields. Figure 2.1 shows the schematic diagram of anCOp COs second order nonlinear medium COn COs
COj = COp - COs
Figure
2
.1
: Schematic of an OPA.optical parametric amplifier (OPA). With the initial conditions / „ (
0
). A (0
). and /¿(0) = 0, and assuming perfect phase matching A k = 0, we can find the evolution of the intensities of the pump, signal, and idler as they propagate in the nonlinear medium asA(i') — A (
0
) + /5
(0)7
7^ Sn2(.'C,7'2) 2Sn^(:r,7^) till (.r,72
) tOihiz) = — /5(0)7
where dn'^(;r,7'^) (2.69) (2.70) (2.71) 17
=
1 + <^p/.,(0) (2.72) (2.73) and K defined to be K = co*/p(0
) c/eff(2
u;su;¿/p(0
))^/^ (eoConsnj-np)i/2
(2.74)and Usi Ui, and Up are the refractive indices of signal, idler, and pump fields, sn(;c,m) and dn(.r,
77
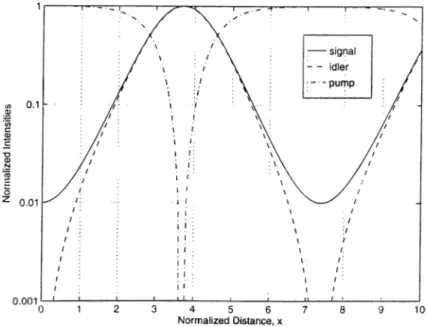
r) are of the .Jacobi elliptic functions. The intensities at the output of nonlinear medium can be calculated by using z = L where L is the length of the nonlinear medium.Figure 2.2 shows the evolution of the signal, idler, and pump photon fluxes as a function of normalized distance. The pump flu.x decreases as the signal and idler fluxes grow; at some distance, they reach a maximum where the pump is fully depleted. Then, back conversion starts, the idler cind signal photons combine to generate pump photons, so the pump field begins to grow, tn this plot, the photon flux of the signal input beam is taken to be 1% of the pump
photon flux, as a.n example.
Figure 2.2: Evolution of the normalized intensitie.s of the signal, idler, and pump beams as a function of the normalized distance for A k = 0. The hor izontal axis is the normalized distance x and the vertical axis is normalized intensities divided by the normalized initial intensity of the pump.
When we look for a limiting case in which the signal input is small
(2.7o)
(2.76)
(2.77) (2.78)
h
<Ip
then the
7
^ value approaches unity2
1
7
1
resulting in the .Jacobi elliptic functions to be approximated as sn(;r,
7
^) ~ tanh(Ki')dn(.'c,
7
^) ia sech(«s).The intensities at the output of the nonlinear medium are calculated as
I ,(z = L ) ^ /p(0) (2.79)
l ,( z = L) K, 7s(0) + 7s(0) sinh '^{kz) = 7j(0) cosh ^(κ..г) (2.80)
Ii{z = L) ^ — 7j(0) sinh ^(a:z) (2.81) Those solutions are known as the undepleted pump solutions ol the coupled mode equcitions in which the pumi? intensity is held constant.
Parametric gain is defined as
W = L)
G =
Is{= =
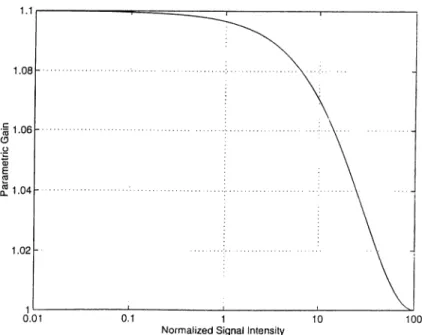
0)Figure 2.3: Gain saturation with the increase in signal input. The horizontal axis is the normalized signal intensity tij(O), the vertical axis is the gain.
and given by
, s ^ 7 ^
dn^(.r,
7
^) (2.83)Figure 2.3 shows the signal gain as a function of the ratio of the input signal intensity to the input pump intensit}^ which is held constant. The argument ;i· of the .Jacobi elliptic functions is arbitrarily taken to be 0.311 so that the unsaturated gain is
1
.1
. The gain monotonically decreases to the limiting value of unity as the signal intensity increases. The gain at zero input is the small signal gain (unsaturated gain) and given asCr'o — cos1i^(a:5:). (2.84)
2.5
Optical Parametric Oscillators
The optical gain provided by a parametric amplifier can be used to make an optical oscillator with the help of a resonator. Such a device is known as an optical parametric oscillator (OPO). Figure 2.4 shows the schematic of an OPO. The signal field resonates inside a ring cavity formed by four miriOrs. The output is obtained from a partially transmitting mirror called an output coupler (O C ). All of the mirrors except the output coupler are high reflectors at the frequency of signal field. The pump field enters the cavity from one of the mirrors, which has special coatings that make it transparent to the pump
Figure 2.4: Schematic of an OPO.
wavelength, passes through gain medium and leaves cavity from other mirror. There is also an idler field which is generated in the nonlinear process. The mirrors are also transparent to idler beam, so that it does not resonate.
A simple model of an OPO is shown in Figure 2..'5. The parametric amplifier is modeled as a gain medium where the gain saturates with increasing signal input as described by Equation (2.83). The output coupler has less thair unity reflectance R oc- The nonzero transmittance provides the output beam of the OPO. Unavoidable useless losses (less thcin unity reflectance of highly reflecting mirrors, losses in the nonlinear material, diffraction losses, etc...) are taken into account as a single source of loss which is represented by a lumped reflectance /?L. The total loss is defined to be
αχ =
1
— R]_,Roc· (2.85)A cavity equation corresponding to steady state operation
G = (
2
.86
)can be written by equating round trip los.ses to the parametric gain. The OPO has a threshold. The pump intensity must exceed this threshold intensity /t h· Figure 2.6 illustrates three possible situations. The dashed horizontal line represents the loss line which is equal to the inverse of the reflectances (right
loss
signal output
IsRl^OC
Figure 2.5; Model of OPO.
16
Figure 2.6: Gain curves for three different pump intensity. The horizontal axis is the normalized signal intensity u^(
0
), the vertical axis is the gain.hcincl side of Equation (2.86)). Three gain curves corresponds to three pump intensities. The variables so selected that the argument x tcikes the values of 0.172, 0.262 , and 0.311. When input pump intensity is less than the threshold intensity (/p (
0
) < /th)> the small signal gain is le.ss than loss; as a result, there is no solution for the signal intensity inside the cavity resulting in the trivial solutionls = 0. (2.87)
When the input pump intensity is equal to the threshold intensity (/p(0) = -^th), the solution corresponds to
=
0
. (2.88)As a final case, when the input pump intensity is greater than the threshold intensity (/p (
0
) > /th), there is a solution with a nonzero signal field in side the cavity, represented by the intersection of the loss line with the gain curve.At the threshold, the gain is just enough to compensate for the losses. Using the small signal gain equation (Equation (2.84)), the threshold pump intensity is found to be T 2 7th = CqCqTI cosh- 1 1 (2.89) y y 1 —
OCT ^
The threshold increases with increased loss (see Figure 2.7). We use typical numbers from our experiments (see Chapter 3) with Roc = 0.93 and R\^ =
1
to calculate the curves in Figure 2.7 through 2.10.
17
Figure 2.7: Threshold intensity as a function of total loss.
The signal output can be calculated using
-fo =
(1
— Roc)RlL· (2.90) Figure 2.8 shows the output signal intensity as a function of pump intensity normalized to the threshold Ip/Im· The conversion efficiency is defined asFigure
2
.8
: Output signal intensity as a function of pump intensity normalized to the threshold.Figure 2.9: Conversion eiFiciency as a function of normalized pump intensity normalized to threshold.
7? =
k
L· (2.91)
Due to the photon energy ratio between the signal and pump the 100% in tensity conversion efficiency cannot be observed. In Figure 2.9, the conver sion efficiency is plotted as a function of pump intensity normalized to the threshold Ipf Ith- The conversion efficiency has a maximum at a point where
Figure 2.10: Pump depletion as a function of the normalized pump intensity to the threshold.
the pump intensity is fully depleted. Figure 2.10 shows the pump depletion
Ip{z = L)/Ip{z = 0) as a function of the normalized pump intensity to the
threshold. The pump field can be fully depleted in the plane wave theoiw.
Chapter 3
Experimental Work
Optical parametric oscillators (OPO) are tunable sources of coherent radiation. They extend the wavelength range of conventional laser sources through down- conversion to longer wavelengths [5]. Development of the Kerr-lens mode- locked Titanium;Sapphire (TiiAhOs) laser has provided an excellent source to pump ultrafast OPOs. These lasers typically produce
100
fs pulses at a rep etition rate on the order of lOOMHz, with average powers greater than1
VV (corresponding to peak powers greater than 100 kW) and tunability between 700 and 1000nm [13]. Many optical parametric oscillators have been demon strated with ultrafast Ti;Sapphire la.sers [11-16].In this work, we investigate OPOs that are pumped by an ultrafast Ti:Sapphire laser. In Sections 3.1 and 3.2, properties of the laser source and the nonlinear crystal used in our experiment are outlined. The design of the oscillator cavity is discussed in Section 3.3. Non-ideal effects that we must take into account are described in Section 3.4. Results of our OPO experiment are given next. In the last section, we describe and give results of self-doubling OPO experiment.
A simple schematic of the OPO view is given in Figure 3.1. VVe use a Ti:Sapphire laser as our pump source. The output of the laser is tuned to a wavelength of 745 nm in the infrared. An
8
mm thick potassium titanyl phosphate (K T i0
P04
, K TP) crystal is employed as the nonlinear gain medium in the OPO. The KTP crystal is cut aX Θ = 90° and φ = 23°, which results in a signal wavelength at 1068 nm.Figure 3.1: Schematic view of our OPO experiment.
3.1
The Laser
A mode-locked TiiSapphire laser (Coherent, Mira-900F) is used in our exper iments. The laser is a tunable laser with a tuning range between 700 and 1000 nm. It has a pulse repetition rate of 76 MHz corresponding to the separa tion of the longitudinal modes of the laser. Kerr-leiis mode-locking is ernplo,yed lo achieve nearly transform limited pulses of approximafeh' 120 fs.
We operate at a wavelength of 745 nm. At this wavelength, the output of the laser is 640 m W resulting in an instantaneous peak power of 60 kW. We mecisure the duration of our laser pulses with an autocorrelator (Femtochrome FR103XL). .At this wavelength, we measured the autocorrelation of our pvdses to be 180 fs. When deconvolved assuming a hyperbolic secant pulse shape, the pulse duralion is deduced to be 120 fs.
3.2
Potassium Titanyl Phosphate Crystal
Potassium titanyl phosphate (KTiOPO.i) is an mm2 point group, positive bi axial crystal whose transparency range is between 0.35-4.o/m i [17]. Sellmeier equations describing the dispersion relations for the principle-a.xis refractive indices rix, Uy and can be written as [17]
< = 2.1146 + 0.S9188A2 n . 2.1518 -b nt = 2.3136 + Λ2 - 0.04.3518132 0.87862A2 A2- 0.04752836 ' 1.00012A2 - 0.0132A'^ - 0.01327A^ - 0.01679A'^ (3.L) (3.2) (3.3) A2 - 0.056791656
Figure 3.2 shows the principle refractive indices for the K TP crystal.
The KTP crystal that we use is cut at = 90° and (p = 23°. Its dimensions are 6 X 6 X 8 mm. It is anti-reflection coated for 1064 nm on both faces. We use
Figure 3.2: Principle refractive indices of KTP crystal.
a type-II phase matching geometry. The signal and pump fields are both p- polarized (horizontal, fast crystal axis), and the idler is s-i^olarized (vertical). Figures 3.3 and 3.4 are the phase matched wavelengths of signal and idler fields as a function of the wavelength of the pump field. The phase matched wavelengths of the idler and the signal are cilso marked at a pump wavelength of 745 nm. (See Appendix B for the details of phase matching.)
The effective nonlinear coefficient at any 0 and cj) angle can be calculated
Figure 3.3: Phase matched signal wavelengths at crystal angles 9
(j) = 2.3°.
= 90° and
Figure 3.4: Phase matched idler wavelengths at crystal angles $ — 90° and
(j) = 23°.
using Equation (2.28). The nonlinear coefficient is calculated to be [17]
i/eff = d i 5 s in ^ ip + ¿2^ c o s ^ ip
in the xy plane. For the KTP crystal, di
5
and ¿24 are [IS]di5 = ^Xxxz = 2.0 X m /V
1
With φ = 2.3°, is found. d-24 = ^Xyyz = 3.6 X 10 ^^m/V deff = 3.4 X 10 ^^m/V (3.4) (3.5) (3.6) (3.7)3.3
OPO Cavity
P’igure 3.5 shows the experimental setup in detail. A ring cavity is formed by four mirrors. The signal light oscillates among the mirrors M l, M2, M3, and M4. M l is a concave mirror with a radius of curvature of 10 cm. It is a high reflector for the signal as well as having high transmission coatings for the pump. M2 is an another concave mirror used to form a cavity focus between M l and M2. It has a radius of curvature of 15 cm. It is also a high reflector for
Figure 3.5; E.xperimental setup.
the signal with high transmission coatings for the pump and the idler. M3 and M4 are flat mirrors. M4 is a high reflector. M3 is used as an output coupler for the signal output. The mode-locked Ti:Sapphire laser provides the pump beam to the OPO at a wavelength of 745 nm. The pump beam is focused with a lens (L) of focal length 100 mm to match the intracavity focus and enters the cavity through M l. The KTP crystal is positioned at the intracavity focus. The mode radius supported by the cavity is calculated to be 20 μιη, and the focused pump beam diameter is calculated to be 36 μηι at the KTP ciystal.
In the OPO, a pump pulse passes through the crystal once, providing gain for a signal pulse. The signal pulse propagates inside the cavity and I'eaches the crystal. If the signal pulse reaches at the same time with the pump pulse, it is amplified and the oscillation starts. Therefore, the cavity length is very important in these experiments. Changing the cavity length by moving M4,
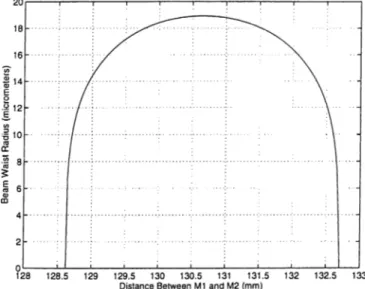
Figure 3.6: The cavity focus size (beam waist radius of signal light at focus) and stability range for distance between mirrors M l and M2.
we can adjust the arrival time of the signal pulse to the crystal and make the signal pulse in synchronism with the repetition rate of the pump pulses. This pumping scheme is called synchronous pumping.
With the repetition rate r of the laser and the refractive index n of the crystal for the signal, and crystal length T, the cavity round trip length must be
ic = co/r - L{n - 1) (3.8) for synchronization. In addition to this, the distance between the mirrors de termines the stcibility of the cavity. Figure 3.6 shows the beam waist radius at the focus as a function of the distance between M l and M2 with the ciwity length Ic held constant. For a small range of distance, there is a stable region where the cavity is stable and a beam waist exists. To cidjust the cavity prop erly, M2 is positioned on a translation stage for adjusting the distance between M l and M2, so we use two translation stages for the adjustment of cavity.
3.4
Non-ideal Effects
The use of plane waves to model our experiment is a first order approximation. Most lasers generate beams that show a Gaussian distribution in the transverse direction. The pulse shape of pulsed lasers is also important.
The parametric gain is an intensity depended quantity. Due to the Gaussian intensity profile of the pump beam, the gain varies with the radial distance from the center. This non uniform distribution affects the conversion such that when one part of the pump beam is depleted the other parts are not. This lowers the conversion efficiency [19].
A similar concept is also valid for the pulse shapes, the intensity of the pulse is much higher in the middle than the tails, resulting in higher parametric gain there.
Other non-ideal effects come from the use of ultrashort pulses. A 100 fs pulse has a spatial extent of 30 /j.m. Due to material dispersion, the pump, signal, and idler pulses travel with different group velocities inside the crystal. As a result, the interaction length of the pulses is restricted by the overlap distance [20].
In dispersive media, the group velocity of pulses propagating at Aq can be
26
written as [21] where V = N »r . dn JV = „ A „ -A=Ao (3.9) (3.10) where ?r(A) gives the wavelength dependence of the refractive inde.x. The group velocity mismatch (GVM ) is defined to be
S v ;' =
-Vi Vj (3.11)
where i and j represents pump, signal, and idler. At our operation wave lengths, the GVM between the pump and the signal pulses are calculated to be 126fs/m m .
The effect of GVM is taken into account by introducing an effective length of interaction. Although the crystal length is 8 mm in our case, the length in which the pulses overlap is much less than this. For the calculation of threshold powers, we assume the initial signal pulse width is equal to the pump pulse width, because the first pulse is purely generated from the pump pulse. While these pulses travel, they go apart and the interaction ends when the pulses are separated from each other by 120 fs. The effective length is calculated to be
120 fs
—— ---= 0.95mm (3.12)
r26fs/m m
which is eight times smaller than the actual crystal length.
3.5
Measurements and Results
We made three types of measurements to characterize our OPOs, namely av erage power, pulse width, and spectral width. Power measurements give infor mation about the conversion efficiency, whereas the pulse and spectral widths give information about the pulse quality.
The input pump power is measured before the focusing lens (L) (see Fig ure 3.5). A power divider (polarizer waveplate combination) is employed before the lens to adjust the input power. We take the signal output from M3. The signal power is measured after separating the signal beam from the residual pump beam using a prism. The prism is a Brewster angle prism and fully trans mits the signal beam. Pump depletion is measured after M2. We measure the
Specified Measured reflectance reflectance 98% 98.7% 95% 93.3% 90% 90.6% 87% 85.5%
Table 3.1: Output Coupler Reflectances.
remaining pump beam when the cavity is blocked (no oscillation) and when there is oscillation. The ratio shows us how much the pump beam is depleted in the interaction. The idler beam also leaves the cavity from M2. Therefore in this measurement, we actually measure the power of the depleted pump and the generated idler beam when cavity oscillates. As a result, our pump depletion measurements are not accurate, and underestimate the amount of depletion.
VVe use four different output coupler mirrors. In Table 3.1, the reflectivities of the output couplers are given. First column contains the specified values and the second column contains values that we measured. We obtain highest output power with the 10% output coupler. Figures 3.10 through 3.18 show the output power, the conversion efficiency, and the pump depletion, for the output couplers listed, as a function pump power.
The output power characteristics show an increase with increasing pump power, but this increase is not linear. When we look at the conversion effi ciency curves, the conversion efficiency increases rapidly for pump powers just above the threshold, then reaches a saturation. We get maximum conversion of 170 m W corresponding to 27% conversion efficiency with the 10% output coupler. We compare the conversion efficiency curve for the 10% output cou pler with a theoretical curve based on the plane wave theory (see Figure 3.7). Our experimental measurements are not close to what the plane wave theory predicts. The plane wave theory predicts 69% maximum conversion efficiency whereas we get 27% conversion efficiency. Also, the pump power at which the maximum conversion is achieved are not the same. Similar statements also true for the pump depletion. Plane wave theory predicts that the pump can be fully depleted, but in the experiment, we can deplete it only by 44% (see Figure 3.8). This result is due to the Gaussian distribution of the beams. A calculation done by Bjorkholm [19] shows that 71% maximum pump depletion can be achieved for which the plane wave theory predicts 100% depletion. Bjorkholm, also, re ported that the pump powers at which the maximum depletion occurs is larger than the plane wave case.
Figure 3.7: Conversion efficiency for the 90% output couple with the theoretical plane wave curve.
We expect the pump depletion to be maximum for the 10% output coupler, but we observe that it is maximum with the 2% percent output coupler. This indicates that the useless cavity losses are comparable with losses of the output couplers.
Figure 3.8: Pump depletion for the 90% output couple with the theoretical plane wave curve.
Figure 3.9: The threshold powers with respect to output coupler reflectances.
An approximate calculation of threshold powers can be done using plane wave theory. In these calculations, we assume that the pulses are square pulses having the same energy as the original pulses. The pulse width of these pulses are equal to the full width at half maximum of the original pulses. Also, we assume a uniform intensity distribution in the transverse plane. The full power is uniformly distributed inside a circular area with a radius that is equal to the beam waist radius. Then, we can estimate an average power from plane wave intensity by
^TH -Ith =
76MHz X 120fs X 7T X (3.13) where Wo is the beam waist radius, 120 fs is the full width at half maximum pulse width, and 76 MHz is the repetition rate of the pump pulse.
Figui’e 3.9 shows the threshold data as a function of output coupler re flectances . A plane wave theory curve is also given. The curve is Ccilculated using Equation (2.89) with the lumped-loss reflectance of 97% and the effective length calculated using GVM. With that value of lumped losses the curve is
Specified reflectance Auto-correlation width Spectral with 98% 1181 fs 26 nm 95% 702 fs 31 nm 90% 651 fs 30 nm 87% 536 fs 24 nm
Table 3.2: Pulse and spectral widths. 30
Figure 3.10; Average signal power for the 87% output coupler.
a best fit curve. Although the data points are not exactly on the cui've, the general tendency is very similar.
Table 3.2 lists the spectral and autocorrelation widths of the signal field. W ide spectra and pulse widths compared to the pump pulses (120 fs pulse and 8.5 nm spectral widths) indicate that there are mechanisms that broaden the signal pulse duration and spectral width. At maximum conversion, the autocorrelation pulse width is 650 fs.
200 180 160 140 E 120 100 ra 80 (f) 60 40 20 0 1 1---
^
--- 1--- 1--- 1 1 d ... r ... I :1
f , . i ... f ...m. $O
_________________ 1________________A
_________________ 1_________________ 1 1 100 200 300 400 500Average Pump Power (mW) 600 700
Figure 3.11: Average signal power for the 90% output coupler.
Figure 3.12: Average signal power for the 95% output coupler.
When we compare our OPO system with other TirSapphire pumped OPO systems, our system has less efficiency and has longer pulse widths. In [22], a KTP based TirSapphire laser pumped femtosecond OPO with the intracavity jDulse compression is reported. The OPO has a 680 m W signal output at a wavelength of 1.3^m with a pulse width of 115fs when OPO pumped by a 2.4 W pump beam at a wavelength of 780 nm. The conversion efficiency is 28.3%. Our OPO has 27% conversion efficiency. Also the pulse width of our signal beam is much larger.
Figure 3.13: Average signal power for the 98% output coupler.
Figure 3.14: Conversion efficiency for the 87% output coupler 0.25 05 O 0.1 0.05 1 1 1 1 l b 1 () ) I : I $ _______L______et> 1______ 1_______L 100 200 300 400 500
Average Pump Power (mW) 600 700 Figure 3.15: Conversion efficiency for the 90% output coupler.
Figure 3.16: Conversion efficiency for the 95% output coupler.
Figure 3.17: Conversion efficiency for the 98% output coupler.
0.95 0.9 0.85 I 0.8 ω SO.75 OL E £ 0.7 0.65 0.6 0.55 0.5 100 200 300 400 500
Average Pump Power (mW) 600 700 Figure 3.18: Pump depletion for the 90% output coupler.
3.6
Self Doubling OPO
Intracavity second harmonic generation is a technicjue used for frequency up- conversion [22-24]. A second crystal is placed inside the OPO cavity where the output coupler is replaced by a high reflector. The high intra cavity sig nal intensity is used for efficient frequency doubling. The second harmonic generation process acts as the output coupler of the OPO.
We have invented a new intracavity frequency doubling scheme that uses a single crystal for both parametric generation and frequency doubling [25].
532
nm output
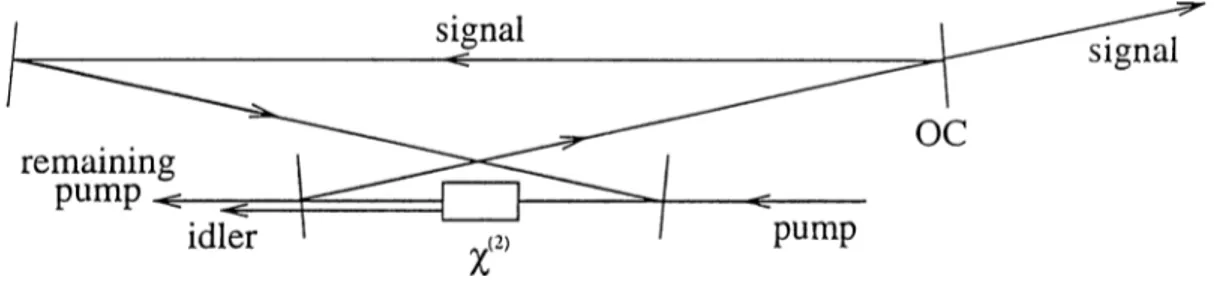
Figure 3.19: Self-doubling OPO setup.
The experimental setup is very similar to the regular OPO experiment. Our self-doubling OPO is pumped by a Ti:Sapphire laser operating at a wavelength of 739 nm. As a result, the signal wavelength of the OPO is at 1064 nm, corre sponding to an idler wavelength of 2420 nm. The OPO cavity resonates only the signal wavelength. The signal beam is also phase-matched for second harmonic generation (SHG) at the same crystal orientation. With proper polarization rotation, an output beam at a wavelength of 532 nm can be obtained. To the best of our knowledge, this is the first demonstration of optical parametric oscillation and phase-matched frequency doubling within a single crystal.
We use the same 8 mm long KTP crystal cut for doubling 1064 nm in a type- II phase-matching geometry {Θ = 90°, φ = 23°). The crystal has antireflection coatings for the fundamental and second-harmonic wavelengths. The second- hcirmonic output is />polarized. In parametric generation, the pump at 739 nm and the signal at 1064 nm are both p-polarized, and the idler at 2420 nm is •s-polarized.
A ring cavity is made of four mirrors that are high reflectors at 1064 nm as shown in Figure 3.19. M l and M2 are 25cm radius concave, M3 is a 3m radius concave, and M4 is a flat mirror. The KTP crystal is positioned at the intracavity focus between M l and M2. The pump beam is focused with a lens (L) of focal length 15cm and enters into the cavity through M l. For efficient frequency doubling, a half-wave retarder at 1064 nm is placed inside the OPO cavity which couples some of the horizontally polarized signal beam
0.5 0.4 C O l°-3 Ql (D Q 0.2 0.1 0.0 • · Ί50 200 250 300 350 Pump Power [mW] 400 450
Figure 3.20: Pump depletion as a function of pump power.
to the vertical. The length of the cavity is adjusted by moving M4 in order to synchronize the intracavity signal pulses with the pump pulses. The frequency doubled beam at 532 nm exits the cavity through M2. In addition, there is a weak 1064 nm beam coming out through M3, as this mirror has a slightly lower reflectance compared to the other cavity mirrors. This output is used to probe the signal beam for measurements.
When the half-wave retarder is not in the cavity, there is no (or very little) frequency doubling. This results in an undercoupled OPO cavity for the signal beam. We measured the threshold for this OPO to be 60 mW . At a pump power of 500 m W , the pump beam is depleted by more than 50%, showing strong conversion. In the case of frequency doubling with the retarder in place, the threshold of the OPO becomes 170 mW. At a pump power of 440 mW, 25 m W of 532 nm is obtained, corresponding to 6% conversion efficiency to the green. Figure 3.20 shows the pump depletion with the retarder in the cavity. Depletion is seen to be as high as before, indicating strong conversion to the signal wavelength.
Compared to intracavity SHG systems with another crystal [22,23], our system is less efficient because it is not well optimized. Although our system works well, higher efficiencies can be reach by optimizing the cavity focus size, the focusing of pump beam and the length of the KTP crystal.
Chapter 4
Conclusion
This thesis outlines our experimental work to construct and characterize KTP crystal based ultrafast optical parametric oscillators. VVe use a femtosecond Titanium:Sapphire laser as a pump source at a wavelength of 745 nm. Our OPO converts this pump beam to a signal beam at a wavelength of 1068 nm.
We get a maximum signal intensity of 170 m W when the OPO is pumped with 640 m W and the 10% output coupler is used, corresponding to 27% con version efficiency. The corresponding pump depletion is better than 44%. We need smaller cavity focii to reach higher signal intensities with higher output couplers.
We observe that the signal beam has larger spectral and pulse width than the pump beam. With the increase in output coupling, we get shorter pulses. Our future work includes the construction of dispersion compensation schemes to investigate the effects on pulse and spectral widths. Also, we plan to use different cavity mirrors and lenses to increase the focusing of the signal and pump beams for better conversion efficiency.
In addition, we have demonstrated a self-doubling OPO where the intra cavity signal light at a wavelength of 1064 nm is doubled by the same KTP crystal. This is possible because our crystal is also phase matched for type-II second harmonic generation of at a wavelength of 1064 nm. For efficient con version, we place a halfwave plate inside the cavity to rotate the polarization of the signal beam for the type-II phase matching geometry. To the best of our knowledge, this is the first demonstration of intracavity second harmonic generation with a single crystal used for both parametric oscillation and second