IEEE TRANSACTIONS ON MEDICAL IMAGING, VOL. 14, NO. 2, JUNE 1995 283
An Adaptive Speckle Suppression Filter
for Medical Ultrasonic Imaging
Mustafa Karaman, M. Alper Kutay, and
Gozde Bozdagi
Abstract- An adaptive smoothing technique for speckle sup-
pression in medical B-scan ultrasonic imaging is presented. The technique is based on filtering with appropriately shaped and
sized local kernels. For each image pixel, a filtering kernel, which fits to the local homogeneous region containing the processed pixel, is obtained through a local statistics based region growing technique. Performance of the proposed filter has been tested on the phantom and tissue images. The results show that the filter effectively reduces the speckle whie preserving the resolvable details. The simulation results are presented in a comparative way with two existing speckle suppression methods.
I. INTRODUCTION
ECAUSE of the coherent nature of phased array ultra-
B
sound scanners, constructive and destructive interference effects of backscattered echoes from unresolvable random tissue inhomogeneities result in mottled B-scan images [ 11-[4]. This occurs especially in imaging organs such as liver and kid- ney whose underlying structures are too small to be resolved by ultrasound scanners. Speckle is the term used for granular pattern that appears on B-scans due to the mottling and can be considered as a kind of multiplicative noise. Speckle degrades the image quality of B-scans, and hence reduces the ability of a human observer to discriminate the fine details in diagnostic examination. It also decreases the efficiency of further image processing such as edge detection.Various speckle reduction methods based on incoherent processing and image postprocessing techniques have been reported in the literature. Incoherent processing techniques are based on the averaging of multiple images of the same scan plane, where the images are obtained by varying transducer frequency and/or view angle to achieve independent or par- tially uncorrelated speckle patterns [5], [6]. These imaging techniques increase target-detection capability of phased array scanning at the expense of increased system complexity. On the other hand, speckle suppression schemes based on image postprocessing involve nonadaptive or adaptive filtering of the
Manuscript received September 17, 1993; revised January 30, 1995. The Associate Editor responsible for coordinating the review of this paper and recommending its publication was R. Martin.
M. Karaman was with the Department of Electrical and Electronics En- gineering, Bilkent University, Ankara, 06533 Turkey. He is now with the Department of Electrical Engineering and Computer Science and Bioengi- neering Program, University of Michigan, Ann Arbor, MI 48109-2122 USA. M. A. Kutay is with the Department of Electrical and Electronics Engineer- ing, Bilkent University, Ankara, 06533 Turkey.
G. Bozdagi was with Department of Electrical and Electronics Engineering, Bilkent University, Ankara, 06533 Turkey. She is now with the Department of Electrical Engineering, University of Rochester, Rochester, NY 14627 USA; e-mail: [email protected].
IEEE Log Number 9411370.
B-scan image to smooth out speckle. These techniques do not require any hardware modification in the image reconstruction system, and hence have found a growing interest [7]-[16].
Ultrasound B-scan images have some special features that must be preserved by the filtering, such as bright large scale interfaces between organs, structures with dimensions com- parable to speckle size, and boundaries between two regions with slightly different gray levels. Therefore, linear nonadap- tive smoothing techniques used for other image processing purposes may not be adequate for ultrasound images. Many of such techniques introduce severe blurring and/or show unacceptable performance in elimination of speckle. Various adaptive filtering techniques for different applications, es- pecially for removal of signal dependent noise, have been reported in the literature [ 191-[23]. Adaptive filtering schemes based on image local statistics have been used for speckle reduction in ultrasonic B-scan imaging [7], 181, [11]-[131.
Identification of characteristic parameters of speckle statis- tics is critical for speckle suppression techniques based on adaptive postfiltering. It has been shown that the envelope detected echo signal of the fully developed speckle has the Rayleigh distribution with the mean proportional to the stan- dard deviation [3], [17], [18], [lo]. Recently, Loupas ef al. [ 1 11 have shown that nonlinear processing (such as logarithmic compression) employed on ultrasound echo images affects the speckle statistics in such a way that the local mean becomes proportional to the local variance rather than the standard deviation. This result has been used in adaptation of filter parameters to smooth out speckle from B-scans [8], [11]-[13].
In this study, an adaptive speckle suppression filter (ASSF) based on smoothing of B-scan images using local statistics is presented. The filter adaptation is achieved by using ap- propriately shaped and sized local filtering kernels. Since no limitation on kernel shape is imposed, each kernel effectively fits an arbitrarily shaped homogeneous region containing the processed pixel. Each kernel is obtained through a region growing which employs image local statistics as the region growing criteria. Performance of ASSF is tested on both a tissue-mimicking phantom image and a liver image. The results are presented in a comparative way with two speckle suppression methods proposed in [ 1 11, [ 121.
In the next section, the adaptive speckle suppression, includ- ing the measurements of speckle statistics on the phantom and tissue images and filtering procedure, are presented. Section I11 covers the simulation results and comparison. Selection of the filter parameters and computational complexity of the filter are discussed in Section IV.
02784062/95$04.00 0 1995 IEEE
284 2.5 2 - z
y
1.5-.
E 1 - > 0.511. ADAPTIVE SPECKLE SUPPRESSION
-
-
1
IEEE TRANSACTIONS ON MEDICAL IMAGING, VOL. 14, NO. 2, JUNE 1995
A. The Measurements
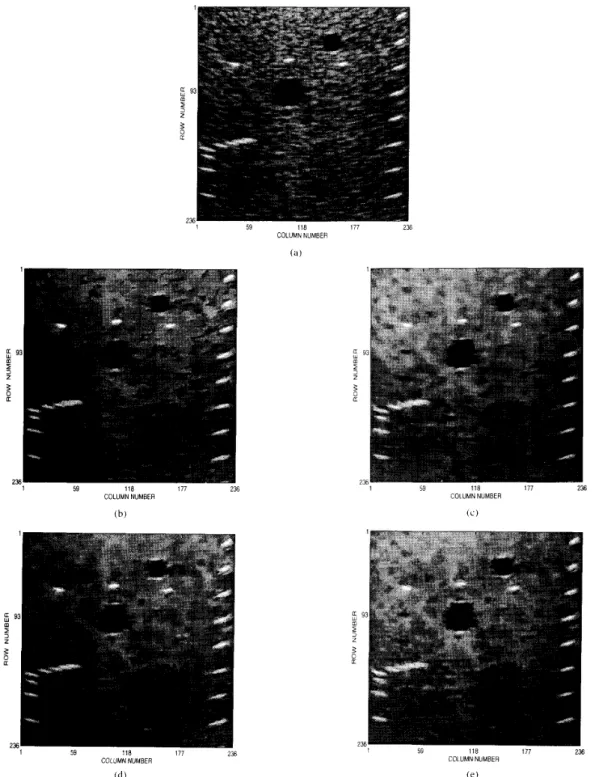
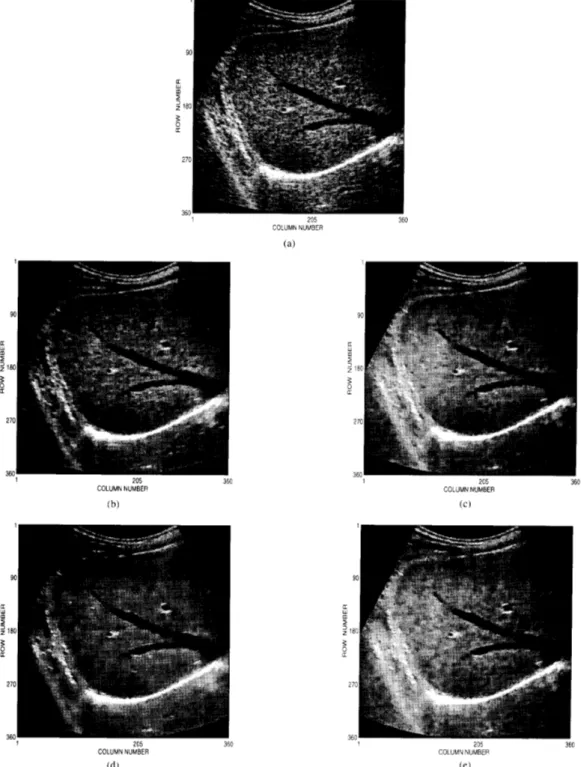
Various measurements on a phantom image and a liver image are performed to examine the speckle statistics. These measurements are variance/mean versus window size and vari- ance versus mean. The phantom image (Fig. 4(a)) is a portion of a phased array B-scan sector image. It is reconstructed by digital processing of radio frequency data acquired from a standard AIUM resolution phantom with a conventional 3.3-MHz, @-element linear array. The image has a 60-dB display dynamic range resulting from logarithmic compression of envelope detected echo. The pixel resolution of the phantom image is about 0.2 mm. Further details about the phased array data and reconstruction of the phantom image can be found in [24] and [25], respectively. The liver image (Fig. 9(a)) is obtained using a commercial scanner with a 3.5-MHz curvilinear array. The display dynamic range of the image is 50 dB and the pixel resolution is about 0.4 mm.
To choose a proper window size to represent the speckle statistics, local mean and variance on speckle areas with on speckle areas with no resolvable details are measured for different sized square windows. The mean and variance are computed as W / 2 W P (1) pi ,J ' = - w2 x i - m , j - n m=-W/2 n=-W/2 WI2 W P a ? . w == - w2 ( x i - m , j - n - ~ i , j ) ~ (2) m=-W/2 n=-W/2
where xi,j is the pixel at the location ( i , j ) , and W x W
is the size of the square window. The ratios of variance to mean for different window sizes are shown in Fig. 1. For each window size, the variance and mean computations are carried out at different locations on speckle regions and the results are averaged. The error bars of the figure represent one standard deviation of the averaged results. Fig. 1 shows that the accuracy of estimation of the speckle statistics, as expected, increases with window size. The asymptotic value of the variance/mean of speckle is about 2.5 and 2.0 for the phantom and liver images, respectively. The figure indicates that the window sizes larger than 9 x 9 can approximate the speckle statistics for both of the phantom and liver images.
The local variance, a;,j, and local mean, p i , j , at different locations on speckle regions are measured to test their relation (Fig. 2). In these measurements, a square window with a size of 11 x 11 is used. Fig. 2 illustrates that the ratio of variance to mean is constant and is about 2.5 and 2.0 for the phantom and liver images, respectively. As a result, the measurements indicate that the relation between variance and mean of the speckle on the phantom and liver images is linear [ 111. Furthermore, the measurements depicted in Fig. 2 fit to the following signal-dependent noise model [ 111:
x = s + J ; ; n (3)
where x, s, and n represent the observed signal, noise-free
signal, and noise, respectively. This model implies that, on
3x3 5x5 7x7 9x9 11x11 13x13 15x15
WINDOW SIZE, WxW (PIXELS)
2 - $ 1 5 - 0
F '
5 B 1 - > O . 1I
3x3 5x5 7x7 9x9 11x11 13x13 15x15WINDOW SIZE, WxW (PIXELS) (b)
Fig. 1.
phantom image and (b) the liver image.
The local statistics computed on different windows for (a) the
homogeneous regions where s can be assumed constant, the image variance is proportional to the mean.
B. The Filter
The signal-dependent noise model leads to use of smoothing operators on the homogeneous regions where the signal can be assumed constant. The local variance to mean ratio of speckle can be easily measured on the image. Then, using the measured parameter, it is possible to decide whether the processed pixel is within a homogeneous region or not. In general, if the local variance to mean ratio is larger than that of speckle, then the corresponding pixel can be considered as a resolvable object. Otherwise, it belongs to a homogeneous region, and hence is subject to smoothing [12]. The shape of speckle pattern and average speckle size vary at different locations of sector images. Therefore, it is highly desirable to have arbitrarily shaped and sized homogeneous regions for smoothing. The designed ASSF overcomes these problems in
KARAMAN et ul.: ADAF'TIVE SPECKLE SUPPRESSION FILTER 285 380, 1 I 360
-
340 320-
- 240-
220-
200-
180' I 80 90 100 110 120 130 140 150 MEANI
1
- a=0.001, b=0.01, c=50 0.02t a=0.001, M . 0 5 . c=1001
I
"
I
0.01L.
J
' 0 011 Oj2 013 014 015 016 017 Ole 019 1 VARIANCE / MEAN (a) Fig. 3. local statistics, a .The statistical similarity bound, B ( c r ) , as a function of normalized
350 - 300
-
w4
250 - 5 3 200- 150 - 100-this paper (cy0 = 2.5 and cy0 = 2.0 for the phantom and liver images, respectively). According to the measurements depicted in Fig. 1, the window size is chosen as 11 x 11 for all statistics computations in this study if not stated otherwise. As the first step in ASSF, ai,j for all ( i , j ) and cy0 are computed and stored
in a table to be used in the region growing.
2 ) Region Growing Procedure: The region growing is used to form groups of pixels satisfying a certain homogeneity crite- rion [26], [27]. Depending on the application, the homogeneity criterion, which is the critical point in region growing, can be a function of various image parameters, such as gray level, texture, local statistics, and color similarities. Each parameter characterizes the homogeneity from a different point of view.
loo MEAN 160 180 200 In ASSF, the local statistics, cr,,j, are used as the quan-
... _. .. .
titative measure to obtain a homogeneous region for each image pixel. A fixed sized square window, which accurately represents the statistics, is chosen to compute the local statistics at each pixel location. In region growing, each
(b) Fig. 2.
speckle on (a) the phantom image and (b) the liver image.
The linear relation between the local variance and mean of the
speckle suppression. This is achieved through a region growing procedure which effectively fits the grown region to the homogeneous area without imposing any shape constraint. The region growing procedure employs a look-up table consisting of statistical bounds for different values of local statistics, instead of using a single hard bound as the growing criteria. The overall procedure of ASSF can be described in three main steps: computation of local statistics, region growing, and application of the smoothing operator.
I ) Computation of Local Statistics: The local statistics is computed using the mean and variance expressions given in ( 1 ) and (2), respectively. For the sake of simplicity, a single parameter representing the local variance to mean ratio for a pixel located at ( i $ j ) is defined as
(4)
f f L J -
-.
Also, the characteristic value of the local statistics of speckle is denoted by (YO and will be used accordingly in the rest of
-
G
PL,>J
image pixel is taken as a seed point. Then, any pixel with local statistics close to the seed pixel's local statistics within a certain bound is included to the region of the seed pixel. This search is repeated for all pixels which are spatially close to the seed pixel within a certain distance bound. In other words, to test whether a pixel (m, n ) belongs to the homogeneous region
of a seed pixel ( i , j ) , the following must be satisfied:
(7) These tests are performed for all pixels (e.g., for all m and n ) to obtain the final homogeneous region for the seed pixel ( i , j ) .
The connectivity, statistical similarity criterion, and spatial distance bound, expressed in ( 5 ) , (6), and (7), respectively, are used to control the shape and size of the growing region. Test of the connectivity is easily realized in the region growing by
2x6 l E E t TRANSACTIONS ON MEDICAL IMAGING. VOL 14, NO 2. J U N E 1995 _"" COLUMN NUMBER COLUMN NUMBER ( a ) U W 5 z 1 59 118 177 236 COLUMN NUMBER ~ " " COLUMN NUMBER 1 59 118 177 236 COLUMN NUMBER ( d ) (e)
Fig. 4. The phantoin iniagc: (a) original and liltered hq ( h ) HRGMF. (c) AWMF, ( d ) ASSF-MEAN. and ( e ) ASSF-MEDIAN.
following the neighboring pixels of the seed pixel andor pixels already included in the region. The spatial distance bound, Dtl, is the locality parameter and hence depends on the kernel size used for computation of the local statistics. In ASSF, the Di,
is chosen in such a way that the total number of pixels in the grown region does not exceed W 2 . The statistical similarity
bound,
p(
.), is chosen as a function of ( Y , . , as(8) where ( 1 , (1, and c are coefficients that depend on N O and the desired smoothing level. The coefficient a is a biasing
factor which controls smoothing employed both on speckle
KARAMAN PI ( 1 1 . . ADAPTIVE SPECKLE SUPPRESSION FILTER
Fig. 5 .
by (bl HRGMF, The magnified portions of the phantom image: (a) original and filtered ( c ) AWMF, (dl ASSF-MEAN, and (e) ASSF-MEDIAN.
and signal, e.g., larger values of a result in higher smoothing of both speckle and edges. The coefficient 6 is a scaling factor used for adjusting the magnitude of statistical bound. Larger
400C 350C 300C v)
w'
250Ci?
0"
200C [r3
150C z m iooc 50C C 287 0.2 0.4 0.6 0.8 1 NORMALIZED VARIANCE Fig. 6.(a) HRGMF, (b) AWMF, (c) ASSF-MEAN, and (d) ASSF-MEDIAN. Histogram of the nonnalized variance of the filtered phantom images:
values of b increase smoothing level as far as c allows. The third coefficient, c, controls the value and the sharpness of the statistical threshold, and hence directly depends on NO. The pixel with local statistics below this threshold is smoothed more and vice versa. Since speckle statistics mainly depend on the scanner specifications, the coefficients of (8) can be determined beforehand and stored in a look-up table. For two different sets of the coefficients, the
P ( N )
for the normalized N is shown in Fig. 3.The region growing procedure described above results in a connected, appropriately shaped and sized homogeneous region for each seed pixel. Note that the grown region is not necessarily symmetric around the seed pixel. Also note that, in the limiting case, the grown region can have a unity size that consists of only the seed pixel.
3) Application of Smoothing Operator: A smoothing oper-
ator (mean or median) is applied on each kernel obtained through the region growing: The output corresponding to each seed pixel is the meadmedian of the pixels within the grown region associated with the seed pixel. After filtering of the whole image, the neighboring regions with similar intensity values are merged. Then, the output pixel values corresponding to the seed pixels of the merged regions are updated by applying the smoothing operator on the new kernels. The merging is realized as follows. Consider the grown region of a seed pixel located at ( i . , j ) . Let this region be labeled by . Z i , j ,
and denotes the number of pixels in 2 i . j . If N , , j
5
Kb,then Zi,J is not involved in the merging procedure. Otherwise, each region Z,,,,, neighboring the region Zi, is merged to the region Z ; , j if the following is satisfied:
Here, ALL and Kh are positive constants and represent the
bounds for the gray level intensity and the number of pixels, respectively.
288 250, I 200 3 2 150
g
100-
a 50 I 59 118 177 236 COLUMN NUMBER (a) 250 200a
150 3 1 $100-
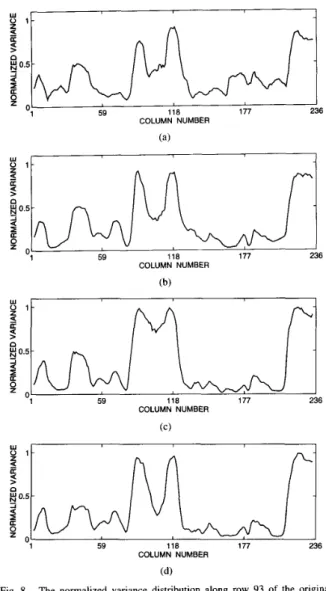
a 50 "1 59 118 177 236 COLUMN NUMBER (b) 250 I I I 59 118 177 236 COLUMN NUMBER (C) 250 I I I 59 118 177 238 COLUMN NUMBER (d)Fig. 7. Pixel values along row 93 of the original and filtered phantom
images: (a) HRGMF, (b) AWMF, (c) ASSF-MEAN, and (d) ASSF-MEDIAN.
111. SIMULATIONS AND COMPARISON
The performance of ASSF is investigated on the phantom and tissue images together with two recently reported methods [ 1 11, [ 121 employing image local statistics in filter adaptation. The filter proposed in [l 13 is an adaptive weighted median filter (AWMF) whereas the other reported in [12] is a homo- geneous region growing mean filter (HRGMF). Each of these methods is outlined here before presenting the simulations and comparison.
A. The Methods
1) ASSF: The ASSF with two different smoothing opera- tors, arithmetic mean and standard median, is considered here. The overall procedure of ASSF can be outlined as follows:
Prepare the table for the region growing criteria (8). Compute ai,j for all (z,j) ((l), (2), and (4)).
For all pixels:
IEEE TRANSACTIONS ON MEDICAL IMAGING, VOL. 14. NO. 2. JUNE 1995
COLUMN NUMBER
l
o
:
;
[
z
e
59 118 177 COLUMN NUMBER O1!
+
-J
-J
a
i7
1 59 118 177 236 COLUMN NUMBERe o
( 4Fig. 8. The normalized variance distribution along row 93 of the original
and filtered liver images: (a) HRGMF, (b) AWMF, (c) ASSF-MEAN, and (d) ASSF-MEDIAN.
--Grow the homogeneous region ((5)-(8)). -Apply smoothing operator in the grown region. -Output the result.
For all pixels:
-Merge the neighboring regions (9).
-Update the outputs by applying smoothing operator The spatial distance bound
Db
of (7) is chosen in such a way that the number of pixels in the grown region does not exceed 11 x 11, which is the window size used for the computations of cui,j's. The bounds used for the region merging (9) are&i = 5 and Kb = 5. Also, the coefficients of (8) are chosen
as a = 0.001, b = 0.01, and c = 50 for the phantom image and a = 0.001, b = 0.05, and c = 100 for the tissue image.
2) HRGMF: The filtering kernels of HRGMF are obtained through a split and merge procedure used in region growing based segmentation. The kernel shape is restricted to be
KARAMAN cf d.: ADAF'TIVE SPECKLE SUPPRESSION FILTER 2x9 1 90 U I z' 180
5
270 205 360 360 COLUMN NUMBER (a) 1 205 360 COLUMN NUMBER (b) 1 205 360 COLUMN NUMBER ( C ) 1 205 360 COLUMN NUMBER (d) 205 COLUMN NUMBER (e) 360Fig. 9. The liver image: (a) original and filtered hy ( h ) HRGMF, (c) AWMF. (d) ASSF-MEAN. and (e) ASSF-MEDIAN
rectangular. The procedure of HRGMF can be outlined as follows: An initial seed region with size comparable to average speckle size is chosen. If N ,
5
QO, then the initial seed regionis taken as the final region. Otherwise, the initial seed region is region (one at a time) until ( v ,
5
N O . Then, the final seedregion is grown by merging the neighboring pixels along a row/column if a s
<
QO where1 1
contracted by splitting edge rows and columns of the current (1s = ~- - y ( . r l . / - p L J ) * .
IEEE TRANSACTIONS ON MEDICAL IMAGING, VOL. 14. NO. 2, JUNE 1995 w 200
3
150- h 3 % 100- -I 50 290i4w7
- -[:
.... .... .. 2000 :j w 2 0 0 - 3 $ 150-2
100- 2 P 50 0 -0 - I HRGMF - - AWMF - ASSF-MEAN ASSF-MEDIAN_ _ _
0 0.2 0.4 0.6 0.8 1 NORMALIZED VARIANCE Fig. 10.(a) HRGMF, (b) AWMF, (c) ASSF-MEAN, and (d) ASSF-MEDIAN. Histogram of the normalized variance of the filtered liver images:
Here, S represents the merged row/column, z k , ~ are pixels within S, Q S is the number of pixels within S, and ,LL%,~ is
the mean of the current region excluding S . The growing is continued until a s
>
QO. The standard mean filtering isapplied on the final grown region and the output is assigned to the seed pixel. In our simulations with HRGMF, the initial seed region has a size of 7 x 7, and cy0 is 2.5 and 2.0 for the
phantom and tissue images, respectively.
3) AWMF: The weighted median processing in AWMF is performed on a fixed running window with the weights adjusted according to the local statistics. For filtering operation on pixel ( z , j ) , the pixel weights in the window with a size of W x W are chosen as follows:
(1 1)
where W O is the central weight and g is a scale factor.
The negative weights are set to zero. If a,,J = 0, then AWMF performs the maximum smoothing and behaves as a standard median filter with a kernel size of W x W . If cy,,J is
sufficiently large, then it fully preserves the signal value. In our simulations, the parameters of AWMF are chosen as W = 9
and WO = 99 for filtering of both the phantom and liver images whereas the value of g is 5 and 7.5 for the phantom and liver images, respectively.
wm,n = WO
-
g J ( i - m)2+
( j - n)2a % > IB. Simulation Results and Comparison
The performance of each filter outlined in the previous subsections is evaluated qualitatively on the phantom and liver images. Fig.
4
shows the original and filtered phantom images using HRGMF, AWMF, ASSF with mean operator (ASSF- MEAN), and ASSF with median operator (ASSF-MEDIAN). The two portions of each image, showing a cyst structure and distribution of the point reflectors, are magnified and presented in Fig. 5. For each filtered image, the histogram250 H
i
J 200 - % 100- -I $150- E -I 50 - I 90 180 270 360 ROW NUMBER (a) w 200 - 3 $ 150- % 100- 2 P 50 - I 90 180 270 360 ROW NUMBER (b) 2501
n
-1 90 180 270 360 ROW NUMBER (C) 250 ni
"1 90 180 270 360 ROW NUMBER (d)Fig. 11. Pixel values along column 205 of the original and filtered liver images: (a) HRGMF, (b) AWMF, (c) ASSF-MEAN, and (d) ASSF-MEDIAN.
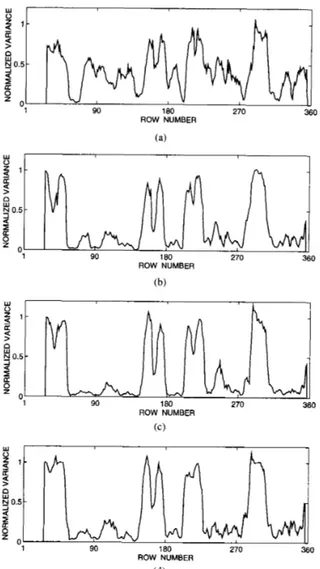
of the normalized local variance is given in Fig. 6, where the local variance at each pixel is normalized to that of the original image pixel. Also, pixel values and normalized local variance along row 93 are given in Figs. 7 and 8, respectively. The original and filtered liver images are shown in Fig. 9. The histograms of normalized variances of the filtered images are given in Fig. 10. Pixel values and local variance along the column 205 are presented in Figs. 11 and 12, respectively.
Comparison of the filtered images (Figs. 4 and 9) together with the variance histograms (Figs. 6 and 10) indicates that each filter effectively smooths speckle regions on the images, but each filter shows different action to preserve edges and textural content of resolvable structures. The AWMF preserves the edges and point targets relatively better than the HRGMF, where the HRGMF performs partial smoothing in almost all regions. The ASSF, especially ASSF-MEAN, does not smooth the edges and preserves the textural content of resolvable objects. The ASSF-MEDIAN acts as similar to the AWMF
KARAMAN et al.: ADAPTIVE SPECKLE SUPPRESSION FILTER W I I W I 1 I w a 0 0.5 a
z
1 90 180 270 360 ROW NUMBER W I 1 -1 90 180 270 360 ROW NUMBER (d)Fig. 12. The normalized variance distribution along column 205 of the original and filtered liver images: (a) HRGMF, (b) AWMF, (c) ASSF-MEAN, and (d) ASSF-MEDIAN.
in smoothing of low contrast lesions. It is illustrated in Fig. 5 that ASSF shows better performance in preserving the point targets compared to the others. Fig. 5 depicts that ASSF- MEAN fully preserves the textural content and edges of the cyst while smoothing the speckle region surrounding the cyst. The HRGMF and AWMF smooth the inside of the cyst as well as the surrounding speckle region. Figs. 6 and 10 illustrate that the number of highly smoothed and preserved pixels of the ASSF images, indicated by the number of pixels with very large and very small local variances, respectively, is larger than that of any other filter. Figs. 7, 8, 11, and 12 illustrate the action of each filter along a single image line. The normalized variances corresponding to the output of ASSF along the regions containing resolvable objects are relatively closer to unity. In general, the simulation results show that each filter can effectively suppress speckle and performance of ASSF- MEAN to preserve the edges, point targets, and content of low contrast lesions better than that of the other filters.
29 1
I v . DISCUSSION AND CONCLUSION
An adaptive filter for smoothing speckle from ultrasound B- scan images is investigated. This filter employs a smoothing operator (mean or median) on kernels obtained by the local statistics based region growing. The filter makes use of local image content to eliminate speckle effectively while preserving resolvable details. Trade-off between smoothing and signal preservation is controllable by the look-up table consisting of statistical similarity bounds for different values of local sta- tistics. Performance of the proposed filter has been evaluated and compared to that of two other filters by simulations on the B-scan phantom and tissue images. In these simulations, the filter adaptation parameters have been chosen through various trials to obtain good performance both in smoothing and in signal preservation. Future studies should quantitate the filter performance for various filter parameters using test phantoms containing both high and low contrast details with different size, contrast level, and spacing [28], [29].
Adaptation of ASSF, as well as those of HRGMF and AWMF, is based on the image local statistics. Since the adaptation criteria are based on the same ground, it may be expected that the performances of the filters would be similar. The better performance of ASSF in preserving resolvable details, however, is the result of different schemes employed in adaptation. In ASSF, adaptation of kernel shape as well as size results in effective fitting of the smoothing window to arbitrarily shaped and sized homogeneous regions. In addition, the look-up table, consisting of statistical similarity bounds used for the region growing, offers more efficient criteria to obtain homogeneous regions, compared to the case of using a tight bound such as ( Y O employed in HRGMF.
The window size used for computations of local statistics is chosen as 11 x 11 by means of the measurements presented in Fig. 1 . The window size depends on the average speckle size determined mainly by the scanner specifications. Therefore, the window size used in this study may not be suitable for other ultrasound scanners, and hence it must be measured prior to the filtering. The window size must be large enough for accurate measurement of local statistics. On the other hand, it must be kept sufficiently small for accurate detection of resolvable structures.
The characteristic value of fully developed speckle statistics, CYO, is a critical factor in forming the look-up table of
p(
.) used for the region growing. Generally, pixels with ai,j<
(YO aretreated within the homogeneous region, and hence
p(.)
can be sufficiently large to achieve a desired smoothing level. On the other hand, for signal preservation,p(.)
must be small for those pixels with ai,j<
(YO that correspond to resolvabledetails. Since the speckle statistics depend on the scanner specifications, for different scanners, the coefficients used for forming the look-up table of
p(
.) must be appropriately determined through various trials.Smoothing using arbitrarily shaped and sized kernels can produce some high-frequency artifacts on the output image. The region merging procedure in ASSF is employed to avoid such artifacts. The similarity of mean intensities of the neigh- boring regions and the their sizes are used as the merging
292 IEEE TRANSACTIONS ON MEDICAL IMAGING, VOL. 14, NO. 2, JUNE 1995
criteria that are represented by A p and Kb, respectively, in (9). Ap must be large enough to prevent the high-frequency artifacts and, on the other hand, it must be small enough to avoid blurring. Since the larger values of Kb can result in merging of regions corresponding to the resolvable details, it must be kept sufficiently small. These parameters also depend on the imaging system, and hence must be properly chosen for different ultrasound scanners. Also, speckle statistics may be modified by signal processing employed in some commercial scanners resulting in a nonlinear relation between speckle variance and mean [30]. Such effects must be compensated prior to speckle suppression with ASSF as well as with the methods employing filter adaptation based on the linear relation between speckle variance and mean [30]. The optimal selection of the filter parameters and compensation of signal processing effects independent to the scanner are the key to clinical application of the ASSF presented in this paper. Future studies should focus on this issue.
Computational complexity of ASSF is comparable to that of HRGMF [12], since both of them involve similar processing, whereas AWMF [ l l ] requires only computation of local statistics and weighted median filtering and is computationally more efficient than ASSF. The proposed filter, ASSF, is an image postprocessing technique and is designed for off-line applications. It can, however, be mapped on a special purpose hardware for real-time applications.
ACKNOWLEDGMENT
The authors would like to thank Prof. M. O’Donnell of University of Michigan for providing the phantom and tissue image data and A. I r a q for cooperation in implementing the AWMF.
REFERENCES
[ l ] P. A. Magnin, “Coherent speckle in ultrasound images,” Hewlett-
Packard J., vol. 34, no. 10, pp. 3 9 4 0 , Oct. 1983.
[2] J. W. Goodman, “Some fundamental properties of laser speckle,” J. Opt.
Soc. Amer., vol. 66, pp. 1145-1150, Nov. 1976.
[3] C. B. Burckhardt, “Speckle in ultrasound B-mode scans,” IEEE Trans. Son. Ultrason., vol. SU-25, pp. 1-6, Jan. 1978.
[4] J. G. Abbott and F. L. Thurstone, “Acoustic speckle: Theory and experimental analysis,” Ultrason. Imag., vol. 1, pp. 303-324, 1979. [5] P. A. Magnin, 0. T. von R a m , and F. L. Thurstone, “Frequency
compounding for speckle contrast reduction in phased array images,”
Ultrason. Imag., vol. 4, pp. 267-281, 1982.
[6] M. Berson, A. Ronan, and L. Pourcelat, “Compound scanning with an electrically steered beam,” Ultrason. Imag., vol. 3, pp. 303-308, 1981. [7] D. T. Kuan, A. A. Sawchuk, T. C. Strand, and P. Chavel, “Adaptive restoration of images with speckle,’’ IEEE Trans. Acoust. Speech Signal Processing, vol. ASSP-35, pp. 373-382, Mar. 1987.
[8] J. C. Bamber and C. Daft, “Adaptive filtering for reduction of speckle in ultrasonic pulse-echo images,” Ultrason., pp. 4 1 4 4 , Jan. 1986. [9] J. C. Bamber and J. V. Phelps, “Real-time implementation of coherent
speckle suppression in B-scan images,” Ultrason., vol. 29, pp. 218-224, May 1991.
[lo] T. Loupas, W. N. McDicken, and P. L. Allan, “Noise reduction in ultrasonic images by digital filtering,” Brit. J . Radiol., vol. 60, pp. 389-392, Apr. 1987.
[ 111 -, “An adaptive weighted median filter for speckle suppression in medical ultrasonic images,’’ IEEE Trans. Circuits Syst., vol. 36, no. 1, pp. 129-135, Jan. 1989.
[12] J. I. Koo and S. B. Park, “Speckle reduction with edge preservation in medical ultrasonic images using a homogeneous region growing mean filter,” Ultrason. Imag., vol. 13, pp. 211-237, 1991.
[I31 Y. Wu and H. Maitre, “Smoothing speckled synthetic aperture radar images by using maximum homogeneous region filters,” Opt. Eng., vol. 31, no. 8, pp. 1785-1792, Aug. 1992.
[14] D. A. Seggie and S. Leeman, “Deterministic approach toward ultrasound speckle reduction,” IEE Proc., vol. 134, pt. A, no. 2, pp. 188-192, Feb. 1987.
[I51 G. Castellini, D. Labate, L. Masotti, E. Monnini, and S. Rocchi, “An adaptive Kalman filter for speckle reduction in ultrasound images,” J.
Nucl. Med. Appl. Sci., pp. 208-213, July-Sept. 1988.
[16] J. Maeda and K. Murata, “Digital restoration of blurred images in speckle noise by a two step procedure,” Optics Commun., vol. 60, pp. 5-8, Oct. 1986.
[17] R. F. Wagner, S. W. Smith, and J. M. Sandrik, “Statistics of speckle in ultrasound B-scans,” IEEE Trans. Son. Ultrason., vol. SU-30, no. 3,
pp. 156-163, May 1983.
[ l e ] R. F. Wagner, M. F. Insana, and D. G. Brown, “Statistical properties of radio-frequency and envelope-detected signals with applications to medical ultrasound,” J. Opt. Soc. Amer. A, vol. 4, no. 5, pp. 91G922, May 1987.
[19] X. Z. Sun and A. N. Venetsanopoulos, “Adaptive schemes for noise filtering and edge detection by use of local statistics,” IEEE Trans. Circuits Syst., vol. CAS-35, pp. 57-69, Jan. 1988.
[20] R. Bernstein, “Adaptive nonlinear filters for simultaneous removal of different kinds of noise in images,” IEEE Trans. Circuits Syst., vol. [21] J. S. Lee, “Digital image enhancement and noise filtering by use of local statistics,” IEEE Trans. Pattern Anal. Machine Intell., vol. PAMI-2, no. 2, pp. 165-168, 1980.
[22] D. T. Kuan, A. A. Sawchuk, T. C. Strand, and P. Chavel, “Adaptive noise smoothing filter for images with signal-dependent noise,” IEEE
Trans. Pattern Anal. Machine Intell., vol. PAMI-7, no. 2, pp. 165-177,
1987.
[23] W. J. Song and W. A. Pearlman, “Edge preserving noise filtering based on adaptive windowing,” IEEE Trans. Circuits Syst., vol. 35, pp.
[24] M. O’Donnell and S. W. Flax, “Phase-aberration correction using signals from point reflectors and diffuse scatterers: Experimental results,” IEEE
Trans. Ultrason. Ferroelec. Frequency Contr., vol. 35, pp. 768-774,
Nov. 1988.
[25] M. Karaman, A. Atalar, and H. Koymen, “VLSI circuits for adaptive digital beamforming in ultrasound imaging,” IEEE Trans. Med. Imag., vol. 12, pp. 711-720, Dec. 1993.
[26] S. W. Zucker, “Region growing: Childhood and adolescence,” Comput.
Graphics Image Processing, vol. 5, pp. 382-399, 1976.
[27] S. L. Horowitz and T. Pavlidis, “Picture segmentation by a directed split and merge procedure,” in Proc. 2nd IEEE Int. Joint Con$ Pattern
Recognition, New York, 1974.
[28] J. T. M. Verhoeven and J. M. Thijssen, “Improvement of lesion de- tectability by speckle reduction filtering: A quantitative study,” Ultrason.
Imag., vol. 15, pp. 181-204, 1993.
[29] S. W. Simth, H. Lopez, and W. J. Bodine, Jr., “Frequency independent ultrasound contrast-detail analysis,” Ultrasound Med. Biol., vol. 11, pp. 4 6 7 4 7 7 , 1985.
[30] D. C. Crawford, D. S. Bell, and J. C. Bamber, “Compensation for the signal processing characteristics of ultrasound B-mode scanners in adaptive speckle reduction,” Ultrasound Med. Biol., vol. 19, pp. 469485, 1993.
CAS-34, pp. 1275-1291, NOV. 1987.