EXCITON TRANSFERING
MACROCRYSTALS OF COLLOIDAL
QUANTUM DOTS
A THESIS
SUBMITTED TO THE DEPARTMENT OF ELECTRICAL AND ELECTRONICS ENGINEERING
AND THE GRADUATE SCHOOL OF ENGINEERING AND SCIENCE OF BILKENT UNIVERSITY
IN PARTIAL FULLFILMENT OF THE REQUIREMENTS FOR THE DEGREE OF
MASTER OF SCIENCE
By
İbrahim Akcalı
July 2013
I certify that I have read this thesis and that in my opinion it is fully adequate, in scope and in quality, as a thesis for the degree of Master of Science.
Assoc. Prof. Dr. Hilmi Volkan Demir (Supervisor)
I certify that I have read this thesis and that in my opinion it is fully adequate, in scope and in quality, as a thesis for the degree of Master of Science.
Assoc. Prof. Dr. Vakur Behçet Ertürk
I certify that I have read this thesis and that in my opinion it is fully adequate, in scope and in quality, as a thesis for the degree of Master of Science.
Assoc. Prof. Dr. Arif Sanlı Ergün
Approved for Graduate School of Engineering and Science
Prof. Dr. Levent Onural
ABSTRACT
EXCITON TRANSFERING MACROCRYSTALS OF
COLLOIDAL QUANTUM DOTS
İbrahim Akcalı
M.S. in Electrical and Electronics Engineering
Supervisor:Assoc. Prof. Dr. Hilmi Volkan Demir
July 2013
For nonradiative energy transfer (NRET) in the field of medicine and biology as well as optoelectronics, recent advances in the fluorophores, and optical techniques and devices have led to greatly increased interest in applications employing NRET in the past decade. Replacing traditional fluorophores, colloidal quantum dots have flourished the fluorescence properties of NRET-based applications. This has also given rise to working with narrower tunable emission at a higher quantum yield with broadband absorption, and easier handling and fabrication compared to those of traditional fluorophores. A newly discovered technique, QD incorporation into macrocrystals of various salts, has enhanced the processability, photostability and robustness of these colloidal QDs. To benefit from these enhanced properties for NRET, this thesis proposed and studied macrocrystals for exciton transfer via NRET and fabricated those considering NRET mechanism. The design of these QD-embedded macrocrystal structures has enabled strong energy transfer. The experimentally measured energy transfer reached ~51%, which was obtained with careful optimization. Moreover, these hybrid structures have allowed for the observation of the QD distribution dependence of the transfer efficiency for the QDs wrapped inside macrocrystals. The steady state and time-resolved measurements in this thesis revealed that QD-incorporated macrocrystals can possibly take place of QDs in various NRET-related applications.
ÖZET
KUVANTUM NOKTACIKLARI GÖMÜLÜ
MAKROKRİSTALLERDE EKZİTON TRANSFERİ
İbrahim Akcalı
Elektrik ve Elektronik Mühendisliği Bölümü Yüksek Lisans Tez Yöneticisi: Doç. Dr. Hilmi Volkan Demir
Temmuz 2013
Optoelektroniğin yanı sıra tıp ve biyoloji alanlarında ışınımsız enerji transferi için ışıyıcılar, optik teknikler ve cihazlardaki son gelişmeler ile ışınımsız enerji transferini kullanan uygulamalarda artan bir ilgiye yol açtı. Geleneksel ışıyıcıların yerini alan, kolloidal kuvantum noktacıkları ışınımsız enerji transferini temel alan uygulamaların ışıma özelliklerini geliştirdi. Bu, geleneksel ışıyıcılara göre geniş soğurma, daha kolay kullanım ve üretim ile yüksek kuvantum verimliliğinde daha dar, ayarlanabilen ışımayla çalışılmasına olanak tanımıştır. Yeni keşfedilen bir teknik olan kuvantum noktacıklarının çeşitli tuzların makrokristallerinin içine gömülümü, kolloidal kuvantum noktacıklarının işlenebilirliğini, ışığa karşı kararlılığını ve dayanıklılığını geliştirmiştir. Bu tez, ışınımsız enerji transferinde gelişen bu özelliklerden faydalanmak için, ışınımsız enerji yoluyla ekziton transferi için makrokristalleri önermiş, makrokristallerin üzerinde çalışmış ve ışınımsız enerji transfer mekanizmasını göz önüne alarak makrokristaller üretmiştir. Kuvantum noktacıkları gömülü bu makrokristallerin tasarımı güçlü bir enerji transferini çalışır kılmıştır. Deneysel olarak ölçülen enerji transferi dikkatli optimizasyonlar neticesinde %51’ e ulaşmıştır. Ayrıca, bu melez yapılar makrokristallerin içerisinde toplanan kuvantum noktacıkları için, kuvantum noktacıklarının dağılımının enerji transferine bağlılığının gözlenmesine izin vermiştir. Bu tezdeki sabit durum ve zaman çözümlemeli ölçümler, kuvantum noktacıkları gömülü makrokristallerin, çeşitli ışınımsız enerji transferi ile ilgili uygulamalarda, kuvantum noktacıklarının yerini alabileceğini göstermektedir.
Anahtar Kelimeler:Kuvantum noktacıkları, ışınımsız enerji transferi, kuvantum noktacıkları gömülü makrokristaller.
Acknowledgements
I would like to thank my supervisor Assoc. Prof. Hilmi Volkan Demir for his guidance, kindness, supervision and invaluable support from the beginning to the end of my master’s study. It is a honor and great experience to be a graduate student of him. I learnt a lot from him about academic and social life. I want to thank him again for his encouragement, confidence and contributions to me. I would like to thank Assoc. Prof. Vakur Behçet Ertürk and Assoc. Prof. Arif Sanlı Ergün for giving helpful comments and suggestions as being a member of my thesis committee.
My special thanks to Talha Erdem for helping me with my thesis research work and reading my thesis. I would also like to share my thanks with the members of Demir Research Group. It was great pleasure for me to work, to share enjoyable moments, and to make fruitful discussions and collaborations with them. I especially thank Kıvanç Güngör, Yusuf Keleştemur, Burak Güzeltürk, Shahab Akhavan, Ahmet Fatih Cihan, Can Uran, Aydan Yeltik, M. Zafer Akgül, Sayim Gökyar, Akbar Alipour for their precious friendship, support, and contributions. I would also like to thank Özgün Akyüz, Emre Ünal, Dr. Vijay Kumar Sharma, Dr. Pedro Ludwig Hernandez-Martinez, Dr. Rohat Melik, Dr. Evren Mutlugün, Dr. Emre Sarı and Dr. Nihan Koşku Perkgöz for their help and productive collaborations.
I would like to thank engineers and laboratory staff in UNAM.
I would like to acknowledge and thank TUBİTAK-BİDEB (2210 – National Scholarship Program) for the financial support throughout this thesis.
I would like to express my special thanks to my parents Mehmet and Zeliha. Their endless support, patience, and confidence helped me throughout all my life. Without their help, none of my success would be possible.
Last by not least, I especially thank and acknowledge my twin brother, Halil, for his precious companionship, encouragement, motivation, constant support, help, patience, and sharing throughout all my life. He was the one, who was always by my side, who always protected me, helped me, encouraged me, listened to me, played, cried, and laughed with me. I will be always indebted to him for everything he brought to my life. Without him, I would not even dream what I achieved today.
Finally, I would like to express my sincere gratitude to my love, Gönül for being in my life. She brought my life matchless happiness, tastes and beauties, endless trust and faith, which I could not imagine and feel before. She became my happiness, my heart, my soul, my life, my today, and my tomorrow. Her patience, confidence, moral support, encouragement and love helped me a lot while I am writing this thesis. Without her, I could not finish my study. I want to thank her for her endless love and everything. I wish always to be near her and share our great love with her forever.
to my wonderful love Gönül,
my companion, friend, and brother Halil,
and my beloved parents...
Table of Contents
ACKNOWLEDGEMENTS ...VI LIST OF FIGURES ... X LIST OF TABLES ... XIII
1. INTRODUCTION ... 1
1.1 MOTIVATION... 2
1.2 THESISSTRUCTURE... 3
2. COLLOIDAL QUANTUM DOTS ... 5
2.1 PHYSICS OFQUANTUMDOTS... 5
2.2 SYNTHESIS OFCOLLOIDALQUANTUMDOTS... 9
2.3 CHARACTERIZATION OFCOLLOIDALQUANTUMDOTS... 12
2.3.1 Photoluminescence Measurements... 12
2.3.2 Absorbance Measurements... 13
2.3.3 Photoluminescence Quantum Yield Measurements ... 16
2.3.4 Time Resolved Fluorescence Measurements ... 16
3. FUNDAMENTALS OF NRET ... 19
3.1 THEORY OFNRET ... 19
3.2 NRETBETWEEN ADONOR-ACCEPTORPAIR... 21
4. QUANTUM DOT INCORPORATED POTASSIUM CHLORIDE MACROCRYSTALS ... 26
4.1 GROWTH OFCdTe QD EMBEDDEDKCl MACROCRYSTALS... 27
4.2 CHARACTERIZATION OFCdTe QD EMBEDDEDKCl MACROCRYSTALS... 29
4.2.1 Transmission Electron Microscopy Imaging... 29
4.2.2 X-Ray Diffraction Measurements ... 33
5. NONRADIATIVE ENERGY TRANSFER OF QD EMBEDDED MACROCRYSTALS ... 38
5.1 NRET SAMPLEPREPARATION... 39
5.2 OPTICALCHARACTERIZATIONRESULTS... 41
5.2.1 Photoluminescence Measurements... 41
5.2.2 Time Resolved Fluorescence Measurements ... 45
6. CONCLUSION ... 52
LIST OF FIGURES
Figure 2.1. A bulk semiconductor, which has continuous valence and conduction energy bands separated by its bandgap, is presented on the left, and a QD, which has discrete atomic-like energy levels dependent on the QD radius, is presented on the right. ... 6 Figure 2.2. A representation of the red-shifting emission of QDs as a result of increasing the diameter due to quantum confinement effect... 6 Figure 2.3. Synthesis apparatus required for CdTe QD synthesis... 11 Figure 2.4. Photoluminescence measurements of the synthesized QDs with varying sizes. ... 13 Figure 2.5. Absorption measurement. The transmitted light passing through the sample without being absorbed is collected by a detector. ... 14 Figure 2.6. Absorbance measurements of the synthesized QDs. ... 15 Figure 2.7. Fluorescence decay curves of green and red quantum dots. ... 17 Figure 3.1. Principle operation of NRET for organic donor (D) and acceptor (A) pair. The blue straight arrow denotes the excitation of donor from its ground state. The curved lines express the vibrational relaxations. The dashed lines which has the same color corresponds to the resonant transitions. NRET occurs with the help of these resonant transitions... 21 Figure 3.2. Relative orientation of the donor emission dipole and the acceptor excitation dipole. ... 22 Figure 3.3. Energy transfer efficiency as a function of the donor-to-acceptor distance. ... 23 Figure 3.4. Energy transfer and donor emission rates are illustrated. They provide the depopulation of carriers in the excited state in the donor molecule. ... 24 Figure 3.5. Fluorescence intensities of the donor and acceptor in the presence and absence of NRET... 25 Figure 4.1. Crystallization of QD embedded macrocrystals takes place in these
Figure 4.2. QD embedded macrocrystal powder... 28
Figure 4.3. Schematic of a transmission electron microscope. ... 30
Figure 4.4. Transmission electron microscope located in UNAM... 31
Figure 4.5. TEM image demonstrating the QD distributions inside the macrocrystal of KCl. ... 32
Figure 4.6. Transmission electron microscopy image of red QD embedded macrocrystals... 33
Figure 4.7. The path difference of rays causes constructive interference when the Bragg condition is met ... 34
Figure 4.8. XRD measurements of macrocrystals. In the labels, D is used for the presence of green QDs and its parameter defines the amount of green QDs compared to the number of green quantum dots in 1D (47.13 nmol) and A is used for the presence of red quantum dots and its parameter defines the amount of red QDs compared to the number of green QDs in 1D (47.13 nmol) ... 36
Figure 5.1. Spectral overlap between the donor emission and acceptor excitation used in the preparation of macrocrystals. ... 39
Figure 5.2. Encapsulated macrocrystals ready for NRET studies. ... 41
Figure 5.3. Macrocrystal thin films in the visible light. ... 42
Figure 5.4. Macrocrystal thin films under UV light... 42
Figure 5.5. (a-d) Photoluminescence of the donor emissions in the presence and absence of acceptors are presented. The labels on the right correspond to the relative donor amount inside the macrocrystals. ... 44
Figure 5.6. Fluorescence decays of the donors in macrocrystals (1D1A, 2D1A, 3D1A and 4D1A) consisting of both donors and acceptors. The donor amounts are proportional to the label of each decay and the acceptor amounts are equal to the donor amount inside 1× macrocrystal. The samples are excited at the wavelength of 530-550 nm according to their emission peak positions... 46 Figure 5.7. Fluorescence decays of the donors in macrocrystals (1D, 2D, 3D,
the label of each decay. The samples are excited at the wavelength of 530-550 nm according to their peak emission position. ... 46 Figure 5.8. Fluorescence decays of the acceptors in macrocrystals consisting of both donor and acceptor. The donor amounts are proportional to the label of each decay and the acceptor amounts are equal to the donor amount inside 1× macrocrystal. The samples are excited at the wavelength of 635-645 nm according to their peak emission position. ... 47 Figure 5.9. Fluorescence decays of the donors in macrocrystals in the presence and absence of the acceptors. The donor amounts are proportional to the label of each decay and the acceptor amounts are equal to the donor amount inside 1× macrocrystal (47.13 nmol)... 48 Figure 5.10. Lifetimes of the donors in macrocrystals in the presence and absence of the acceptors. The acceptor amount is equal to 47.13 nmol... 49 Figure 5.11. Energy transfer efficiency dependence on the donor amount. The acceptor amount is equal to 47.13nmol... 50 Figure 5.12. Correlation between the acceptor lifetimes and the donor amount. The acceptor amount is equal to 47.13 nmol... 51
LIST OF TABLES
Table 4.1. XRD peaks of sample 1D1A, prepared KCl crystals and corresponding planes ... 36 Table 5.1. Molar concentrations of QDs used in the preparation of macrocrystals ... 40 Table 5.2. The initial amounts of materials used to prepare macrocrystals. ... 40 Table 5.3. The donor and acceptor lifetimes and corresponding energy transfer efficiencies... 49
Chapter 1
Introduction
The renaissance of nonradiative energy transfer (NRET) started a half century after the first model introduced to explain NRET by Förster thanks to the recent advances in fluorescent materials, optical methods and devices. These advances improved the sensitivity, spatial resolution and distance range in NRET applications giving information about molecular distances, interactions, conformational changes in nanoscale [1]. The information obtained through NRET is advantageous because of its low-cost implementation, enabling rapid measurement and allowing observing changes in distances.
Traditional fluorophores used in NRET applications have suffered from photostability, broad emission spectra and narrow absorption bands. Quantum dots (QDs), offer advantageous optical properties such as spectrally narrow and tunable emission, broad absorption, high quantum yields and higher photostability compared to traditional fluorophores with their high applicability for practical and economic processes, which make them attract great attention for NRET studies [2, 3]. Exhibiting very good optical features, and being suitable for common processes make QDs a great alternative to traditional fluorophores in NRET applications.
In the last decade, NRET employing QDs has been investigated extensively in many areas especially in biolabeling applications and energy funneling structures. Research has been mainly focused on the energy transfer in solution and layered solid structures of QDs fabricated by using practical processes. A very recent discovery, embedding QDs into macrocrystals (MCs) of various salts further enhanced the optical properties of QDs. In those structures, ionic crystal lattices surrounding QDs act as a shield against environmental conditions and improve robustness and photostability of QDs. Furthermore, high integration capability using standard encapsulants is realized without quenching photoluminescence of QDs [4]. Additionally, quantum dot incorporated macrocrystals can be large-scale fabricated, powdered, and stored while sustaining advantageous optical properties of quantum dots.
In this thesis work, we focus on QD-incorporated macrocrystals that exhibit strong NRET and realize this on a large scale. Moreover, we investigate NRET analyses for these macrodimensional structures for the first time.
1.1 Motivation
As it is stated in the previous section of the chapter, a wide variety of NRET based applications are developed in parallel to recent technological advances. One of the important advances is related to fluorescent materials. QDs replace traditional fluorophores in NRET applications because of their unique optical properties including spectrally narrow and tunable emission bands, broad absorption bands, high quantum yields, and higher photostability compared to traditional fluorophores.
In this thesis, we study the energy interactions of QDs inside a new structure called macrocrystal where QDs are randomly distributed and fully protected by
Within the framework of this thesis, the incorporation of QDs into salt macrocrystals is analyzed. The QD and ionic salt concentrations are tailored to improve the photoluminescence of the acceptor QD via nonradiative energy transfer in macrodimensional crystals. The analysis of the macrocrystal is quite different since QDs are placed neither in an arranged way as in graded structures nor homogenously as in liquids. We examine how the random distributions of QDs inside a new medium affect NRET processes and how to obtain the optimum NRET efficiency of those NRET structures.
1.2 Thesis Structure
This thesis consists of five chapters. The organization of the thesis is as follows: In Chapter 1, we introduce the development and benefits of the nonradiative energy transfer and its applications. We explain our motivation behind the exciton transfer between QDs embedded in macrocrystals and the impact of this approach.
In Chapter 2, we review quantum dots. Their quantum mechanical effects are explained to provide a scientific background about their photophysical features. Their optical properties and characterization methods are discussed in the remaining of the chapter.
In Chapter 3, the nonradiative energy transfer is briefly introduced from a theoretical point of view by explaining its characteristics and important parameters. The calculations of energy transfer efficiency and rates along with critical distances are demonstrated.
In Chapter 4, we introduce a novel material system, the so-called QD embedded macrocrystals. We explain the preparation steps, characterization tools and analysis of the prepared samples employing these materials. Their crystal
In Chapter 5, we investigate the exciton transfer phenomena within the macrocrystal structure. The preparation methods are briefly described along with various concerns related to the crystallization process. Exciton transfer process is systematically studied using time-resolved fluorescence and steady state fluorescence measurements.
Finally, in Chapter 6, we conclude with a summary of the contributions of this thesis and remarks for future work.
Chapter 2
Colloidal Quantum Dots
The bandgap of a semiconductors is constant in bulk structures and only depends on the material characteristics [5]. On the other hand, colloidal quantum dots of semiconductors exhibit the extraordinary property of tunable energy bandgap using size effect. Moreover, their high quantum yield, high stability compared to traditional fluorophores, low-cost processability and fabrication, and broad absorption spectrum make them attractive for use in optoelectronic devices such as LEDs, photodetectors and solar cells [2, 3, 6, 7].
2.1 Physics of Quantum Dots
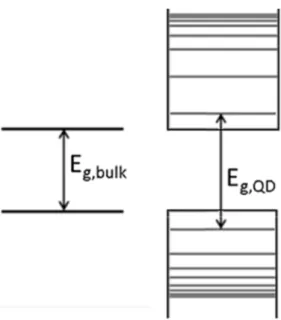
Quantum dots consist of a few hundred to a few hundred thousand atoms having certain crystal structures. In this small-size regime, quantum confinement effects start to be effective especially when the QD size is comparable to Bohr radius. The limited size of the crystals surrounded with materials having high bandgaps or vacuum lead to the formation of discrete energy levels, which changes the effective energy bandgap [8, 9]. The discrete energy levels of a quantum dot and the energy band structures are shown in Figure 2.1.
Figure 2.1.A bulk semiconductor, which has continuous valence and conduction energy bands separated by its bandgap, is presented on the left, and a QD, which has discrete atomic-like energy levels dependent on the QD radius, is presented on the right.
Size dependence of quantum confinement effects lead to changes in the energy bands gap of the quantum dots. This size dependence offers tunable electronic structure and optical properties including tuning emission and absorption wavelengths [7, 10]. The emission colors of various sized quantum dots are illustrated in Figure 2.2.
Figure 2.2.A representation of the red-shifting emission of QDs as a result of increasing the diameter due to quantum confinement effect.
To understand the size dependence of quantum confinement effects, we explain the quantum mechanical phenomena within quantum dots. The time independent Schrödinger Equation (Equation (2.1)) is given under a potential profile in general for a particle to discuss the quantum mechanical effect [11, 12, 13].
(2.1) (2.4) (2.3) (2.2) − 2 ∇ ( ) + ( ) ( ) = ( )
where is the reduced Planck constant, E is the eigen energy value, and Ψ is the wavefunction of the particle.
The time independent Schrödinger Equation is solved, setting the potential to zero. The solution is given in Equation (2.2).
( ) = ∙
where k is the wavevector and N is the renormalization constant. The corresponding energy values are given in Equation (2.3)
( ) = 2
Due to the crystal lattice, the particles confront a periodic potential. For a periodic potential, Bloch’s theorem states that wavefunctions (Equation (2.4)) are the product of a plane wave and a periodic Bloch function ( ) which has the same periodicity as the crystal lattice [11, 13, 14]:
( ) = ∙ ∙ ( )
When the dot sizes become comparable with or smaller than the exciton Bohr radius, the carriers are confined in the particle due to the presence of the boundaries.
Similarly, quantum confined wavefunctions can then be expressed as the product of the periodic Bloch function and an envelope function, which describes the restricted motion of particles in the sphere due to boundaries,
(2.5)
(2.6)
(2.7)
(2.8) presented in Equation (2.5) where the envelop function, ∅ ( ,∅, ), is the solution of the Schrödinger Equation [11].
( ) = ∅ ( ,∅, ) ∙ ( )
Here quantum mechanical calculations for a particle in a sphere model will be useful. In this model, assuming that an infinitely high potential barrier exists outside the sphere and defines the boundary condition, the particle can only exist inside the sphere. The spherical potential well of a radius a is defined as in Equation (2.6) [11, 12]:
( ) = 0 ≤
∞ > .
Because of the spherical symmetry of this potential, the wavefunctions are expected to be spherically symmetric as well. When the Schrödinger equation is solved using polar coordinates, the product of radial Bessel function, , ( )
(nth zero of the lth order), and the spherical harmonic function of degree ℓ and order m, ( ,∅) are obtained as the wavefunctions (Equation (2.7)) for a particle in a sphere considering boundary conditions [11]:
∅ ( ,∅, ) = , ( ) ( ,∅)
By considering boundary conditions, the allowed energy levels are discrete , ,
and , , are the roots of Bessel functions stated above. With quantum
numbers, n and l, these roots describe the orbitals and the energy is strongly dependent on the dot size due to the k dependence over radius and given in Equation (2.8) [11]:
(2.9)
(2.10) Coulomb attractions are also considered in small crystallites since electron and holes might form excitons, bound states, which have slightly less energy than the bandgap when they are close enough. By taking into Coulomb attraction, an additional Coulomb term is added due to the confinement energy, which is proportional to 1/R. As a result, the energy levels of quantum dots can be written in Equation (2.9) [11, 12]:
, = + 2 , ,∗ + , ,∗ −
1.8
The lowest electron-hole energy states are 1Sh1Se where , , = , , = /
(which corresponds to the smallest roots of Bessel functions used to solve Schrödinger Equations by applying boundary conditions) [13]. Hence, the optical bandgap of quantum dots can be written in Equation (2.10):
, = + 2 1 ∗+ 1 ∗ − 1.8
As it is shown in Equation (2.10), the effective bandgap of QDs is strongly dependent on their size. As a result, their emission peaks are shifted from blue to red as the QD diameter increases.
2.2 Synthesis of Colloidal Quantum Dots
The chemical synthesis of colloidal quantum dots is carried out mainly by making use of two methods. The first method is based on synthesis of quantum dots in a polar (aqueous) medium and the other method is the organometallic syntheses of various quantum dots. In this thesis, only the aqueous synthesis of colloidal quantum dots is used [15, 16].
In particular, this thesis work made use of CdTe QDs in aqueous medium and their synthesis is conducted as follows. The required chemicals include 4.59 g
cadmium perchlorate hexahydrate ( ( ) ∙ 6 ), 1.33 g (~1 mL)
thioglycolic acid (TGA), 0.8 g aluminum telluride (lumps), Milli-Q water, sodium hydroxide pellets, and 0.5 M sulfuric acid.
A typical synthesis of CdTe QDs in water stats with dissolving cadmium perchlorate hexahydrate in 250 mL Milli-Q water in a 1 L 3-neck flask, reaction flask with a magnetic stirrer. Stirring is continued throughout the synthesis. Next, 250 mL Milli-Q water and thioglycolic acid, which will serve as the ligand of QDs, are injected into the reaction flask and they are dissolved. Then, 1 M sodium hydroxide (NaOH) solution is prepared. To adjust pH around 11.8-12.0, sodium hydroxide are drop-wise added into flask slowly. Next, aluminum telluride ( ), which is very sensitive to oxygen, is put into a 25 mL 3-neck flask in an oxygen free medium.
The synthesis setup is assembled as represented in Figure 2.3. The connections prevent the oxygen, air or liquid entering inside the assembly.
(2.11)
Figure 2.3.Synthesis apparatus required for CdTe QD synthesis.
The oxygen dissolved in water is removed with Argon flow for one hour. Next, the absorption flask including 10% sodium hydroxide solution (NaOH) is connected to prevent harmful hydrogen telluride gas ( ) escaping into air. After argon flow decreases a little bit, sulfuric acid ( ) is injected via a syringe into the 25 mL flask drop wise. Hydrogen telluride gas comes out due to the reaction between aluminum telluride and sulfuric acid as shown in Equation (2.11). Hydrogen telluride gas is then transferred into reaction flask with argon flow for a half hour. The color of the solution turns to pinkish.
+ 3 →3 + ( )
Next, the 25 mL flask is detached from the reaction flask and the reaction flask is heated with a heating mental and the chiller is turned on to condense water vapor. When it started to boil, quantum dot growth starts. The QD growth is very fast at the beginning of the reaction and slows down as the time proceeds.
The size of the quantum dots and correspondingly their optical properties can be tailored by controlling the reaction time. At the end of the first minute after the reaction starts, the resulting emission peak is blue. After 5-10 minutes, the emission peak shifts to green and to red later on. When the desired emission wavelength is reached, the reaction must be ended with a rapid cooling after the heating is stopped. After the reaction stops, quantum dots are filtered and cleaned by centrifuging them at 4500 rpm for 5 min. To increase the molar concentration of the quantum dots, size selective precipitation and evaporation of the water are carried out.
2.3 Characterization of Colloidal Quantum Dots
Optical properties of quantum dots depend on their size. To reach desired properties, controlling the size of quantum dots is crucial. To obtain information about the dimension and fluorescence properties of the quantum dots, the photoluminescence, absorbance, quantum yield and time resolved spectroscopy measurements are conducted.
2.3.1 Photoluminescence Measurements
Since the emission wavelength of the quantum dots are tailored by the quantum dot size, the emission profile is strongly correlated with their size distribution. Hence, the photoluminescence of QDs provides information about their size and its distribution.
During the colloidal synthesis of QDs, a nonzero size distribution of QDs is inevitable. A narrow size distribution of quantum dots translates into a narrow full width at half maximum of the emission profile. Hence, photoluminescence measurements give information about the size and monodispersity of quantum dots.
Figure 2.4.Photoluminescence measurements of the synthesized QDs with varying sizes. As it can be seen in Figure 2.4, the emission peak shifts towards red from sample A to E. The monodispersity of QDs is the highest for sample A compared to other QDs as the full width at half maximum values increases from 43 nm in sample A to 81 nm in sample E.
2.3.2 Absorbance Measurements
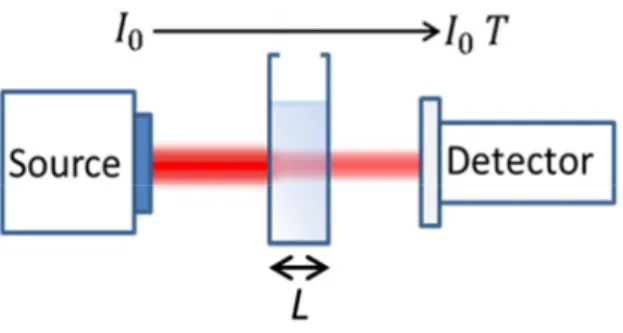
Absorbance is the logarithmic ratio of the amount of light absorbed in a sample as the light passes through the sample. In Figure 2.5, the absorbance of light is presented.
(2.12)
Figure 2.5.Absorption measurement. The transmitted light passing through the sample without
being absorbed is collected by a detector.
The absorbance is expressed in Equation 2.12. The transmittance (T) is the ratio of transmitted light intensity to the incoming light intensity [17, 18].
= = 1 = − ( )
Absorbance spectra are taken by measuring the absorbance over a wavelength range. QDs exhibit a broad absorbance spectrum covering from the energy level of the first excitonic state to higher energy states (shorter wavelengths) increasingly. An excitonic peak is observed in the absorbance profile corresponding to this first excitonic state [19].
(2.13)
(2.14)
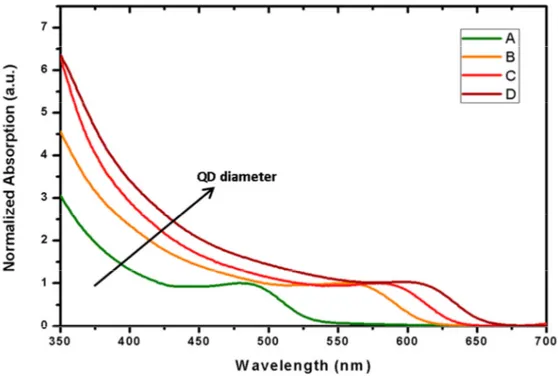
Figure 2.6.Absorbance measurements of the synthesized QDs.
The excitonic peak is also dependent on the particle size due to quantum confinement effect as it can be seen in Figure 2.6. It shifts towards red as the size gets bigger. The diameter (D) of CdTe QDs can be calculated by using empirical fitting functions and the wavelength of the first excitonic peak ( ) is given in Equation (2.13) [20]:
= (9.8127 × 10 ) − (1.7147 × 10 ) + 1.0064 − 194.84
The extinction coefficient can be calculated using empirical fitting functions [20] as presented in Equation (2.14)
= 10043 ( ) .
The Lambert-Beer’s Law describes that the molar concentration (C) can be calculated using absorbance (A), a molar extinction coefficient and the path length of the beam (L) as it is expressed in Equation (2.15) [17, 18, 20].
(2.15) =
2.3.3 Photoluminescence Quantum Yield Measurements
Fluorescence quantum yield of an emitter is calculated as the ratio of the number of emitted photons to the number of absorbed photons in solution measurements. For solutions, isotropic emission profiles can be assumed and a reference material whose quantum yield is known is used in the measurements. Rhodamine 6G in pure ethanol whose quantum yield is 95 % is commonly used as a reference sample. The absorbance spectrum of the reference sample and that of the quantum dots are measured with an intersection point, which has to be between 460-480 nm. Subsequently, both QD solution and the reference dyes are excited at the intersection wavelength of absorption. Since the quantum yield of the reference dyes is known, the quantum yield of the QDs can be found by relating the number of emitted by the QD sample and the reference dyes [21]. The quantum yield of green quantum dots is typically 8.15% for our geen QDs while our red QDs exhibit 19%.
2.3.4 Time Resolved Fluorescence Measurements
Fluorescence lifetime is a characteristic property of the material, although it can also be affected by the environment including the molecular interactions. This lifetime is defined as the time it takes for the population of fluorescent particles in the excited state to decay to 1/eth of its initial intensity after a pulse of excitation hits [22] .
The measured decay curves are modeled as the sum of multi-exponential decays [22, 23] as shown in Equation (2.16).
(2.17) The amplitude average lifetime is calculated by using Equation (2.17) [23]:
= + + + +
+ + + +
Amplitude coefficients and lifetime components are important characterization parameters used for both measured and original decay curves.
There are several processes for the relaxation of excited state electrons. These processes can be collected under two main processes called nonradiative and radiative transitions, having the decay rates and , respectively. The radiative rate constant is reciprocal to the intrinsic lifetime ( = ). The reciprocal of the sum of the rate constants is equal to total lifetime ( + =
) [22, 24].
Examplary fluorescence decay curves of green and red CTe QDs are given in Figure 2.7.
The black curves given along with the experimental data show the multi-exponential decay modeling of the emitters. The amplitude average lifetime of green quantum dots turns out to be 13.267 ns and the lifetime of red dots is 19.727 ns.
Time resolved fluorescence measurements give information about the emission dynamics of the emitters. By making use of the lifetime information, one can deduce the effects of complex media on the photophysical properties of the emitters. Within the framework of this thesis, we use the lifetime information to investigate the nonradiative energy transfer. When emitters donate their energy to nearby acceptors, the total decay rate of the donors is increased and thus their lifetime is shortened, while the opposite is observed for the acceptors.
Chapter 3
Fundamentals of NRET
Nonradiative energy transfer is a nano-scale nonradiative coupling mechanism providing energy flow from a donor to an acceptor via dipole-dipole interactions. This phenomenon is used in various systems to collect information about the molecular dynamics of the material, molecular distances, size and structural features of molecules. The systems benefiting from NRET offer many great properties such as enhanced sensitivity on detecting molecules even in very low concentrations and increased quantum yields of the fluorophores. Thanks to these advantages, NRET can be utilized in biological, medical and fluorescence applications [3, 25, 26].
3.1 Theory of NRET
NRET relies on the simultaneous excitation of an electron in the nearby acceptor from ground state when an excited electron on the donor emitter returns to the ground state due to the dipole-dipole interactions [27, 28].
close enough and oscillate at the same frequency, the resonance energy transfer may take place from the donor to the acceptor as in the case of coupled oscillators [18].
NRET occurs under some circumstances [29, 30]. First, the donor must be in the excited state and the acceptor must be in the ground state. Second, a spectral overlap between the emission spectrum of the donor and the absorption spectrum of the acceptor is required. Third, they need to be close enough.
The distance between the acceptor and donor pair must be comparable to the Förster radius to trigger the exciton transfer. Furthermore, the quantum yield of the donor, the matching between their orientations and the extinction coefficient of the acceptor must be sufficient.
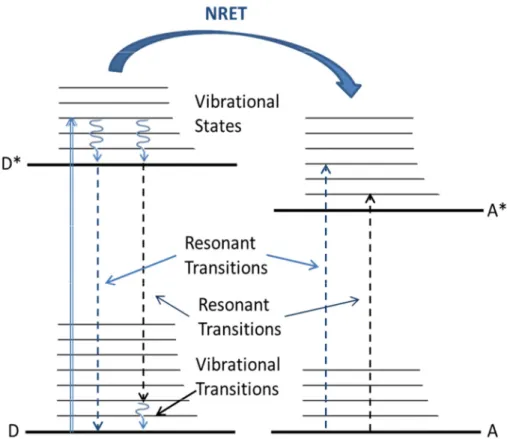
Figure 3.1 represents the principle process of NRET for an organic NRET pair. A high energy pump excites the donor molecule. Next, the excited carrier in the donor molecule has rapid vibrational relaxation towards to its band minima. Subsequently, thanks to dipole-dipole coupling with an acceptor molecule in the close proximity with the help of resonant transitions, the energy transfer occurs without emitting a photon. Finally, an electron is excited in the acceptor molecule from ground state as a consequence of exciton transfer.
(3.1)
Figure 3.1.Principle operation of NRET for organic donor (D) and acceptor (A) pair. The blue straight arrow denotes the excitation of donor from its ground state. The curved lines express the vibrational relaxations. The dashed lines which has the same color corresponds to the resonant transitions. NRET occurs with the help of these resonant transitions.
3.2 NRET between a Donor-Acceptor Pair
The Förster radius and energy transfer rate are two important characteristics of NRET. Förster radius ( ), or the critical distance, is expressed as the separation between the donor and the acceptor where NRET efficiency is 50%. In other words, at this distance the rate of transfer and decaying rate are equal. can be formulated in Equation (3.1).
= 9000(ln 10)к ( )
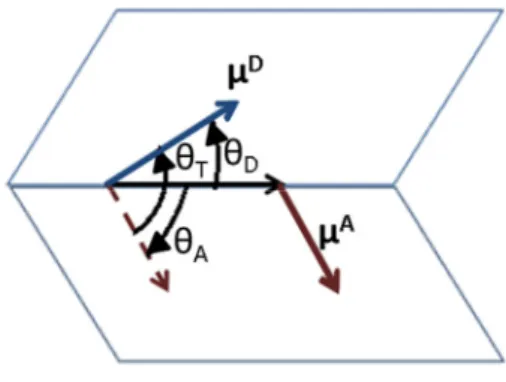
where к is the orientational factor, is the quantum yield of the donor, N is the Avogadro number, and n is the refractive index. J expresses the integral overlap between the normalized donor emission and acceptor absorption spectra. к is expressed in terms of the angle between dipole transitions of the donor and acceptor and the angle between the distance vector and the dipole transitions ( ). This describes the relative orientation of transition dipoles of the donor (μ D) and the acceptor (μ A) as shown in Figure 3.2.
Figure 3.2.Relative orientation of the donor emission dipole and the acceptor excitation dipole. In NRET calculations, it is assumed that к = 2/ 3, which is based on the dynamic random averaging of the donor and acceptor pairs [22]. This assumption is often supported by steady-state NRET measurements. The transitions are not parallel to each other for the multiple transitions in many frequently-used samples, which cause the effective к to be very close to 2/3 [30].
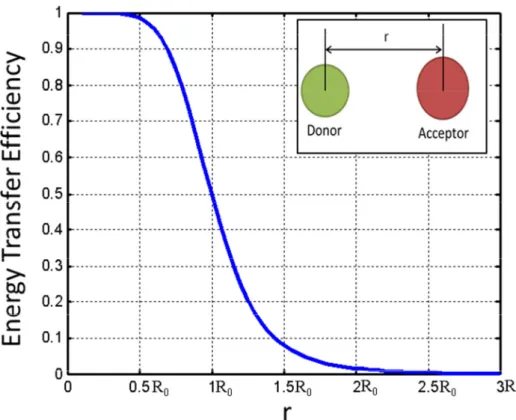
The importance of the characteristic distance stems from the fact that the energy efficiency changes dramatically around this point as shown in Figure 3.3. However, the energy transfer efficiency dependence on the distance is not as sensitive at the distances outside the range of 0.5 to 2 .
(3.2)
Figure 3.3.Energy transfer efficiency as a function of the donor-to-acceptor distance.
The spectral overlap between the donor emission and acceptor absorption is calculated according to Equation (3.2).
( ) = ∫ ( ) ( )
∫ ( )
where ( ) is the donor fluorescence intensity and ( ) is the molar extinction coefficient of the acceptor.
The energy transfer rate ( ) is expressed in terms of Förster radius ( ), the distance between the acceptor and donor molecules ( ), the donor lifetime in the
(3.3)
(3.4)
= 1
The efficiency of the energy transfer is defined as the ratio of energy transfer rate to the total sum of rates. The de-excitation pathways of carriers in the excited states in the donor are presented in Figure 3.4.
Figure 3.4. Energy transfer and donor emission rates are illustrated. They provide the depopulation of carriers in the excited state in the donor molecule.
The energy transfer efficiency changes depending on the competition between the transfer rate and the total recombination (radiative plus nonradiative recombination) decay rate as defined in Equation (3.4).
= ( )
+ ( ) =
( )
+ ( ) = +
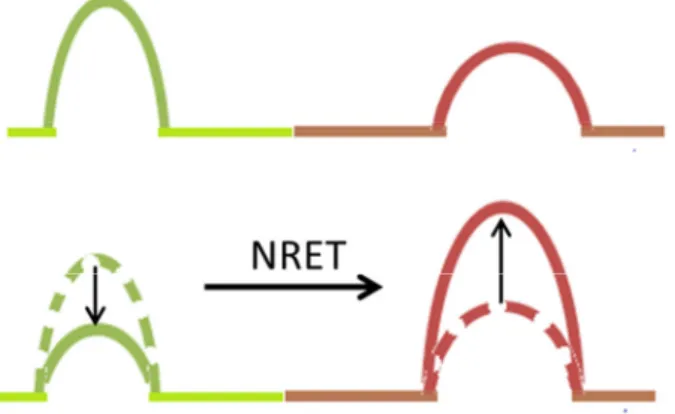
The nonradiative energy transfer causes donor lifetimes to be shortened since a new channel becomes available for the depopulation of the carriers in the excited state in the presence of acceptors in close proximity. This nonradiative de-excitation channel leads to a decrease in the donor emission and an increase
(3.5)
(3.6)
Figure 3.5.Fluorescence intensities of the donor and acceptor in the presence and absence of NRET.
The energy transfer efficiency can also be expressed in terms of lifetime and fluorescence intensity as it is given in Equation (3.5).
= 1 − = 1 −
where and are the fluorescence intensities of the donor in the presence
and absence of the acceptor, respectively, while and are the
corresponding lifetimes of the donor in the presence and absence of the acceptor.
Making use of energy transfer efficiency relation, the effective distance between the acceptor and donor can be formulated inversely by using the measured lifetime and fluorescence intensity levels of samples as expressed in Equation (3.6).
= 1 − =
Chapter 4
Quantum Dot Incorporated
Potassium Chloride Macrocrystals
Colloidal QDs offer extraordinary photophysical properties including narrow, tunable photoluminescence, and high quantum yields. [31, 32]. However, they suffer from robustness, low-scale fabrication, compatibility with encapsulants and integration problems. Embedding quantum dots (QDs) into conventional salt crystals provides these nanocrystals with superior optical and physical properties. When QDs are incorporated into ionic salt crystals, surrounding salt molecules in the crystal protect QDs from environment. Hence, they provide high robustness, photo- and chemical-stability, macrodimensional fabrication and processability [4]. Furthermore, the improved compatibility with silicone and recent encapsulation techniques prevent the deterioration of the photoluminescence of quantum dots.
In this thesis study, potassium chloride (KCl) is used as an ionic salt for the preparation of macrocrystals since CdTe quantum dots are well suited to crystalline structure of potassium chloride. However, ionic salts like sodium
chloride, potassium bromide, alum and Epsom can also be used as the host crystals for embedding quantum dots.
4.1 Growth of CdTe QD Embedded KCl Macrocrystals
In the preparation of macrocrystals, the crystallization time, amount of the solutions, the shape and volume of the container and several other factors are considered. The amount of the QD solutions changes optical properties of the macrocrystals. The amount of saturated salt solutions defines the total volume of the resulting macrocrystals. The large flat containers decrease the crystallization time and increases the uniformity.
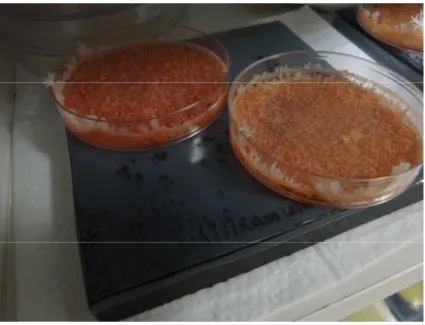
Saturated potassium chloride solution is prepared in a large volume for the consistency between different samples prepared at different times. The amount of the QDs is determined by controlling their initial concentration. First, ca. 5 mL potassium chloride solution is put into a centrifuge tube. Then, a specified amount of QD solution is added in to salt solution. The mixture is stirred for a while and poured into a container as a 2-mm-thick sheet of solution spans on the container surface. The evaporation of water in the container causes the crystallization of QD embedded macrocrystals of salts (Figure 4.1).
Figure 4.1.Crystallization of QD embedded macrocrystals takes place in these containers with the evaporation of water.
The prepared macrocrystals are milled with a mortar and a pestle to create powder, which is used for the sample preparation. The powder macrocrystals are stored in small vials to be used later as presented in Figure 4.2.
4.2 Characterization of
CdTe
QD Embedded
KCl
Macrocrystals
The amount and size of quantum dot compounds and environmental factors can affect crystallization of macrocrystals. Hence, transmission electron microscopy and X-ray diffraction measurements are used to confirm the crystalline structure of MCs. On the other hand, the fluorescence properties of macrocrystals depend also on the type and amount of QDs used. However, surrounding atoms around QDs cause small changes in the optical properties of MCs. Hence, photoluminescence and time resolved spectroscopy measurements are utilized to analyze the optical properties of the QD incorporated MCs.
4.2.1 Transmission Electron Microscopy Imaging
Transmission electron microscopy is one of the most sophisticated tools used to characterize the crystal structure and microstructure of the materials. It gives the information about the crystal structure, surface features, composition, size and shape of the sample. [33].
The working principle of transmission electron microscopy is similar to optical microscopy. However, it makes use of electrons instead of photons due to their shorter wavelengths than photons. As a result, electrons provide a larger depth of field, a higher magnification and a better resolution for TEM compared to optical microscopes [34]. On the other hand, to benefit from electrons, the main components of the microscope are changed resulting in high complexity. First, an electron gun is used as an electron source for illumination. Second, electromagnetic lenses are used instead of optical lenses. The first condenser lens is used to change the spot size of the electron beam, the second condenser beam changes the spot size on the sample, the objective lenses focus the transmitted electron beam on the fluorescence screen for the image, and the projector lenses magnify the image. Third, the condenser and objective apertures
block high-angle electrons and help to change contrast. The main parts of the transmission electron microscope are shown in Figure 4.3.
Figure 4.3.Schematic of a transmission electron microscope.
The specimen is needed to be prepared to very thin and tiny to allow the transmission of electrons. The electrons passing through the specimen without any interaction lead appearance of brightness on the screen and the thicker parts of the specimen look darker since more atoms interact with the electrons and decrease the number of transmitted electrons [34].
Figure 4.4.Transmission electron microscope located in UNAM.
In this thesis work, we used TEM to investigate the crystalline structure of macrocrystals and the distribution of quantum dots embedded in the macrocrystals. To prepare specimen, we first have to obtain macrocrystals in smaller dimensions. To obtain smaller sizes, we put a little bit of powder into a nonpolar solvent (not to dissolve macrocrystals) and by using a probe sonicator, small macrocrystals is obtained.
Figure 4.5.TEM image demonstrating the QD distributions inside the macrocrystal of KCl. In Figure 4.5, this TEM image demonstrates that the quantum dots, which are seen as darker spherical regions, are incorporated into the crystal lattice of the salt crystal. The fringes show that the crystal planes cover the quantum dots. On the other hand, the distributions of quantum dots inside macrocrystals are observed to be varying inside the KCl matrix.
Figure 4.6.Transmission electron microscopy image of red QD embedded macrocrystals. In Figure 4.6, the white spots show the locations of quantum dots. The distribution of white stops exhibit that both quantum dots distributed inside the crystal and partly aggregated quantum dots appear in the crystallization process of the macrocrystals.
4.2.2 X-Ray Diffraction Measurements
X-ray is electromagnetic radiation whose wavelength is as short as the size of an atom or a few atoms (10 to 10 nm). When an X-ray beam hits a crystalline substance, scattering occurs and a unique diffraction pattern appears specific to
(4.1)
substances, the ray diffraction (XRD) patterns are like a fingerprint. Thus, X-ray diffraction measurements help the characterization of polycrystalline structures and identification of the compounds in the crystal structures. A simple model of the operation of XRD device is illustrated in Figure 4.7 [35].
The operation of XRD device is explained by Bragg’s law (Equation (4.1)), which is given by [36]:
= 2
where is the reflection order (usually taken as 1), is the distance between atomic layers, and is the X-ray incidence angle.
Figure 4.7. The path difference of rays causes constructive interference when the Bragg condition is met
The XRD measurements are based on the constructive interference which happens when the Bragg condition is met due to relative phase of the rays as a result of the path difference as presented in Figure 4.7. At these angles where Bragg condition is satisfied, the peaks appear. By using the Bragg’s law, inter-planar distances ( ) can be calculated. The experimental results will give
(4.2)
analyzing the intensity and angle of the peaks (where h, k and l are Miller indices) (Equation (4.2)) [36, 37].
, , =
√ + +
In this thesis work, we benefit from the X-ray diffraction pattern of macrocrystals to investigate the effects of embedded quantum dots. The XRD measurement results of the samples are given in Figure 4.8.
10 20 30 40 50 60 70 0 20000 40000 60000 80000 100000 120000 140000 160000 180000 200000 220000 240000 10 20 30 40 50 60 70 0 20000 40000 60000 80000 100000 120000 In te n s it y ( Co u n ts ) 2 KCl In te n s it y ( Co u n ts ) 2 1D1A 10 20 30 40 50 60 70 0 20000 40000 60000 80000 100000 120000 10 20 30 40 50 60 70 0 20000 40000 60000 80000 100000 120000 140000 160000 180000 200000 220000 240000 In te n s it y ( Co u n ts ) 2q o 2D1A In te n s it y ( Co u n ts ) 2 3D1A 10 20 30 40 50 60 70 0 20000 40000 60000 80000 100000 120000 140000 10 20 30 40 50 60 70 0 20000 40000 60000 80000 100000 120000 140000 In te n s it y ( Co u n ts ) 2 4D1A In te n s it y ( Co u n ts ) 2 1A 10 20 30 40 50 60 70 0 20000 40000 60000 80000 100000 120000 10 20 30 40 50 60 70 0 20000 40000 60000 80000 100000 120000 In te n s it y ( Co u n ts ) 2 1D In te n s it y ( Co u n ts ) 2 2D
Figure 4.8.XRD measurements of macrocrystals. In the labels, D is used for the presence of green QDs and its parameter defines the amount of green QDs compared to the number of green quantum dots in 1D (47.13 nmol) and A is used for the presence of red quantum dots and its parameter defines the amount of red QDs compared to the number of green QDs in 1D (47.13 nmol)
Experimental data presented in Figure 4.8 show the peak positions for our set of macrocrystals. To analyze experimental data, first the background is removed according to the Planck distribution. Then, the peak intensities and peak positions are analyzed. Table 4.1 lists the normalized peak intensity values and corresponding planes for the sample 1D1A according to the highest peak intensity.
Table 4.1.XRD peaks of sample 1D1A and KCl crystal and their corresponding planes
1D1A macrocrystals KCl crystals
2theta Intensity FWHM Planes 2theta Intensity FWHM
28.34 1000 0.0788 (2,0,0) 28.35 1000 0.06 28.43 60.2 0.0005 28.55 15.5 0.0788 28.57 10.4 0.0036 40.51 364.3 0.0788 (2,0,2) 40.47 23.5 0.1027 50.18 86.7 0.0788 (2,2,2) 58.63 80.4 0.0788 (4,0,0) 58.63 181.1 0.0765 58.8 7.4 0.015 66.37 115.1 0.0788 (4,0,2)
These data prove that embedding QDs within KCl crystals does not significantly affect its crystalline structure. We find out that the strongest peak posting corresponds to (200) plane. In addition to this, the results show that embedding quantum dots does not damage the crystalline structure of macrocrystals
10 20 30 40 50 60 70 0 20000 40000 60000 80000 100000 120000 10 20 30 40 50 60 70 0 20000 40000 60000 80000 100000 120000 In te n s it y ( Co u n ts ) 2 3D In te n s it y ( Co u n ts ) 2 4D
highest peak location and the location of other peaks do not change. The intensities of other peaks relative to the highest peak can change from sample to sample. The added dopants, quantum dots, crystallization time and environment affect the growth of macrocrystals and lead to variation on the growth rates of crystal in different planes.
Chapter 5
Nonradiative Energy Transfer of QD
Embedded Macrocrystals
Narrow and tunable emission, broad absorption band, high quantum yields, and practical fabrication processes of QDs make them attractive material systems for applications involving NRET [38]. However, they may suffer from robustness, and deterioration occurs due to their compatibility issues with encapsulants. Currently, macrocrystals promise improved photostability, robustness, and integration and enable macro-scale fabrication for quantum dots. Hence, they offer improvements in QD-based applications including NRET. Because of these advantages, macrocrystal samples are designed to benefit from energy transfer and enhance their emission capabilities by considering energy transfer considering the factors including the spectral overlap, quantum yield, extinction coefficient and distances between the quantum dots.
In the next sections of this chapter, the preparation and properties of macrodimensional NRET enhanced structure are explained and experimental results are presented.
5.1 NRET Sample Preparation
NRET sample preparations constitute of three main steps. The first step is selecting which QD solutions have to be increase the spectral overlap between donor emission and acceptor absorption while minimizing the spectral overlap of donor and acceptor. The photoluminescence and absorbance spectrum of donor and acceptor quantum dots are demonstrated in Figure 5.1.
Figure 5.1. Spectral overlap between the donor emission and acceptor excitation used in the preparation of macrocrystals.
As the spectral gap between donor and acceptor emission wavelengths increases, the crosstalk in the photoluminescence of the mixed sample at the emission peaks occur due to the emission tails. The crosstalk increases the complexity of optical measurements of NRET.
The second step is the determination of QD amount in the macrocrystal preparation. The initial concentrations of green and red QDs are given in Table
Table 5.1.Molar concentrations of QDs used in the preparation of macrocrystals
The initial amounts of QDs are determined to decrease the distance between the acceptor and donor and preventing precipitation of QDs in the crystallization process. Macrocrystals, which have different ratios of donor amount to acceptor amounts, are designed to increase the energy transfer efficiency. In Table 5.2, the initial amounts of quantum dots for a macrocrystal set are demonstrated. D and A are used for the presence of donor QDs and acceptor QDs, respectively. Their parameters define their relative amount with respect to the number of green quantum dots in 1D (47.13 nmol) sample.
Table 5.2.The initial amounts of materials used to prepare macrocrystals.
QD embedded macrocrystals are prepared by controlling the amount and
green QDs red QDs conc. (mol/L) 1.7756E-04 4.7130E-05
peak (nm) 518 630 green QD / red QD (g/r) ratio 3.7674 green QD (mL) red QD (mL) g/r ratio water (mL) KCl sol. (mL) 1D1A 0.265 1 1.00 0.796 5.000 2D1A 0.531 1 2.00 0.531 5.000 3D1A 0.796 1 3.00 0.265 5.000 4D1A 1.062 1 4.00 0.000 5.000 1A 0.000 1 0.00 1.062 5.000 1D 0.265 0 - 1.796 5.000 2D 0.531 0 - 1.531 5.000 3D 0.796 0 - 1.265 5.000 4D 1.062 0 - 1.000 5.000 green QDs red QDs conc. (mol/L) 1.7756E-04 4.7130E-05
peak (nm) 518 630 green QD / red QD (g/r) ratio - 3.7674 green QD (mL) red QD (mL) g/r ratio water (mL) KCl sol. (mL) 1D1A 0.265 1 1.00 0.796 5.000 2D1A 0.531 1 2.00 0.531 5.000 3D1A 0.796 1 3.00 0.265 5.000 4D1A 1.062 1 4.00 0.000 5.000 1A 0.000 1 0.00 1.062 5.000 1D 0.265 0 - 1.796 5.000 2D 0.531 0 - 1.531 5.000 3D 0.796 0 - 1.265 5.000 4D 1.062 0 - 1.000 5.000
Chapter 4. Then, the prepared macrocrystal are milled with a mortar and a pestle. Subsequently, the specified amounts of powder macrocrystals are encapsulated by silicone. For the encapsulation, OE6630A and 0E6630B silicone solutions are mixed at the portion of 1:4. Around 50 μ L silicone mixture is put on a thin glass film with the dimensions of 8 mm×25 mm. Then 50 mg of the powders are added into silicone slowly by mixing continuously. Finally, the sample is heated around 80 C0to harden the silicone. A sample of encapsulated macrocrystals is shown in Figure 5.2.
Figure 5.2.Encapsulated macrocrystals ready for NRET studies.
5.2 Optical Characterization Results
Photoluminescence and time resolved fluorescence measurements are carried out to investigate the photophysical properties of the macrocrystals doped with green and red QDs. These methods give information whether NRET occurs or not and about the efficiency of this process.
5.2.1 Photoluminescence Measurements
The emission of the prepared macrocrystal samples is measured with photoluminescence spectroscopy. In the films employing exciton transfer, it is
becomes stronger due to the nonradiative energy transfer as it is explained in Chapter 3. Figure 5.3 and Figure 5.4 show the photoluminescence of the prepared macrocrystal samples in the visible light and under UV lamp. The labels of samples correspond to the initial relative amounts of the acceptor and donor inside the sample. As an illustration, sample 1D consists of only 1× 47.13 nmol donor (green QDs), sample 1A consists of only 1 × 47.13 nmol acceptor (red QDs), and 2D1A includes both 2×47.13 nmol donor and 1 × 47.13 nmol acceptor.
Figure 5.3.Macrocrystal thin films in the visible light.
Figure 5.4.Macrocrystal thin films under UV light.
However, small variations in the macrocrystal amount in the encapsulation process and uniformity of the prepared thin film affect the spectroscopy measurements. Hence, the photoluminescence measurements will be analyzed
(a)
(c)
(d)
In Figure 5.5, it is demonstrated that the donor emission decreases in the presence of the acceptors in the mixed macrocrystals compared to the pure donor macrocrystals. The nonradiative energy transfer from the donor to the acceptor has led to opening of nonradiative pathway for de-excitation of carriers in the excited states in the donor, which competes with the fluorescence. Hence, the donor emission decreases as it is shown in Figure 5.5. On the other hand, an enhancement in the acceptor emission is observed.
5.2.2 Time Resolved Fluorescence Measurements
After photoluminescence measurements for optical characterization, we obtained fluorescence decays and lifetimes using time resolved fluorescence spectroscopy as described in Section 2.3.4. Lifetimes and fluorescence decays are dependent on the material’s characteristics. However, molecular interactions affect the lifetime of the material. In these measurements, the changes in the molecular environment are prevented thanks to the encapsulation of the samples, taking measurements at the same time at the fixed temperature and fixed holder positions.
In Figure 5.6, the fluorescence decays of the donors in 1D1A, 2D1A, 3D1A and 4D1A macrocrystals consisting of both donor and acceptors are shown. In these samples, the same amount of acceptors exists while the donor amount increases from sample 1D1A to 4D1A. In Figure 5.8, the fluorescence decays of the acceptor inside the same samples and sample 1A, which includes only the acceptor, are depicted. In Figure 5.7, the reference samples (1D, 2D, 3D, 4D), which consist of only the donor, are also investigated and their fluorescence decays are presented.
Figure 5.6. Fluorescence decays of the donors in macrocrystals (1D1A, 2D1A, 3D1A and 4D1A) consisting of both donors and acceptors. The donor amounts are proportional to the label of each decay and the acceptor amounts are equal to the donor amount inside 1× macrocrystal. The samples are excited at the wavelength of 530-550 nm according to their emission peak positions.
Figure 5.7.Fluorescence decays of the donors in macrocrystals (1D, 2D, 3D, 4D) consisting of only the donor. The donor amounts are proportional to the label of each decay. The samples are
Figure 5.8Fluorescence decays of the acceptors in macrocrystals consisting of both donor and acceptor. The donor amounts are proportional to the label of each decay and the acceptor amounts are equal to the donor amount inside 1× macrocrystal. The samples are excited at the wavelength of 635-645 nm according to their peak emission position.
The macrodimensional structures are prepared and investigated under the same environmental conditions for consistency. Changes in lifetimes and fluorescence decays are observed as a consequence of the molecular interactions inside macrocrystals. These changes in the measured fluorescence decays reveal the occurrence of NRET. From the changes in lifetimes and decays, we observed that the donor lifetime decreases in the presence of acceptors, which suggests the occurrence of NRET. However, the decay curves exhibit that as the donor amount inside mixed macrocrystals increases, the corresponding lifetime changes at the donor emission peaks with respect to the reference sample decreases. The reference sample consists of the same amount of the donor but does not contain any acceptor to remove the effects of the presence of the acceptor in the close proximity, which leads to the nonradiative energy transfer. The experimental results are shown in Figure 5.9 and Figure 5.10.
Figure 5.9.Fluorescence decays of the donors in macrocrystals in the presence and absence of the acceptors. The donor amounts are proportional to the label of each decay and the acceptor amounts are equal to the donor amount inside 1× macrocrystal (47.13 nmol).
10
210
310
410
210
310
410
210
310
415
30
45
60
75
10
210
310
4P
h
o
to
n
C
o
u
n
t
P
h
o
to
n
C
o
u
n
t
P
h
o
to
n
C
o
u
n
t
with acceptor without acceptor1×
2×
P
h
o
to
n
C
o
u
n
t
with acceptor
without acceptor
3×
P
h
o
to
n
C
o
u
n
t
with acceptor
without acceptor
4×
P
h
o
to
n
C
o
u
n
t
Time (ns)
with acceptor
without acceptor
Figure 5.10. Lifetimes of the donors in macrocrystals in the presence and absence of the acceptors. The acceptor amount is equal to 47.13 nmol.
Lifetime changes in the donor emissions between the macrocrystals and their reference samples are used to calculate the efficiency of energy transfer as it is described in Section 2.3.4. The corresponding energy transfer efficiencies as a function of the donor amount are listed in Table 5.3 and shown in Figure 5.11.
Table 5.3.Donor and acceptor lifetimes and the corresponding energy transfer efficiencies.
(×47.13 nmol) LT (ns) Error (ns) LT (ns) Error (ns) LT (ns) Error (ns) (%) Error (%)
0 -- -- -- -- 6.31 0.22 --
--1 7.76 0.18 3.74 0.34 6.42 0.21 51.80 4.51
2 8.10 0.26 5.17 0.38 7.20 0.24 36.12 5.14
3 9.22 0.29 6.09 0.48 6.70 0.26 33.93 5.64
4 8.38 0.31 6.73 0.32 7.31 0.27 19.69 4.82
Donor Amount Donor Emission
with acceptor
Figure 5.11.Energy transfer efficiency dependence on the donor amount. The acceptor amount
is equal to 47.13nmol.
We observed that the efficiencies of NRET up to 51.8% are obtained inside these macrostructures. The decrease on the energy transfer efficiency is attributed to the decrease of the acceptor amount compared to donor amount since the exciton transferring QDs become minority as new donors are added. The acceptor lifetimes are shown in Figure 5.12. It is observed that the acceptor lifetimes do not significantly alter although the donor lifetime decreases.
It is also observed that the lifetime measurements taken from a different part of the same sample gives similar results. This points out that the large amount of donor and acceptor macrocrystals in film, powdering, and mixing reduce the effects of nonuniform QDs distribution inside MCs.