NOVEL NANOCRYSTAL-INTEGRATED
LEDs UTILIZING RADIATIVE AND
NONRADIATIVE ENERGY TRANSFER FOR
HIGH-QUALITY EFFICIENT LIGHT
GENERATION
A THESIS
SUBMITTED TO THE DEPARTMENT OF ELECTRICAL AND ELECTRONICS ENGINEERING
AND THE INSTITUTE OF ENGINEERING AND SCIENCES OF BILKENT UNIVERSITY
IN PARTIAL FULLFILMENT OF THE REQUIREMENTS FOR THE DEGREE OF
DOCTOR OF PHILOSOPHY
By
Sedat Nizamoğlu
March 2011
ii
I certify that I have read this thesis and that in my opinion it is fully adequate, in scope and in quality, as a thesis for the degree of Doctor of Philosophy.
Assoc. Prof. Dr. Hilmi Volkan Demir (Supervisor)
I certify that I have read this thesis and that in my opinion it is fully adequate, in scope and in quality, as a thesis for the degree of Doctor of Philosophy.
Prof. Dr. Ayhan Altıntaş
I certify that I have read this thesis and that in my opinion it is fully adequate, in scope and in quality, as a thesis for the degree of Doctor of Philosophy.
iii
I certify that I have read this thesis and that in my opinion it is fully adequate, in scope and in quality, as a thesis for the degree of Doctor of Philosophy.
Assoc. Prof. Dr. Oğuz Gülseren
I certify that I have read this thesis and that in my opinion it is fully adequate, in scope and in quality, as a thesis for the degree of Doctor of Philosophy.
Prof. Dr. İskender Yılgör
Approved for the Institute of Engineering and Sciences:
Prof. Dr. Levent Onural
iv
ABSTRACT
NOVEL NANOCRYSTAL-INTEGRATED LEDs
UTILIZING RADIATIVE AND NONRADIATIVE
ENERGY TRANSFER FOR HIGH-QUALITY EFFICIENT
LIGHT GENERATION
Sedat Nizamoğlu
Ph.D. in Electrical and Electronics Engineering Supervisor: Assoc. Prof. Dr. Hilmi Volkan Demir
March 2011
To combat environmental issues escalating with the increasing carbon footprint, combined with the energy problem of limited resources, innovating fundamentally new ways of raising energy efficiency and level of energy utilization is essential to our energy future. Today, to this end, achieving lighting efficiency is an important key because artificial lighting consumes about 19% of total energy generation around the globe. There is a large room for improving lighting efficacy for potential carbon emission cut. However, the scientific challenge is to reach simultaneously high-quality photometric performance. To address these problems, we proposed, developed and demonstrated a new class of color-conversion light emitting diodes (LEDs) integrated with nanophosphors of colloidal quantum dots. The favorable properties of these semiconductor nanocrystal quantum dots, including size-tuneable and narrow-band emission with high photostability, have provided us with the ability of achieving high-quality, efficient lighting. Via using custom-design combinations of such nanocrystal emitters, we have shown that targeted white luminescence spectra can be generated with desired high photometric performance, which is important for obtaining application-specific white LEDs, e.g., for indoors lighting, street
v
lighting, and LED-TV backlighting. Furthermore, dipole-dipole coupling capability of these semiconductor nanocrystals has allowed us to realize novel device designs based on Förster-type nonradiative energy transfer. By mastering exciton-exciton interactions in color-conversion LEDs, we have demonstrated enhanced color conversion via recycling of trapped excitons and white light generation based on nonradiative pumping of nanocrystal quantum dots for color conversion.
This research work has led to successful demonstrators of semiconductor nanocrystal quantum dots that photometrically outperform conventional rare-earth phosphor powders in terms of color rendering, luminous efficacy of optical radiation, color temperature and scotopic/photopic ratio for the first time.
Keywords: Light emitting diodes, solid state lighting, nanocrystals, quantum dots, color conversion, nonradiative energy transfer, exciton-exciton interactions.
vi
ÖZET
YÜKSEK KALİTELİ, VERİMLİ IŞIK ÜRETİLMESİ İÇİN
IŞINIMSAL OLAN VE OLMAYAN ENERJİ TRANSFERİ
KULLANAN, NANOKRİSTAL İLE TÜMLEŞTİRİLMİŞ
ÖZGÜN LED‟LER
Sedat Nizamoğlu
Elektrik ve Elektronik Mühendisliği Doktora Tez Yöneticisi: Doç. Dr. Hilmi Volkan Demir
Mart 2011
Artan karbon salınımı ile oluşan çevre sorunları ile birlikte sınırlı kaynaklardan dolayı ortaya çıkan enerji sorunu ile mücadele etmek için, enerji verimLiliğini ve enerji faydalanma düzeyini artıran yeni yolların bulunması enerji geleceğimiz açısından gereklidir. Günümüzde bu amaçla aydınlatma verimLiliği elde etmek özellikle önemLidir; çünkü bugün yapay aydınlatma dünyadaki toplam enerji üretiminin yaklaşık %19‟unu tüketmektedir. Potansiyel karbon salınımını azaltmak amacı ile aydınlatma etkinliğini iyileştirmek için geniş yer bulunmaktadır. Ancak, bilimsel zorluk, aynı zamanda yüksek kaliteli fotometrik performansa ulaşmaktır. Bu problemLerin çözümü için, yarıiletken kuvantum noktacıklarından oluşan nanofosfor ile tümLeştirilmiş yeni nesil ışık yayan diyotlar – LED‟ler önerdik, geliştirdik ve gösterdik. Yüksek ışık kararlılığı ile, boyutla ayarlanabilir ve dar-bantlı ışımaya sahip bu yarıiletken nanokristallerin olumLu özellikleri, yüksek kaliteli ve verimLi aydınlatma yeteneğine ulaşmamızı sağlamıştır. Nanokristal ışıyıcıların özel tasarım kombinasyonlarını kullanarak, yüksek fotometrik performansa sahip, uygulamaya özgü beyaz LED'leri (örneğin, iç aydınlatma, sokak aydınlatması ve LED –TV için) elde etmek üzere hedeflenen beyaz ışıma tayfını oluşturulabildiğini gösterdik.
vii
Ayrıca, bu yarıiletken nanokristallerin dipol-dipol etkileşim yetisi, Förster-tipi ışınımsal olmayan enerji transferine dayalı özgün aygıt tasarımLarı gerçekleştirmemize olanak verdi. Renk dönüşümLü LED‟lerdeki eksiton-eksiton etkileşimLerini kontrol altına alarak, tuzağa düşmüş eksitonlari geri çevrimi ile artırılmış renk dönüşümünü ve nanokristal kuvantum noktacıklarını ışınımsal olmayan pompalanmasıyla beyaz ışık üretimini gösterdik.
Bu tez araştırma çalışmaları, dünyada ilk defa yarıiletken nanokristal kuvantum noktacıklarının renk dönüşümü, ışıksal verim, renk sıcaklığı ve skotopik/fotopik oranı cinsinden fotometrik performans olarak bilinen eser fosfor tozlarını geçtiğini başarılı şekilde göstermiştir.
Anahtar Sözcükler: Işık yayan diyotlar, katı hal aydınlatma, nanokristal, kuvantum noktacıkları, renk dönüşümü, ışınımsal olmayan enerji transferi, eksiton-eksiton etkileşimleri
viii
Acknowledgements
During my PhD study at Bilkent I lived a beautiful story that is both technically and emotionally satisfactory. I had the opportunity to interact with many scientists around the world and I worked with many talented and smart people with a lot of fun. Advisors, teammates, colleagues, friends and family members had their unique and highly valuable contribution for this thesis in your hand. Therefore, I owe many thanks…
First, I would like to thank Prof. Hilmi Volkan Demir for being my advisor and mentor. It is for me a great honor and privilege being Prof. Hilmi Volkan Demir‟s graduate student. His kind, positive, friendly and warm personality and management embraced us, and his invaluable guidance, motivation, encouragement, confidence, understanding, and endless support made him more than a supervisor for me. He spreads his joy and positive energy to people around him. I learnt a lot from him and I hope I can apply them myself.
I owe my special thanks to thank Prof. İskender Yılgör for his endless support during my both undergraduate and graduate studies. When I had a problem, he always been there to advice and support. I felt very privileged because he came for my PhD thesis defence for a daily visit from Koç to Bilkent as a member of my thesis committee. I give my thanks to our department chair Prof. Ayhan Altıntaş for his support during my both undergraduate and graduate studies at Bilkent University. I would like to thank Prof. Ali Kemal Okyay and Prof. Ceyhun Bulutay for their valuable discussions during our PhD monitoring committee meetings. I give my thanks to Prof. Oğuz Gülseren for his useful comments and suggestions as a member of my thesis committee.
I would like to thank Prof. Mehmet Şahin for his warm and kind friendship and for his contribution to improve our quantum mechanical simulations. He felt me very honored and privileged because he came from Konya to Ankara to support
ix
me for my PhD thesis defense. I would like to thank Dr. Koray Aydın and Dr. Aşkın Kocabaş for their support, advices and friendship.
I would like to thank Prof. Efrat Lifshitz, her husband Prof. Ray Lifshitz and her co-workers for their great hospitality and support during our research visit in fall 2010 semester at Technion. I give my thanks to Prof. Alexander Eychmüller, Dr. Nikolai Gaponik, Dr. Stephen Hickey and Dr. Sameer Sapra for nanocrystal synthesis at Technical University of Dresden. I would like to thank Prof. In-Hwan Lee and Dr. Jong-Hyeob Baek from Korea for the growth of our epitaxial designs. I would like to also give my thanks to Prof. Xiaowei Sun for his support.
I want to thank to my lovely father Alican and my lovely mother Aynur, who raised me with great love, mercy and patience and who supported me in every moment of my life. I would like to thank my lovely sister İrem. She is both my sister and my sweaty child. She always gives her love to me and makes my life happy. I owe my thanks to all of my family members.
I would like to thank to my wife İrem. Her love is like a sun in my life. She always trusted me and supported me with great patience. I would like to thank my brother-in-law Emre Ünal, who is very special for me. He is always friendly, positive, considerate and kind. I also would like to thank my wife İrem`s parents Belğin and Fevzi. I owe my thanks to all of my wife`s family members.
During my graduate studies I had excellent office mates like my family members. I want to thank to my dear friend Evren Mutlugün, who was also my home mate at Bilkent. We have a great friendship and we had very nice days in research, courses and friendship. I give my thanks to Tuncay Özel, who was also my home mate at Bilkent. He is always kind, considerate and helpful, and he is also a very special friend of mine. With Evren and Tuncay we had very nice days during IEEE Photonics Society Annual Meeting in San Jose, research visit at Technical University of Dresden and workshop in Florence, Italy. I would like
x
to thank İlkem Özge Özel, who is very kind and positive. I owe my thanks to Rohat Melik, who is always helpful and friendly. I give my thanks to Emre Sarı, who is encouraging, kind and considerate. I would like to thank Evren`s wife Sümeyye, Tuncay`s wife Özge, Rohat`s wife Bahar and Emre`s wife Serpil for making my friends happy. I would like to thank Can Uran and Atilla Özgür Çakmak, who are very friendly, kind and considerate. I would like to thank our young teammates Talha Erdem and Burak Güzeltürk. When I needed help, they were with me and they were always kind, positive and respectful.
I want to thank to all current and former students and researchers supervised by Prof. Hilmi Volkan Demir. I would like to thank Nihan Kosku Perkgöz, İbrahim Murat Soğancı, Urartu Ö. Şeker, Pedro L. Hernandez, Özgün Akyüz, Ersin Doğan, Cüneyt Eroğlu, Onur Akın, Mustafa Akın Sefünç, Refik Sina Toru, Hatice Ertuğrul, Neslihan Çiçek, Veli Tayfun Kılıç, Sayim Gökyar, Kıvanç Güngör, Ahmet Fatih Cihan, Yasemin Coşkun, Shahab Akhavan, Yusuf Keleştemur, Aydan Yeltik, Togay Amirahmadov, Durmuş Uğur Karatay, Ozan Yerli, Mustafa Yorulmaz.
I owe my thanks to all professors, researchers, staffs and students in the Department of Electrical and Electronics Engineering, Department of Physics, Institute of Material Science and Nanotechnology (UNAM), Nanotechnology Research Center (NANOTAM) and Advanced Research Laboratory (ARL) at Bilkent.
Finally, I would like to acknowledge the generous support by European Technology Platform for Photonics21 Student Innovation Award, IEEE for Photonics Society Graduate Student Fellowship and SPIE for Scholarship Award in Optical Science and Engineering. This thesis work is supported by Turkish Academy of Sciences–Young Scientists Award Program, Scientific and Technological Research Council of Turkey (TUBITAK)–Department of Scientist Support, TUBITAK 110E0217, 110E010, 109E004, 109E002, 100E002, 107E297, 107E088, 106E020, 104E114, European Science
xi
Foundation–European Young Investigator Awards, European Science Foundation–European Cooperation in Science and Technology, European Countries Nanophotonics for Energy Efficiency Network of Excellence and Arçelik.
xii
Table of Contents
1. Introduction ... 1
2. Scientific background ... 5
2.1 General concepts and parameters about light sources ... 5
2.2 White light emitting diodes ... 15
2.3 Förster-type nonradiative energy transfer ... 19
3. Colloidal nanocrystal quantum dots ... 22
3.1 Introduction ... 22
3.2 Colloidal nanocrystal quantum dots for light emitting diodes ... 24
3.3 Synthesis ... 26
3.4 Quantum mechanical calculation of nanocrystal quantum dots ... 35
3.5 Measurement techniques ... 38
4. Superior white light emitting diodes hybridized with nanocrystal quantum dots for high photometric performance ... 44
4.1 Hybrid white-LEDs with high color rendering index utilizing color-converting combinations of nanocrystal emitters ... 44
4.2 Warm-white LEDs integrated with colloidal quantum dots for high luminous efficacy and color rendering ... 52
4.3 High scotopic/photopic ratio white-LEDs integrated with semiconductor nanophosphors of colloidal quantum dots ... 60
5. Hybrid white light emitting diodes integrated with exotic nanocrystal quantum dots ... 70
5.1 Multi-layered onion-like (CdSe)ZnS/CdSe/ZnS quantum-dot-quantum-well heteronanocrystals for investigation of their multi-color emission ... 70
xiii
5.2 Dual-color emitting quantum-dot-quantum-well CdSe-ZnS
heteronanocrystals hybridized on InGaN/GaN light emitting diodes for
high-quality white light generation ... 88
5.3 Tuning shades of white light with multi-color quantum-dot-quantum-well emitters based on onion-like CdSe-ZnS heteronanocrystals ... 97
6. Light emitting diodes based on NRET-enhanced color conversion ... 109
6.1 Nonradiative energy transfer in CdSe/ZnS core/shell nanocrystal solids enhances hybrid white light emitting diodes ... 109
6.2 Energy transfer enhanced color conversion using colloidal semiconductor quantum dots for solid state lighting ... 122
6.3 Quantum efficiency enhancement in nanocrystal solids using nonradiative energy transfer with optimized donor-acceptor ratio for hybrid white light emitting diodes ... 131
6.4 Green/yellow solid state lighting via radiative and nonradiative energy transfer involving colloidal semiconductor nanocrystals ... 141
7. Light generation based on NRET-conversion ... 156
7.1 White light generating nonradiative energy transfer from epitaxial InGaN/GaN quantum wells to colloidal CdSe/ZnS core/shell quantum dots ... 156
7.2 Efficient nonradiative energy transfer from InGaN/GaN nanopillars to CdSe/ZnS core/shell nanocrystals ... 168
7.3 Observation of efficient transfer from Mott-Wannier to Frenkel excitons at room temperature in a hybrid semiconductor quantum dot/polymer composite ... 183
8. Conclusions ... 195
8.1 Innovation and impact ... 198
xiv
List of Figures
Figure 2.1.1 CIE 1931 (x,y )chromaticity diagram [4]. ... 6
Figure 2.1.2 Spectral distribution of color matching functions [4]. ... 7
Figure 2.1.3 (x,y) chromaticity diagram showing the Planckian locus [4]. ... 9
Figure 2.1.4 (u`,v`) chromaticity diagram showing the Planckian locus [4]. ... 10
Figure 2.1.5 (u‟,v‟) Eye sensitivity function spectrum. ... 14
Figure 2.2.1 External quantum efficiency of light emitting diodes in visible [2]. ... 17
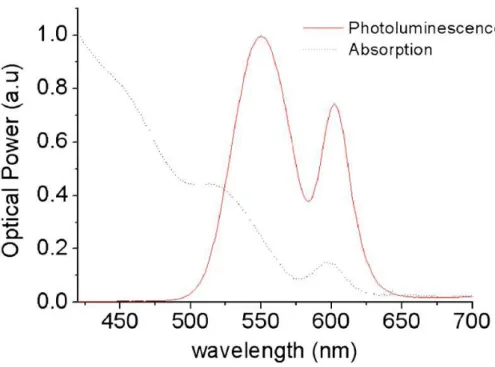
Figure 2.2.2 Photoluminescence spectrum of a phosphor [4]. ... 19
Figure 2.3.1 Dependence of the energy transfer efficiency on distance (R0 is the Förster distance). ... 21
Figure 3.1.1 Transmission electron microscopy (TEM) images of NC solid films, ... 22
Figure 3.1.2 (a) Photograph of nanocrystal quantum dots emission under UV light excitation and (b) spectral tuning of these dots while gradually changing their size. ... 23
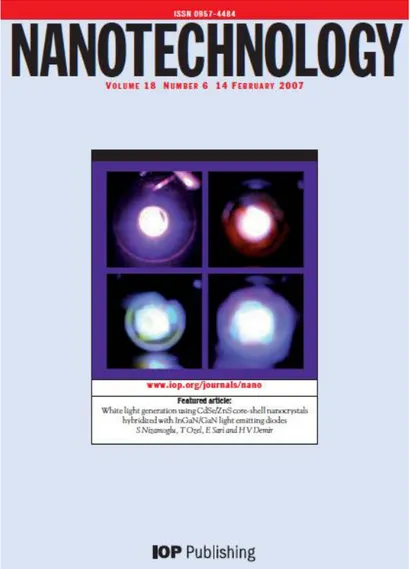
Figure 3.2.1 Our paper is highlighted as a featured article on the front cover of the journal Nanotechnology by Institute of Physics (vol. 18, no. 6 in the issue of 14 February 2007). ... 25
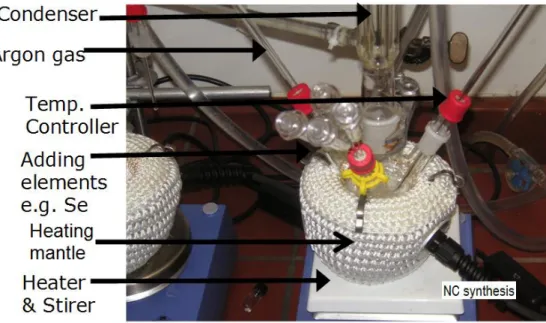
Figure 3.3.1.1 Photograph of nanocrystal synthesis flask equipped with condenser, temperature controller, heating mantle, and stirrer. ... 27
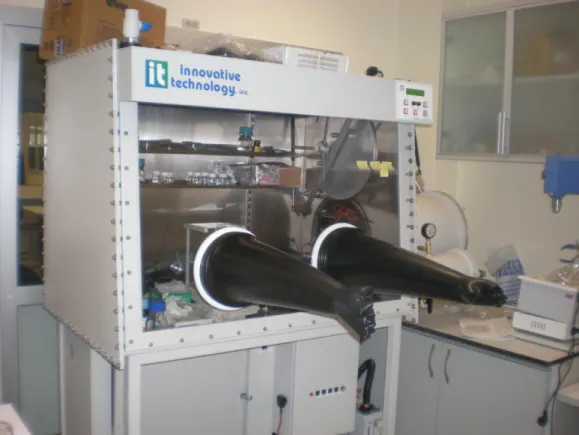
Figure 3.3.1.2 Photograph of glove box to work in oxygen-free environment. . 28
Figure 3.3.1.3 Absorption and photoluminescence spectra of our synthesized CdSe core nanocrystal quantum dots. ... 28
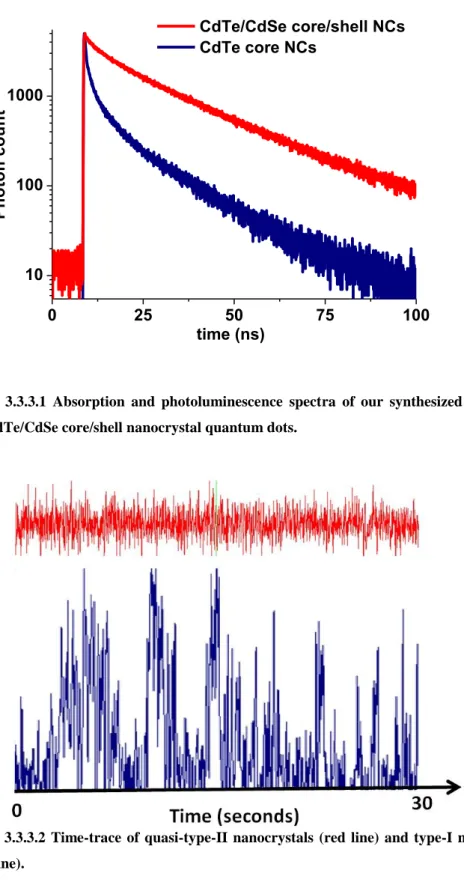
Figure 3.3.3.1 Absorption and photoluminescence spectra of our synthesized CdTe core and CdTe/CdSe core/shell nanocrystal quantum dots. ... 31
Figure 3.3.3.2 Time-trace of quasi-type-II nanocrystals (red line) and type-I nanocrystals (blue line). ... 31
Figure 3.3.4.1 Absorption photoluminescence and absorption spectra of onion-like (CdSe)ZnS/CdSe (core)shell/shell nanocrystals in solution. ... 33
xv
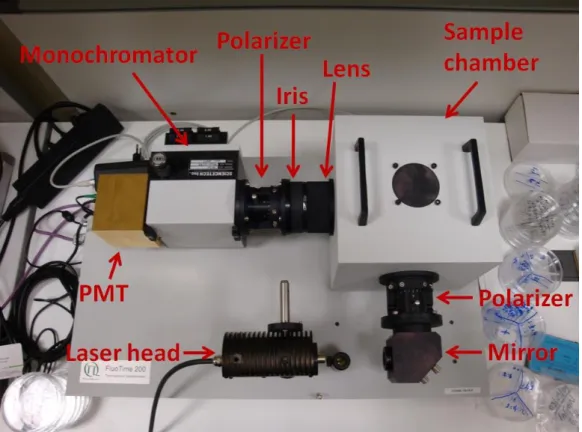
Figure 3.3.5.1 The photoluminescence spectrum of CdS surface state emitting nanocrystals in toluene solution. The corresponding (x,y) chromaticity coordinates and a photograph of the white light generated by these CdS nanocrystals in toluene solution under UV excitation are also provided in the inset. ... 34 Figure 3.3.5.1 Time-resolved measurement setup (FluoTime 200 spectrometer).
... 39 Figure 3.5.1.2 Instrument response function and full-width-at-half-maximum
(FWHM) of our time-resolved system. ... 39 Figure 3.5.4.1 A home-made quantum efficiency measurement setup. ... 42 Figure 3.5.5.1 A home-made electroluminescence measurement setup. ... 43 Figure 4.1.1 CIE chromaticity diagram zoomed-in for the loci of the tristimulus
coordinates of our nanocrystal-hybridized warm-white light emitting diodes (green points) along with the Planckian locus (blue line). A complete CIE 1931 chromaticity diagram, e.g., as in Ref. [4], is also given with the tristimulus coordinates of our hybrid warm-white light emitting diodes in the inset. ... 45 Figure 4.1.2 Luminescence spectra of our nanocrystal hybridized warm-white
light emitting diodes (Samples 1-3). ... 49 Figure 4.2.1 (a) Feasible sets of color rendering indices (CRI) vs. luminous
efficacy of optical radiation (LER) for WLEDs integrated with NC nanophosphors, and (b) color rendering indices of NC-integrated warm-WLEDs (WLED #1, #2 and #3) analyzed at different Munsell hues. ... 54 Figure 4.2.2 Electroluminescence spectra of the first NC-LED design (WLED
#1) integrated with green-, yellow- and orange-emitting CdSe/ZnS
core/shell NC nanophosphors on blue LED chips (λEL = 452 nm) driven at
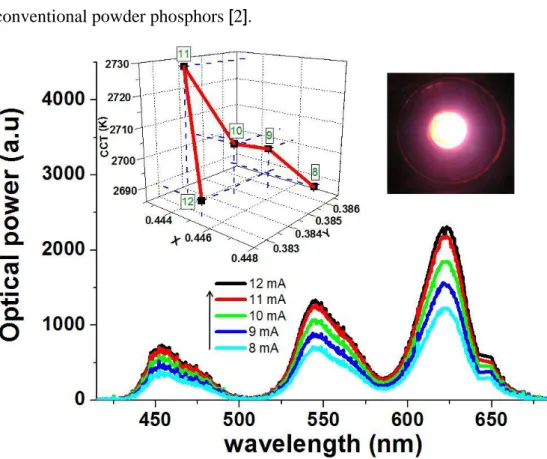
different levels of current injection at room temperature, along with the corresponding (x, y) coordinates vs. correlated color temperature (CCT) and a picture of NC-LED while generating white light (In the inset, the values given in the squares represent the current injection levels at that operating point.). ... 56
xvi
Figure 4.2.3 Electroluminescence spectra of the second NC-LED design (WLED #2) integrated with green-, yellow- and orange-emitting CdSe/ZnS
core/shell NC nanophosphors on blue LED chips (λEL = 452 nm) driven at
different levels of current injection at room temperature, along with the corresponding (x, y) coordinates vs. correlated color temperature (CCT) and a picture of NC-LED while generating white light (In the inset, the values given in the squares represent the current injection levels at that operating point.). ... 57 Figure 4.2.4 Electroluminescence spectra of the third NC-LED design (WLED
#3) integrated with green-, yellow- and orange-emitting CdSe/ZnS
core/shell NC nanophosphors on blue LED chips (λEL = 452 nm) driven at
different levels of current injection at room temperature, along with the corresponding (x, y) coordinates vs. correlated color temperature (CCT) and a picture of NC-LED while generating white light (In the inset, the values given in the squares represent the current injection levels at that operating point.). ... 58 Figure 4.3.1 Emission spectra of our nanocrystal integrated white LED
achieving a high S/P ratio of 3.05 at a CRI of 71.0 under various current injection levels at room temperature, along with its (x,y) tristimulus
coordinates on CIE 1931 chromaticity diagram and a photograph presented in the insets. ... 65 Figure 4.3.2 Scotopic/Photopic ratio versus color rendering index given for our
NC based single-chip white LED, also compared with common lighting technologies [2] (including LPS: low pressure sodium, HPS: high pressure sodium, WW: warm white fluorescent, TP70: tri-phosphor fluorescent (70<CRI<80), TP80: tri-phosphor fluorescent (80<CRI<90), INCAND: incandescent light bulb, MET HAL: metal halide (Thal/Dys/Hol) [10] and also a typical yellow phosphor based WLED [9]). ... 66 Figure 4.3.3 Lines of constant correlated color temperature on the (x,y)
xvii
The red star is the (x,y) tristimulus coordinates of the white LED shown in Figure 4.3.1. ... 68 Figure 5.1.1 Schematic of an onion-like (CdSe)ZnS/CdSe/ZnS
heteronanocrystal structure (with violet regions representing CdSe and green regions representing ZnS) along with the corresponding radial energy diagram (not drawn to scale). ... 73 Figure 5.1.2 2S relative probability distribution of electron
2 200 , ( )| |e r (in blue) and hole 2 200 , ( )| |h r
(in red) for n=2, l=0, m=0 states (with their peaks normalized to 1 for easy visualization) across the radial potential profile V(r) (in black) of the entire heteronanocrystal. On each plot, the
thicknesses of the inner ZnS shell (the first shell) and the CdSe shell (the second shell) in monolayers (e.g., x ML ZnS and y ML CdSe) are labeled as a pair (in the convention of x-y) in our notation. (For instance, 1-3 indicates (CdSe)ZnS/CdSe/ZnS heteronanocrystal with a 1-monolayer ZnS inner shell and a 3-monolayer CdSe shell.) ... 76 Figure 5.1.3 1S relative probability distribution of electron
2 100 , ( )| |e r (in blue) and hole 2 100 , ( )| |h r
(in red) for n=1, l=0, m=0 states (with their peaks normalized to 1 for easy visualization) across the radial potential profile V(r) (in black) of the entire heteronanocrystal. On each plot, the
thicknesses of the inner ZnS shell (the first shell) and the CdSe shell (the second shell) in monolayers (e.g., x ML ZnS and y ML CdSe) are labeled as a pair (in the convention of x-y) in our notation. (For instance, 1-3 indicates (CdSe)ZnS/CdSe/ZnS heteronanocrystal with a 1-monolayer ZnS shell and a 3-monolayer CdSe shell.) ... 78 Figure 5.1.4 The electron-hole spatial wavefunction multiplication (exciton)
distribution |e,n00(r)h,n00(r)| for n=1 (in red) and n=2 (in blue), l=0, m=0
states (with their peaks normalized to 1 for easy visualization) across the radial potential profile V(r) (in black) of the entire heteronanocrystal. On each plot, the thicknesses of the inner ZnS shell (the first shell) and the
xviii
CdSe shell (the second shell) in monolayers (e.g., x ML ZnS and y ML CdSe) are labeled as a pair (in the convention of x-y) in our notation. (For instance, 3 indicates (CdSe)ZnS/CdSe/ZnS heteronanocrystal with a 1-monolayer ZnS shell and a 3-1-monolayer CdSe shell.) ... 79 Figure 5.1.5 Theoretical energy level shifts of (CdSe)ZnS/CdSe/ZnS
heteronanocrystal for different thicknesses of the ZnS shell and the CdSe shell with respect to the mere core CdSe NC (a) without and (b) with taking the Coulomb interaction into account. ... 83 Figure 5.2.1 Luminescence spectra of onion-like (CdSe)ZnS/CdSe
(core)shell/shell heteronanocrystals hybridized on a blue light emitting diode driven at different levels of current injection at room temperature, along with a schematic structure of the heteronanocrystals (not drawn to scale) and a picture of the resulting hybrid NC-WLED while generating white light. ... 90 Figure 5.2.2 |ψelectron(r)|2 (in blue) and |ψhole(r)|2 (in red) show the probability
distribution of electron and holes in the (CdSe)ZnS/CdSe (core)shell/shell, respectively, while ψelectron(r)* ψhole(r) (in green) indicates the relative
spatial localization of excitons, with respect to the potential profile (in black): (a) for the ground state (n=1), and (b) for the first excited state (n=2). ... 94 Figure 5.3.1 Tuning shades of white light with multi-color
quantum-dot-quantum-well emitters made of onion-like CdSe/ZnS/CdSe core/shell/shell heteronanocrystals integrated on InGaN/GaN light emitting diodes (Hetero-NC-WLEDs 1-4) across CIE (1931) chromaticity diagram. ... 99 Figure 5.3.2 The tristimulus coordinates of electroluminescence from the blue
LED (L), the tristimulus coordinates of photoluminescence from the heteronanocrystals in solution (A), the tristimulus coordinates of the total emission from the integrated hybrid hetero-NC-LEDs (S3 and S4), and the effective tristimulus coordinates of the photoluminescence only contributed from the heteronanocrystals integrated on the blue LED for S3 and S4 (B
xix
and C, respectively), for the investigation of the resulting red shift (from A to B to C) across CIE (1931) chromaticity coordinates. ... 104 Figure 5.3.3 Emission spectra of our hybrid white light emitting diodes
(hetero-NC-WLEDs 1-4). ... 106 Figure 6.1.1 Time-resolved photoluminescence of (a) only small nanocrystal
solids (with a diameter of 7.7 nm) and mixed nanocrystal solids (with diameters of 8.2 and 7.7 nm) for emission at 550 nm, and (b) only large nanocrystal solids (with a diameter of 8.2 nm) and mixed nanocrystal solids (with diameters of 8.2 and 7.7 nm) for emission at 612 nm. ... 115 Figure 6.1.2 Photoluminescence spectra of only large nanocrystals (with a
diameter of 8.2 nm), only small nanocrystals (with a diameter of 7.7 nm) and mixed large and small nanocrystals (with diameters of 8.2 and 7.7 nm, respectively) and their absorption spectra are shown as an inset. ... 118 Figure 6.1.3 Emission spectra of mixed CdSe/ZnS core/shell nanocrystals (with
diameters of 8.2 nm and 7.7. nm) hybridized on n-UV InGaN/GaN light emitting diode driven at different levels of current injection at room temperature, along with the corresponding (x, y) coordinates and pictures of the hybrid WLED, while generating white light. ... 120 Figure 6.2.1 Investigation of full-width-half-maximum dependent color
rendering index and luminous efficacy change of optical radiation (∆LER) with respect to the case of 1 nm FWHM for ultra-efficient solid-state lighting (with power levels of 1/8 at 463 nm, 2/8 at 530 nm, 2/8 at 573 nm, and 3/8 at 614 nm). ... 125 Figure 6.2.2 Emission/absorption spectra of orange-emitting CdSe/ZnS
core/shell nanocrystals (acceptors) and emission of cyan-emitting
CdSe/ZnS core/shell nanocrystals (donors)... 126 Figure 6.2.3 Time-resolved spectroscopy measurements of the integrated
orange-emitting CdSe/ZnS core/shell nanocrystals (λPL=588 nm) and
hybrid cyan- and orange-emitting CdSe/ZnS core/shell nanocrystals (λPL=492 and 588 nm, respectively) on near-UV LED (λEL=379 nm) along
xx
temperature and picture of the hybrid NC-LED when electrically driven. ... 129 Figure 6.3.1 Nanocrystal donor-acceptor ratio dependent quantum efficiency
enhancement of the donor-acceptor hybrid solid films consisting of cyan- and green-emitting CdSe/ZnS core/shell nanocrystals. ... 135 Figure 6.3.2 Time-resolved photoluminescence kinetics of the only donor
nanocrystal solids and the donor-acceptor hybrid nanocrystal solids with 1:1 ratio at the donor emission wavelength of 500 nm. Time-resolved photoluminescence kinetics of the only acceptor nanocrystal solids and the donor-acceptor hybrid nanocrystal solids with 1:1 ratio at the acceptor emission wavelength of 550 nm are given in the inset. ... 137 Figure 6.4.1 Exemplary picture of a yellow hybrid light emitting diode while
emitting at 573 nm. ... 143 Figure 6.4.2 Epitaxial design of our near-UV InGaN/GaN light emitting diode.
... 146 Figure 6.4.3 L-I of our near-UV LED measured in an integrating sphere at room
temperature (with no heat sink or active cooling) along with its EL spectra and I-V given in the insets. ... 147 Figure 6.4.4 The emission and absorption spectra of green-emitting CdSe/ZnS
core/shell nanocrystals along with their photoluminescence picture given in the inset. ... 148 Figure 6.4.5 The total optical power of green NC (λPL=548 nm) hybridized on
near-UV LED (λEL=379 nm) at different levels of current injection at room
temperature (with no heat sink or active cooling), along with the emission spectra and picture of the hybrid NC-LED when electrically driven. ... 149 Figure 6.4.6 Time-resolved spectroscopy measurements of the integrated
green-emitting CdSe/ZnS core/shell nanocrystals (λPL=548 nm) and mixed cyan-
and green-emitting CdSe/ZnS core/shell nanocrystals (λPL=490 and 548
nm, respectively) on near-UV LED (λEL=379 nm). ... 151
Figure 6.4.7 The total optical power of mixed cyan- and green-emitting NCs (λPL=490 nm and 548 nm, respectively) hybridized on near-UV LED
xxi
(λEL=379 nm) at different levels of current injection at room temperature
(with no heat sink or active cooling), along with the emission spectra and picture of the resulting NRET-NC-LED when electrically driven. ... 154 Figure 7.1.1 Luminescence spectrum of our hybrid system improved by using
non-radiative energy transfer pumping of red-emitting CdSe/ZnS core/shell nanocrystals (λPL= 650 nm) by cyan-emitting InGaN/GaN quantum wells
(λPL= 490 nm), along with the corresponding (x,y) tristimulus coordinates,
the pictures of the cyan emitting wafer, red-emitting nanocrystals and white emitting hybrid system, and hybrid system structure while generating white light. ... 159 Figure 7.1.2 (a) Epitaxial structure of our cyan-emitting wafer (not drawn to
scale), (b) X-ray diffraction measurement (XRD) of the grown wafer, and (c) photoluminescence of the wafer around at 490 nm excited at 325 nm. ... 160 Figure 7.1.3 (a) Transmission electron microscopy image and (b)
photoluminescence of the nanocrystals excited at 325 nm with absorption and luminescence photograph as given in the inset... 161 Figure 7.1.4 Steady state emission spectrum of hybrid system (QWs+QDs)
improved by using non-radiative energy transfer pumping of red-emitting CdSe/ZnS core/shell nanocrystals (λPL= 650 nm) by cyan-emitting
InGaN/GaN quantum wells (λPL= 490 nm) with respect to the only
nanocrystals on quartz case (only QDs). The inset shows the 1931 CIE chromaticity diagram presenting the (x,y) operating point by using the combination of cyan-emitting wafer and red-emitting nanocrystals . ... 164 Figure 7.1.5 Time resolved spectroscopy measurement of hybrid system
consisting of quantum wells and nanocrystals together (QWs+QDs), only nanocrystals on quartz substrate (only QDs) and instrument response function (IRF) of the laser diode at 375 nm using a time-correlated single photon counting (TCSPC) system of PicoHarp 300 with a time resolution of 16 ps. ... 166
xxii
Figure 7.2.1 (a) Schematic representation of the nanopillar formation, (b) scanning electron microscopy image of fabricated InGaN/GaN multiple quantum well nanopillars, (c) x-ray diffraction measurement, and (d) photoluminescence spectra of both planar (blue line) and nanopillar (black line) structures. ... 173 Figure 7.2.2 Absorption and emission spectra of CdSe/ZnS core/shell
nanocrystal quantum dots (green-, yellow- and red-emitting ones). ... 174 Figure 7.2.3 MQW-NPs photoluminescence decay (at λ= 450 nm) without
nanocrystals. The dashed lines are the fits as described in text. Inset exhibits instrument response function and full-width-at-half-maximum (FWHM) of our time-resolved system. ... 175 Figure 7.2.4 MQW-NPs photoluminescence decay (at λ= 450 nm) with
red-emitting nanocrystals. The dashed lines are the fits as described in text. Inset exhibits steady-state photoluminescence spectrum of MQW-NPs with red-emitting nanocrystals. ... 178 Figure 7.2.5 MQW-NPs photoluminescence decay (at λ= 450 nm) with
yellow-emitting nanocrystals. The dashed lines are the fits as described in text. Inset exhibits steady-state photoluminescence spectrum of MQW-NPs with yellow-emitting nanocrystals. ... 179 Figure 7.2.6 MQW-NPs photoluminescence decay (at λ= 450 nm) with
green-emitting nanocrystals. The dashed lines are the fits as described in text. Inset exhibits steady-state photoluminescence spectrum of MQW-NPs with green-emitting nanocrystals. ... 180 Figure 7.3.1 Absorption and photoluminescence spectra of MDMO-PPV
homopolymer along with the PL spectrum of CdSe/ZnS core/shell
heteronanocrystals. Inset: TEM (transmission electron microscopy) image of the heteronanocrystal and chemical structure of the homopolymer... 186 Figure 7.3.2 Time-resolved spectroscopy measurement at the peak
heteronanocrystal emission wavelength (495 nm) for the hybrid composite system consisting of heteronanocrystals and homopolymers together (Samples 1-4), only nanocrystals on quartz substrate (only NCs) and
xxiii
instrument response function (IRF) of the laser diode at 375 nm using a time-correlated single photon counting (TCSPC) system of PicoHarp 300 with a time resolution of 32 ps at room temperature. The black lines are the fits as described in text. ... 188 Figure 7.3.3 Time-resolved spectroscopy measurement at the peak
homopolymer emission wavelength (585 nm) for the hybrid composite system consisting of heteronanocrystals and homopolymer together (Samples 1-4), only homopolymer on quartz substrate, and instrument response function (IRF) of the laser diode at 375 nm using a
time-correlated single photon counting (TCSPC) system of PicoHarp 300 with a time resolution of 4 ps at room temperature and the steady-state
photoluminescence from Samples 1 to 4 is given in the inset. The black lines are the fits as described in the text. ... 191 Figure 7.3.4 Calculated NRET efficiencies using the analytical model for
xxiv
List of Tables
Table 2.1.1 Light sources and their correlated color temperatures [4]. ... 10 Table 2.1.2 Color rendering indices of various light sources [4] ... 12 Table 2.1.3 CQS and CRI of the current technologies and simulated LEDs... 13 Table 2.1.4 Light sources and their S/P ratios [24]. ... 15 Table 3.4.1 Material parameters of CdSe and ZnS ... 38 Table 4.1.1 Optical properties of our nanocrystal hybridized warm-white light
emitting diodes. ... 51 Table 4.3.1 Photopic luminous efficacy of optical radiation (LER), S/P ratio
(S/P), relative brightness (RB), and relative nighttime vision (RNV) of two sources (where V(λ) is the photopic eye sensitivity function (for photon adapted vision), V′(λ) is the scotopic eye sensitivity function (for dark adapted vision), and E(λ) is the optical spectral power density). ... 64 Table 4.3.2 Amounts of integrated nanocrystals emitting at different colors
(given in nmol) for Sample A, B and C. ... 67 Table 4.3.3 Photometric properties of Sample A, B and C. ... 68 Table 5.1.1 1S electron-hole wavefunction overlaps e,100(r)|h,100(r) for
different numbers of monolayers of the ZnS shell in rows and the CdSe shell in columns at n=1 states. In parenthesis in each cell where overlap is presented, the thicknesses of the inner ZnS shell (the first shell) and the CdSe shell (the second shell) in monolayers (e.g., x ML ZnS and y ML CdSe) are indicated as a pair (in our notation of x-y.) (For instance, 1-3 represents (CdSe)ZnS/CdSe/ZnS heteronanocrystal with a 1-monolayer ZnS shell and a 3-monolayer of CdSe shell.) ... 81 Table 5.1.2 2S electron-hole wavefunction overlaps at n=2 states
e,200(r)|h,200(r)
for different numbers of monolayers of the ZnS shell in rows and the CdSe shell in columns. In parenthesis in each cell where overlap is presented, the thicknesses of the inner ZnS shell (the first shell) and the CdSe shell (the second shell) in monolayers (e.g., x ML ZnS
xxv
and y ML CdSe) are indicated as a pair (in our convention of x-y). (For instance, 3 represents (CdSe)ZnS/CdSe/ZnS heteronanocrystal with a 1-monolayer ZnS shell and a 3-1-monolayer CdSe shell.) ... 82 Table 5.1.3 Exciton binding energy due to the Coulomb interaction at n=1 states.
... 84 Table 5.1.4 Exciton binding energy due to the Coulomb interaction at n=2 states.
... 85 Table 5.1.5 Comparison of our theoretical PL peaks and the experimental PL
peaks for different CdSe and ZnS thicknesses for 2S transitions. ... 85 Table 5.2.1 Electron and hole wavefunction overlaps (<ψelectron(r)| ψhole(r)>),
their overlap squares (<ψelectron(r)| ψhole(r)>2), the exciton binding energy
due to their Coulomb interaction and the resulting optical transition
energies for the ground states (n=1) and for the first excited states (n=2). 93 Table 5.3.1 Photoluminescence peak wavelengths of the synthesized onion-like
CdSe/ZnS/CdSe heteronanocrystals in solution and in film (Samples 1-4). ... 101 Table 5.3.2 Photoluminescence relative peak intensities of the synthesized
onion-like CdSe/ZnS/CdSe heteronanocrystals in solution and in film (Samples 1-4). ... 101 Table 5.3.3 Photometric characteristics of our hybrid white hetero-NC-WLEDs
(1-4). ... 107 Table 6.1.1. The fitting parameters of time-resolved spectra in Figure
6.4.1(a)-(b). An and τn are the amplitudes and decay time constants, for n=1, 2, 3; τav
and τamp_av are the intensity and amplitude weighted average decay time
constants. ... 116 Table 6.3.1 The fitting parameters of time-resolved spectra presented in Figure
6.3.2(a)-(b). (An and τn are the amplitudes and decay time constants, for
n=1, 2, 3, respectively; τav and τamp_av are the intensity and amplitude
weighted average decay time constants.) ... 138 Table 6.4.1 Photometrıc properties of our color-converted NC-LED at various
xxvi
Table 6.4.2 The multiexponential fitting parameters for transient
photoluminescence decays in ... Figure 6.2.6 (An and n are the associated
amplitudes and decay time constants of multi-exponential decay fits to the experimental photoluminescence decay curves; n=1, 2.) ... 152 Table 6.4.3 Photometric properties of our color-converted NRET-enhanced
NC-LED at various current injection levels . ... 154 Table 7.1.1 The multiexponential fitting parameters to only nanocrystal on
quartz substrate (only QDs) and hybrid system consisting of quantum wells and nanocrystals together (QWs+QDs) by convolution of the laser diode source at 375 nm. ... 166 Table 7.4.1 The multiexponential fitting parameters of only heteronanocrystal
(only NCs) as the reference group and the hybrid composite systems consisting of both heteronanocrystals-homopolymers (Samples 1-4) at nanocrystal emission peak wavelength (λ=495 nm), presented along with their associated nonradiative energy transfer efficiency () and χ2. ... 189
xxvii
This thesis is dedicated to my parents
Alican and Aynur, my sister İrem and
my wife İrem for their love, patience
and support…
1
Chapter 1
Introduction
Today it is estimated that ~19% of the global electricity production is consumed for lighting [1]. If the entire conventional white light sources are to be replaced with energy-efficient light emitting diodes (LEDs), the total energy consumption can potentially be decreased by ca. 1,000 TW h yr–1, which corresponds to the power generation by 230 of typical 500-MW coal plants. This implies that carbon emission can possibly be cut by 200 million tons annually [2], [3]. Therefore, solid state lighting offers a potential solution to help addressing economical and environmental challenges we are now facing due to the energy problem. Furthermore, today approximately one third of the world population (about two billion people) have no or limited access to electricity and relies on fuel-based lighting in under-developed countries [1]. However, fuel-based lighting provides an unhealthy and costly means of illumination with low light quality. Thus, the advancement of LEDs (e.g., in self-powered packages using solar cells) is a key to the human development (e.g., for the improvement of literacy and education). To this end, this worldwide strong demand for the development of high-quality white LEDs (WLEDs) motivates our research work on the investigation of high-quality and efficient light generation presented in this thesis.
To date different approaches of solid state lighting for color-conversion WLEDs have extensively been investigated [4-6]. Among these, WLEDs based on conventional rare-earth phosphor powder coating were first commercialized in 1996 [7]. Such a color-conversion LED utilizes electroluminescence (EL) of the LED platform and photoluminescence (PL) of luminescent phosphor film integrated on this platform. Today although phosphors are commonly used as
2
color converters, there are problems associated with their usage [8]. These problems arise due to the difficulties in controlling granule size and in mixing and depositing uniform films of phosphors, which lead to undesired visible color variations as one of the main disadvantages. Also, the color rendering index of such phosphor-based color conversion can be undesirably low for high-quality lighting. For example, yellow phosphor-based white LEDs typically exhibit color-rendering indices of about 70, whereas the future solid-state lighting requirements dictate a color rendering index above 80 [9]. Although the peak emission of such phosphors can be shifted by substituting different chemicals (e.g., Gd for Y, Ga for Al) and red-emitting phosphor can be used for color temperature adjustment and color rendering index improvement, their broad-emission spectrum makes it technically impossible to fully tune and optimize the photometric properties of the generated white light at the same time, as is required to achieve optimal lighting conditions specific to particular applications (e.g., for indoors lighting, street lighting, and LED-TV backlighting). For instance, to improve color rendering, it is possible to use red phosphors; but, this comes at the cost of significantly reduced luminous efficacy (due to the emission tail above 650 nm). Therefore, conventional phosphors do not allow for optimal photometric design. In addition, China presently controls 95% of the rare-earth supply of the world, which raises a strategically critical issue for the supply security of phosphors in color-conversion LEDs.
As a possible remedy to overcome these disadvantages, we propose, develop and demonstrate a new class of color-conversion LEDs integrated with nanophosphors of semiconductor nanocrystals (NCs) for efficient and high-quality lighting [10], [11]. The favorable properties of colloidal quantum dots including size-tuneable and narrow emission with high photostability enable us to achieve high-quality, tuneable and efficient white light generation. By using combinations of these nanocrystal emitters the desired luminescence spectra can be obtained. This is essential for making application-specific LEDs.
3
Furthermore, Förster-type nonradiative energy transfer (NRET) capability of nanocrystals allows us to realize novel device designs. By using this energy transfer process, we achieve enhanced color conversion via recycling of trapped excitons in nanocrystals. Moreover, we show nonradiative pumping of nanocrystal quantum dots for color conversion. White light generation is generally achieved through only optical pumping (i.e., radiative energy transfer) that involves two recombination processes. The first radiative recombination process occurs in the electrically driven quantum wells of the LED and, subsequently, their emitted photons excite nanocrystal luminophors that further luminescence via a second radiative recombination process. Instead of two recombination processes, we investigate and demonstrate an efficient excitation of nanocrystals with a single-step process using nonradiative resonance energy transfer.
The rest of this thesis is organized as follows. In Chapter 2, we explain the scientific background to easily follow the technical content of this thesis. This includes the general concepts and parameters about light sources, white light emitting diodes, and Förster-type nonradiative energy transfer.
In Chapter 3, we discuss colloidal nanocrystals in general and then nanocrystal emitters for light emitting diode application. Furthermore, we explain synthesis of nanocrystals, quantum mechanical calculation of nanocrystals via effective mass approximation, and experimental techniques.
In Chapter 4, we continue with the investigation of superior white light emitting diodes hybridized with nanocrystal quantum dots for high photometric performance. Here we demonstrate three different light emitting diodes that exhibit high-quality photometric parameters. The first hybrid white LED achieves a high color rendering index higher than 80 while generating warm-white light for indoor lighting application. The second hybrid LED achieves the state-of-the-art photometric performance with a color rendering of around 90
4
while achieving a luminous efficacy of optical radiation higher than 350 lm/Wopt. In the last subchapter, we present energy-efficient light emitting diodes
with high scotopic/photopic ratio and color rendering index at the same time for street lighting, despite the fundamental trade-off between scotopic/photopic ratio and color rendering index.
In Chapter 5, we introduce white light emitting diodes integrated with exotic nanocrystal emitters. We first make quantum mechanical investigation of CdSe/ZnS/CdSe/ZnS core/shell/shell/shell nanocrystals (i.e., onion-like heteronanocrystals) to understand their multi-color emission and other optical properties. We hybridize these multi-color emitting nanocrystals on blue LEDs for tuning the optical properties of color-conversion LEDs.
In Chapter 6, we demonstrate LEDs enhanced with nonradiative energy transfer. We investigate the optimized donor-acceptor ratio for the highest possible efficiency enhancement by using recycling of trapped excitons. We further show light emitting diodes based on NRET-enhanced color conversion at different colors including green and red as well as white.
In Chapter 7, we study light generation based on NRET-conversion. For this we exhibit white light generation with nonradiative energy transfer from quantum wells to nanocrystal quantum dots. To enhance NRET-conversion we hybridize nanocrystals with multiple quantum well nanopillars and exhibit that energy transfer efficiency is increased to around 83%. Furthermore, we present efficient conversion from Mott-Wannier to Frenkel excitons at room temperature in a hybrid semiconductor quantum dot/polymer.
In Chapter 8, we conclude our thesis by describing and remarking our achievements.
5
Chapter 2
Scientific Background
2.1 General concepts and parameters about light
sources
2.1.1 (x,y) chromaticity coordinates
(x,y) tristimulus coordinates allow us to determine the perceived color of the
light source by the human eye by using the chromaticity diagram shown in Figure 2.1.1. In fact, the widely reported (x,y) coordinates consist of x, y and also the z coordinate values. However, since the z value is a dependent variable of x and y values, it is not given on a two dimensional chromaticity diagram and instead only x and y values are shown. The perceived color is determined by looking at the corresponding coordinates on the standard CIE (Commission Internationale d l‟Eclairage – The International Commission for Illumination) chromaticity diagram. CIE defines the international standards for color science, and chromaticity diagram and CIE 1931 color matching functions (shown in Figure 2.1.1 and 2.1.2, respectively) are the most widely used standards in both industrial production and scientific research [4]. However, it is also worth mentioning that the color matching functions are not unique, e.g., Judd and Vos [12], [13]. Each tristimulus value corresponds to an approximate response of red-, green-red-, or blue-sensitive retinal cones. Equations (2.1.1)red-, (2.1.2) and (2.1.3) are used to determine the strength of each perceived red, green and blue colors (i.e., X, Y and Z, respectively), where the x(), y() and z()are the color matching functions and P(λ) is the power spectral density.
(2.1.1) d P x X
( ) ( )6
(2.1.2)
(2.1.3)
Figure 2.1.1 CIE 1931 (x,y )chromaticity diagram [4].
The (x,y) and z chromaticity coordinates are calculated using Equations (2.1.4), (2.1.5) and (2.1.6), respectively. The color of the spectrum can be understood by looking at (x,y) coordinates on the chromaticity diagram. Furthermore, the z chromaticity value can also be obtained by using x and y coordinates as shown in Equation (2.1.6), but it does not provide any new information. The equal-energy point located in the center of the chromaticity diagram at (x, y, z) = (1/3,
d P y Y
( ) ( ) d P z Z
( ) ( )7
1/3, 1/3), but this operating point does not have a significant meaning in terms of quality and efficiency of LEDs.
Z Y X X x (2.1.4) Z Y X Y y (2.1.5) y x Z Y X Z z 1 (2.1.6)
400
500
600
700
0.0
0.5
1.0
1.5
2.0
x
y
z
C
o
lo
r m
a
tch
in
g
fu
n
cti
o
n
s x,y
,z
wavelength (nm)
Figure 2.1.2 Spectral distribution of color matching functions [4].
2.1.2 Color temperature
The relation between the color and temperature stems from the blackbody radiation and the black-body spectrum is given as follows [4]:
] 1 ) [exp( 2 ) ( 5 2 kT hc hc I (2.1.7)
8
The change in color is opposite natural human body change. For example, as we run, we get warmer and redder. However, the opposite is true for color temperature. As the color temperature decreases, the appearance shifts from bluish white, white, yellowish white, orange and red. This can be understood while a metal plate is heated, its heat increases and we observe its color first as red, then orange and finally as yellow.
The (x,y) tristimulus coordinates of the blackbody radiators form the Planckian locus as shown in Figure 2.1.3 and the color temperature of a light source is determined by looking at the coordinates of corresponding blackbody radiation temperature, whose unit is Kelvin. However, in Figure 2.1.3 the Planckian locus is only a small portion of (x,y) chromaticity diagram and there exist many operating points outside the Planckian locus. If coordinates of a light source does not fall on the Planckian locus, the correlated color temperature (CCT) is used to define the color temperature of the light source. CCT is calculated by transforming the (x,y) coordinates of the light source to (u‟,v‟) by using Equations (2.1.8) and (2.1.9), and by determining the temperature of the closest point of the Planckian locus to the light source on the (u‟,v‟) uniform chromaticity diagram shown in Figure 2.1.4 [4], [14]. To better visualize CCT, some light sources with their corresponding CCTs are provided in Table 2.1.1.
9
Figure 2.1.3 (x,y) chromaticity diagram showing the Planckian locus [4].
3 12 2 4 ' y x x u (2.1.8) 3 12 2 9 ' y x y v (2.1.9)
10
Figure 2.1.4 (u`,v`) chromaticity diagram showing the Planckian locus [4].
Table 2.1.1 Light sources and their correlated color temperatures [4].
Light source Correlated color temperature (K)
Wax candle flame 1,500 to 2,000 “Cool daylight white” flourescent tube 4,300
Xenon Arc 6,000
Direct sun 5,700-6,500 Clear blue sky 8,000-27,000
2.1.3 Color rendering index
Color rendering index (CRI) is the measure of how well a light source shows the true colors of the illuminated objects. CRI is a measure ranging from -100 to 100 [15]. The best color rendering index is 100, whereas the CRI of the poorest color rendition is -100. High CRI is required for museum, architectural lighting,
11
indoor lighting, etc., but for outdoor applications such as street lighting a lower
CRI is sufficient. For future SSL application Sandia National Laboratories
announced that LEDs should have CRI higher than 80 [9]. CRI of a test light source is a relative measure with respect to a reference light source, for which blackbody radiators with excellent CRI of 100 are used in general. The incandescent lamps, which are also blackbody radiators, have perfect color rendering capability. However, because of their high energy consumption their use has been or will be prohibited in some countries such as Canada, Australia, Europe, etc.
14 internationally agreed test color samples are used to measure CRI and these test color samples are defined according to their spectral reflectivity. The general CRI is calculated by using CIE test color sample objects from 1 to 8 [15]. The six CIE test color sample objects from 9 to 14 are used to further evaluate CRI of the test light source. For test light sources blackbody radiators with the same color temperature or correlated color temperature are used depending whether tristimulus coordinates of test light source is on the Planckian locus or not. Color rendering index is calculated according to the test color spectral reflectivity difference under the test light source illumination and reference light source illumination.
To determine the CRI of a test light source, in addition to the test-color samples, test color samples are needed. In international standardization, 14 test color samples has been agreed to measure the CRI, but the general CRI is an average calculated according to the 8 test-color samples with the following formula [4]:
8 1 8 1 i i general CRI CRI (2.1.10)The special color-rendering indices are calculated according to:
* 6 . 4 100 i i E CRI (2.1.11)
12
where Ei* is the quantitative color change that occurs when a test-color sample is illuminated with the reference source and then with the test source. The special CRI is 100 if there is no difference of the test-color sample in color under test and reference light source. Color rendering index of some light sources are indicated in Table 2.1.2.
Table 2.1.2 Color rendering indices of various light sources [4]
Light source Color rendering index Incandascent light bulb 100
Yellow-phosphor based LED 70-80
High pressure Na vapor light 22
Green light -50
2.1.4 Color Quality Scale
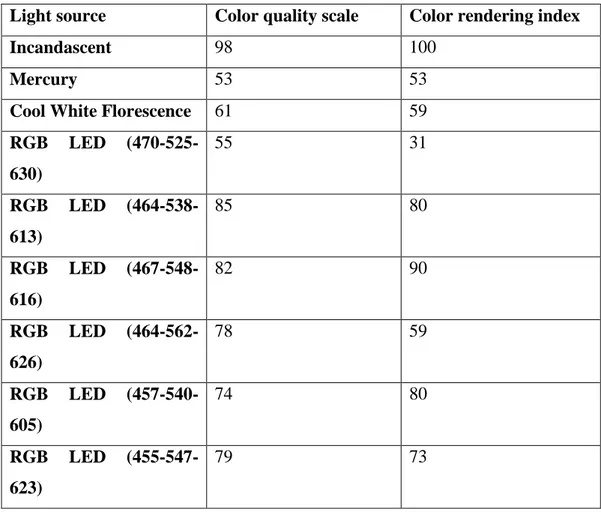
Recently a new color rendition metric of color quality scale (CQS) has also introduced by Davis and Ohno [16-18]. Although color rendering index is widely used in the lighting community, CQS also provides a scale for color rendering capability of various spectra. Similarly CQS is also based on the use of a reference light source like CRI. Different from CRI, CQS uses 15 reflective Munsell samples and it contains a saturation factor, which becomes effective when light sources enhance object chroma. In addition, CQS ranges from 0 to 100. CQS and CRI of the current technologies and simulated LEDs are analyzed and summarized in Table 2.1.3 [16-18]. According to the analysis, CQS results are in agreement with CRI results for traditional lamps and, for LED spectra there exists a higher difference between CQS and CRI. Ohno states that CQS is a better measure for color rendering of the LED sources [16-18]. Today CQS is not widely used by the lighting community, but in the future with further improvements it may be replace CRI.
13
Table 2.1.3 CQS and CRI of the current technologies and simulated LEDs
Light source Color quality scale Color rendering index Incandascent 98 100
Mercury 53 53
Cool White Florescence 61 59
RGB LED (470-525-630) 55 31 RGB LED (464-538-613) 85 80 RGB LED (467-548-616) 82 90 RGB LED (464-562-626) 78 59 RGB LED (457-540-605) 74 80 RGB LED (455-547-623) 79 73
2.1.5 Luminous efficacy of optical radiation and
luminous efficiency
Luminous efficacy of optical radiation (LER) of a light source represents the fraction of emission spectra useful for human eye and its unit is lumen per optical watt. It is calculated by using Equation (2.1.12) where where v(λ) is the eye sensitivity function (as shown in Figure 2.1.5) and Poptical(λ) is the power
spectral density (i.e., the light power emitted per unit wavelength) [4].
d P d v P W lm LER optical optical
) ( ) ( ) ( 683 (2.1.12)14 400 450 500 550 600 650 700 0.0 0.2 0.4 0.6 0.8 1.0 E y e s e n s it iv it y f u n c ti o n Wavelength (nm) Peak at 555 nm
Figure 2.1.5 (u’,v’) Eye sensitivity function spectrum.
In lighting community, luminous efficacy of optical radiation can be misused and confused with luminous efficiency (LE). LE reveals the strength of useful emission spectra for electrical power so that its unit is lumen per electrical watt.
LE can be calculated by multiplying LER by power conversion efficiency of
LED. This is given by Equation (2.1.13), where v(λ) is the eye sensitivity function, P(λ) is the power spectral density (i.e., the light power emitted per unit wavelength), I is the current injection level and V is the applied voltage level at the operating point of LED.
VI d v P W lm LE optical ) ( ) ( 683
(2.1.13)2.1.6 Scotopic/Photopic ratio
Experiments supported by the U.S. Department of Energy indicate that rod photoreceptors, which are considered to be responsible for scotopic (dark adapted) vision, may also affect photopic (photon adapted) vision [19]. These studies argue that the variation of pupil size strongly follows a scotopic-like
15
spectrum at interior lighting power levels [20-24]. According to these studies, it could therefore be possible to improve vision and lighting energy efficiency by accounting for the role of these rods, for example, in designing light emitting diodes. The figure-of-merit showing the rod activity under the illumination of a light source is quantified in terms of the ratio of eye response to the light source under the scotopic conditions to that in the photopic case, referred to as the scotopic/photopic (S/P) ratio of the source [25]. This difference in the scotopic and photopic luminous efficacy of the source results from the shift of eye sensitivity function peaking at 555 nm (under photopic lighting conditions) to 507 nm (under scotopic lighting conditions), also known as the Purkinje shift. The S/P ratio of a light source is calculated by using Equation (2.1.14), where
V(λ) is the photopic eye sensitivity function and V`(λ) is the scotopic one, and
the S/P ratio of some light sources are summarized in Table 2.1.4.
d V E d V E ) ( ) ( 683 ) ( ' ) ( 1700 S/P
(2.1.14)Table 2.1.4 Light sources and their S/P ratios [24].
Light source S/P ratio
Incandascent light bulb 1.40
Fluorescent (Cool White) 1.50
Daylight fluorescent 2.22
Mercury vapor (coated) 0.80
2.2 White light emitting diodes
Lighting poses an increasing market demand as one of the next great solid-state frontiers [26] and the new generation lighting systems are required to possess high-quality white light generation with high efficiency and color rendering, high power capability, low manufacturing cost, environmental friendliness and reliability. For that, white light emitting diodes (WLEDs) have attracted both
16
scientific attention and commercial interest with their potential widescale use, for example, in architectural lighting, decorative lighting, flashlights and backlighting of large displays [27]. To date, multi-chip WLEDs, monolithic WLEDs and color-conversion WLEDs have been extensively exploited [4], [5], [7].
2.2.1 Multi-chip white light emitting diodes
In multi-chip white light emitting diodes, LEDs with different colors are integrated together to generate the desired white light. For this purpose, InGaN based blue- and green-LEDs, and an AlGaInP based red-LED are jointly packaged [5]. The advantageous of these LEDs are color flexibility, both in multi-color displays and different shades of white and potentially very high color rendering. However, there exist also some drawbacks of these LEDs. Individual colored LEDs respond differently to drive current, operating temperature and operating time. Thus, control systems are required for color consistency and these leads to complex driving circuitry and increased expense. Furthermore, the low external quantum efficiency of LEDs at green wavelengths (shown in Figure 2.2.1) also negatively affects the performance of these white LEDs.
17
Figure 2.2.1 External quantum efficiency of light emitting diodes in visible [2].
2.2.2 Monolithic white LEDs
In monolithic white light emitting diodes, multiple quantum wells emitting at distinct wavelengths are used for white light generation. For example, Lee et al. demonstrated WLEDs including blue, green and amber InGaN/GaN quantum wells as the active layers. Monolithic WLEDs advantageously have simple circuitry and high color rendering index potential. However, these type of LEDs exhibit undesired temperature dependent white light parameters and show different emission spectra at different current injection levels [28].
2.2.3 White light emitting diodes based on color
conversion
The working principle of this type of white light emitting diodes is different from both the multichip and monolithic WLEDs. In multichip and monolithic WLEDs, color conversion relies on the electroluminescence originated from the active region of light emitting diodes, but LEDs based on color conversion
18
utilize both the electroluminescence originated from the active region of LED and photoluminescence of the color conversion layer. Furthermore, multichip and monolithic WLEDs are fully inorganic, but LEDs based on color conversion use both organic and inorganic materials. The working principle of these WLEDs is as follows: Electroluminescence in blue or near-ultraviolet is generated via current injection and this pumps integrated color conversion layer. Consequently the color conversion layer makes photoluminescence. As a result, the electroluminescence and photoluminescence collectively generates white light.
Materials including phosphors, dyes and polymers and can be used for the photoluminescent layer. For example, dyes and polymers can be used as color converter for white LED applications. They can be selected from violet to red colors. They have high quantum efficiencies in solution. They can be jointly used in epoxy resin. However, the drawback of these organic substances is their stability problem, which limits their use in LED application [4], [29], [30].
Today the current WLED market is dominated by the phosphors, especially phosphors with yttrium aluminum garnet (YAG). They exhibit high quantum efficiency (i.e., photon conversion efficiency approaching 100%). They can be easily hybridized on inorganic LEDs and are stable materials to be used in LED application. They provide a wide emission spectra covering from blue to deep-red shown in Figure 2.2.2. The optical characteristics of YAG phosphor with the chemical formula of (Y1-aGda)(Al1-bGab)5O12 : Ce can be shifted by substituting
Gadolinium (Gd) for Yttrium (Y), Gallium (Ga) for Aluminum (Al) and doping with cerium (Ce) [4]. For white light generation they can be both integrated on top of n-UV and blue LEDs. The spectral tunability is important to use WLEDs for the desired application; however, the main disadvantage of the phosphors is that the white light parameters cannot be sensitively tuned. Furthermore, the deep-red emission of the phosphors decreases the luminous efficacy of optical radiation due to the broad emission spectrum of phosphors.
19
Figure 2.2.2 Photoluminescence spectrum of a phosphor [4].
2.3 Förster-type nonradiative energy transfer
Förster-type nonradiative energy transfer is an important process for communication and energy transport at nanometer scales [31]. In living plants, this allows the transfer of energy from absorbing chlorophyll antenna complexes to the reaction centers. This nonradiative, directional and fast energy transfer has found many applications including medical diagnostics, bio-imaging, analysis of DNA, and recently in optoelectronics and nanophotonics [32].
Förster-type nonradiative energy transfer is a virtual photon process where excitation energy is nonradiatively transferred from an energy donor with wider band gap to an energy acceptor with narrower band gap. This incoherent process is the result of dipole–dipole interactions between the donor and acceptor, and takes place without the involvement of a free emitted photon. The process is as follows: After the optical absorption, electron and hole pair is generated in the donor, which subsequently relaxes to their ground states in their respective
![Figure 2.2.1 External quantum efficiency of light emitting diodes in visible [2].](https://thumb-eu.123doks.com/thumbv2/9libnet/5912812.122561/44.892.224.718.191.557/figure-external-quantum-efficiency-light-emitting-diodes-visible.webp)