A Hybrid Reconstruction Algorithm for
Computerized Ionospheric Tomography
E. Yavuz', F. Artkan', 0. Artkan3
'Finansal Teknoloji Hizmetleri A.$., [email protected]
Ziraat Bankas] Gene1 MiidiirlBgil, GMK Bulvan 162, Zemin Kat Ankara, Turkey 'Hacettepe University
Department of Electrical and Electronics Engineering, [email protected] tr Be tepe, Ankara Turkey
4 i l k e n t Universiry
Department of Electrical and Electronics Engineering, [email protected] Bilkent, Ankara Turkey
Abssrract- Computerized Ionospheric Tomography (CIT) is a
method to reconstruct ionospheric electron density images by using the Global Positioning System data collected by the earth based receivers. In this study, Total Electron Content values
obtained from a model based ionosphere and tomographic reconstruction techniques are used together to obtain ionospheric electron density distribution. Algebraic Reconstruction Technique (ART) is one o f the most commonly used reconstruction method in medics1 tomugraphy due to i t s
simplicity in implementation. The performance of A R T is independent of .basis functions nnd very sensitive to the initial state. Total Least Squares (TLS) algorithm assumes no regularization and produces the lowest error for Haar basis for a given Latitude interval. The performance of TLS is improved with the number of receivers. If only one receiver is used, TLS algorithm together with Haar basis functions produces B low computational complexity and has a lower reconstruction error compared to Regularized Least Squares Algorithm. When the estimation by TLS is input as the initial state o f ART, the overah reconstruction error reduces significantly compared to the reconstruction error of ART only or TLS with Haar basis only.
I. INTRODUCT~ON
Computerized Ionospheric Tomography (CIT) is a method to reconstruct ionospheric electron density images by using the Global Positioning System (GPS) data collected by the earrh based receivers.
GPS
satellites transmit W Osimultaneous signals whose frequencies are 3575.42 MHz and 1227.60 MHz. Total Electron Content (TEC) is defined as the number of free electrons
in
a column of unit cross-sectional area [I]. TEC can be obtained from pseudo range and phase values recorded by the GPS receivers. TEC can
also be obtained from model ionosphere density distribution
such as International Reference Ionosphere-95 (IRI-95) model by taking the line integral of elegron density on the path combining the satellite and receiver. In ionospheric
tomography, ionosphere is divided into pixels. Figure 1 is a simplified example of ionospheric tomography system. Given in Figure I ,
NI,
indicates electron density in the pixel, dk indicates the length of ray in the k th pixel. For rheseparameters, k takes a value between 1 and 4, and TEC value
computed at the receiver can b e given as
where d, is an estimate constant and er is the error term. In general, ionosphere electron d e n s q IS modeiled as a linear combination of two dimensional basis functions obtained by the product of the vertical and horizontal basis functions. Most commonly used horizontal basis functions are Legendre polynomials or Fourier polynomials [ 1-31.
The vertical basis functions are usually generated using the
vertical profiles from a selected forward model, such as ]RI-
95 [3]. Computational complexity of these methods is proportional the number of horizontal basis functions, so selection of appropriate number of horizontal basis function is a critical parameter.
In this paper, Total Least Squares (TLS) algorithm [ 5 ] , Algebraic Reconstruction Technique (ART)
141,
Hybrid Reconshuction Algorithm (HRA) which is combination of T t S and ART, and Regularized Least Squares (RLS) arediscussed as a reconstruction algorithms.
Receiver Figure 1. Sample Ionospheric Tomography System
Ionosphere electron density is modelled as the serial -.
-
functions are used. Two dimensional basis functions are
obtained from the vertical basis hnctions and horizontal basis hncrions. Vertical basis functions are generated from the Singular Value Decomposition (SVD) of the electron
density matrix of forward ionosphere model (IRI-95) and horizontal basis functions are modelled from the Haar
wavelets. It is observed that, due to the fact that TLS assumes no regularization, its computational complexity is less than the
RLS,
butRLS
provides a more reliable result according to TLS. To improve the performance of T U , ART i sconsidered instead of the regularization method. Tbe reconstructed electron density profile from TLS is input as the initial state of ART and a Hybrid Reconstruction Algorithm
(HRA)
is obtained. In HRA, although the computational complexity is increased compared to TLSalone due to addition of the A R T algorithm. the
implementation is still simpler and the overall error is lower than using ART or TLS alone.
11. MODEL IONOSPHERE AND BASIS FUNCTIONS
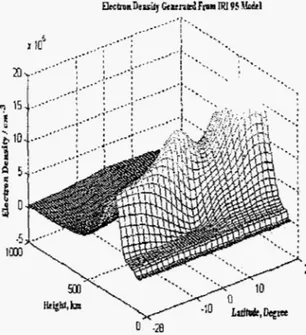
In this paper, IR1-95 is selected as a reference iposphere
model and ionosphere cross-section for [-28 28 ] latitude interval is provided in Figure 2 using the parameter set given in TABLE 1. Vertical basis functions given in Figure 3, are calculated by using the Singular Value Decomposition (SVD). Each vertical profile represents the variations
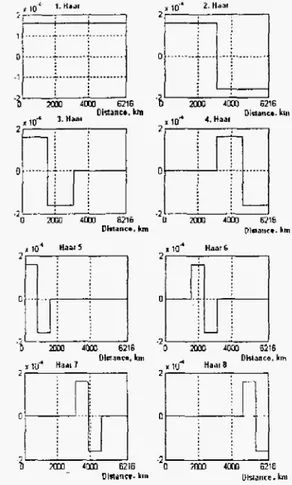
according to height for a fixed latitude. Horizontal basis functions are selected a s Haar basis functions given in Figure 4. Haar basis functions are mapped to [-28' 28-1 latitude interval and x-axis is modelled 3s a distance between -28' and 28' latitudes in which the one degree is equal to I 1 I km.
TABLE I
IRI-95 MODEL PARAMETERS
'
DATE; year, month. dayI
2033, D8. 5In this study, ionosphere is divided into 95 pixels on the vertical direction and 29 pixels on the horizontal direction, Height of each pixel is
IO km,
and the width of each pixel is two degrees. It is assumed that the satellite travels on the flat line for a given latitude interval and the distance between each satellite position is equal to 0.5 degree I r is assumed that the ionosphere I S time invariant for each sareklitepositions and for each TEC calculations and electron density
in each pixel has a uniform distribution.
111. RECONSTRUCTION METHODS
Ionospheric electron density over height-latitude plane given in Figure 2, is expressed as a serial expansion of horizontal and vertical basis functions as given below:
K
(4)
where#k(r.8) is a two dimensional basis hnction and
u , ( r ) is the vertical basis function obtained from IRI-95 model by SVD and v , ( O ) is the horizontal basis function chosen as Haar wavelets. In these expressions, K is number
of total basis hnctions,
M
is number of vertical basis functions andN
is number of horizontal basis functions. r is the height from sea level and it varies between 60 km to 1000km, Height is divided in
ffR
E
95 pixels, each of I D km O is any angle between -28' to 28 latitude. Latitude is divided inNO= 29 pixels each of 2'.
Vertical Basis Furidions
a 6 y I I. , . . . . , ,. .. . , , I
0. '-28
Figure 2 IRI-95 Model Parameters
Heigh( km
nldrnsr. k m Dhtance. km
Figure 4. Haar Basis Functions.
Expression given in (4) is similar to the expression given in ( I ) . In ( I ) , equation is based on the TEC values and the expression given in (4) is based on the ionospheric electron density. Electron density, g(,;B), is given in matrix notation
in (6) and the two dimensional basis function for is also given in the matrix notation in (7).
]
( 6 ) g01.qj:
g(11,%) i...
:
g(q,@@) . . . ....
.
.
..
.
.
.
. .,drxJ$qli
g(rhilE4)
."drNFE&I
++
+
91 92 gho
For simpliciry, the calculations are continued with the given in (8).
vector form of G and
.1
1
In vector g , g(rl.Q1) represents the sample of electron density obtained from IRI-95 model at the height of 1000 km
and the latitude of -25' degree. In CIT, TEC values are computed from
GPS
signals. In this study, TEC calculations are obtained from the scenario discussed in the previous sections using theIR1
model. The measurement TEC vector can be expressedPx4 ( 9 )
1, If ( p , q ) th pixel is on the I th ray. p l , p . q =
i
0, OtherwiseIn (9j, 1 represents the index of ray from the satellite such as Ith ray (or index for satellite position, such as lth satellite position) 2nd d , is the TEC value which is calculated for Ith ray (Ith satellite positiofl. ( 9 ) can be rewritrcn bv using the vector, g
,
as foilowsdl = P 1 . k g ( k ) ,
P i ' k =
i
0,Othenvisek
f , I f ( p , q ) t h p i x c l isonthc I t h ray (IO)
k = p + ( q - I ) M
Equation
(IO)
is given in matrix notation by using the scenario matrix E and the vector g as follow:where d is the vector of TEC value from the measutement
and is equal to d = [dl d 2 d 3 r . . d L ]
. L
= 57 isequal to total number of satellite positions. From rhe
configuration of satellite and receiver positions, the scenario matrix,B
,
is calculated. The number of the columns of rhe scenario matrix is equal to number of pixels in the horizontal direction and the number of the rows of the scenario matrix isequal to number of pix& in the vertical direction. The TEC
calculation procedure is iterated for all satellite positions and elements of B are assigned with respect tu pixel butt g i i w in grid geometry. For the given satellite position, all of the pixels on a satellite ray are determined and the elements of scenario matrix which corresponds to these pixels are assigned one and the other elements of scenario matrix are
assigned zero.
Equaiion ( 5 ) can be written in an inverse problem form as
follows
k
Measurement equation given in (1 1) can be rewritten in the form of inverse problem by using the (12) as given below.
In ( 1 3 ) , a k is the reconstruction coefficient and is
calculated by using the recsnstruction algorithm This TEC calculation method is considered for all two dimensional
basis functions to obtain the basis TEC values. In this step, all
of the W O dimensional basis finclions are assumed to be sub-
ionosphere models, so the measurement equations from the basis TEC and the ionosphere TEC can b e written in the form of (14) as
any errors in the problem are in d which is projected onto the range of to find the solution.
By
the assumption, any changes needed to find a soluiion must come by modifying only d However, in ionospheric tomography problem,P
is determined from the model TEC values, and may also have errors. Thus, it may be of use to find a sohtion to the problem given in (16) which allows for the fact that both Pand d may b e in error. Problems o f this sort are known as TLS problems.
In TLS problem, d and P are augumented with possible error vectors and matrices, respectively. and the solution of the perturbed equation
( d + e ) = ( P + E ) a (17) is investigated. Generally in applications of TLS, the number of equations exceeds the number of unknowns.
However, TLS may also b e applied to the problems in which
the number of unknowns are more than the number of equations. In this case, an infinite solution set exists and the TLS solution method points the one with the minimum nom.
The closed-form TLS solution is given by the fol!owing QTLS
= ( P H P - a ? + ,
1)''P" d (1 8 )where P , . ~ is the vector contains the TEC values obtained from the k th two dimensional basis functions for the I th satellite position. Each P , , ~ can be written in the form of
where 6:+, is the smallest non-zero singular value of the
matrix
C
= [P/d],
H represents Hermitian Transpose, andI
is the identity matrix [ 5 ] , [ 6 ] , [TI,[XI,
[Y].
In P , , ~ , TEC!,k=, represents the obtained TEC value fromthe firsf M'O dimeflsional basis hnction for the I th satellite position. The equation given in (14) is similar to ( I ) . Each
row O f FqUatiOnS in (1) and (14) are based on the TEC values. Equation (14) can be written in the matrix notation in ( I 6)
and the inverse problem equaiion for ionosphere tomography is obtained:
where
In [XI, it is shown that when
P
has full column rank, the TLS solution i s related to the right singular vector V,,+b ofc
associated with the smallest singular value o n V l under the condition [hat ihe singuldr \alucHereo, represents the n th largest singular value and v , + ~ . ~ + , is the last component of the singular vector V n + l . Let
c+l=[vf+l
v ~ + ~ , ~ + I3
where thecf+l
is sub- ionospheric tomography, it is desired lo find anby using the reconstruction
vector that contains the first N elements of Vn+l
.
By using the V,,,-
and v ~ + ~ , , + ! , the TLS solution for the full-rank optimum coefficient set aa!gorithms. In the following, the method of determining a
with the
TLS
is discussed. ART is also examined to find system is(20)
reconsmicred image of ionosphere eIectron density.
1
/.
-
a,,,
=--
"
n + ly n + j ,"+I
A. Total Leusr Squares
(TLS)
AlgorilhniIn the 1east-square.s problem, the solution for (16) is obtained with the assumption that the matrix P is correct, and
For rank-deficient systems and hence underdetermined systems, the TLS solution can be given as follows
where
i = r + l
where
B
o P >up+t
=...=
U"+, =O and V i =E
v
v
r , n + l .are singular values and singular vector of C, respectively. From the previous discussion, TLS solution can be obtained with the SVD of
c
151, [ 6 ] , [TI, [SI, [9]..4. Algebraic Reconsrniction Technique {ART) B.
Hybrid Reconstruction Algorithm (HRA)
From this geometry, TEC value for the ray can be written
TLS output can be written by using the a~~~ coefficients in the form given below:
in the equation given in ( I 2) as follows (22)
The reconstructed image obtained from (28) is used as the initial state of ART
where upper bound for i Is equal to number of satellite
position in interval of
1-2s"
28'1 latitude.w,,
i s the weight S O ' i T L S (29) coefficient for the I I I th pixel. In Equation (22), l i l t , , , and g,are Same as [he dL and
N~
given in (1).ne
measurement equation system for the algebraic reconstruction technique can be obtained by using (22).and then the reconstruction is performed with the ART given in (24) to ( 2 6 ) .
IV. RESULTS
The
solution
is calculated for the set of equations obtained by using rhe (22), but the initial value is needed asIn ionospheric tomography, iterative solution algorithm can be Liven as follows
This algorithm can also b e expressed in a slightly different
farm:
The optimum number of basis functions is an important parameter in performance of the reconstruction algorirhms. Reconstntction error can b e defined as
where G is electron density matrix obtained from
1RI-95
mode! for [-28' 28'1 latitude interval, and G is the reconstructed electron density matrix. The error with respecl
IO the number of hurizonlal basis runstion Vur TI-S .il;ui-itlii>i
is given in Figure 5 for Haar Wavelets as horizontal basis functions. As can be observed from Figure 5, the optimum number of horizontal basis functions for TLS algorithm is determined as the point where error drops to a value-where increasing the number of basis functions do not reduce the error further. In TABLE 11, the error norm, E (Nop, 3), for
TLS with Haar and RLS with Cut- Legendre which is generated from the Legendre polynomial for the given -. ~
number of horizontal basis hnclions. As seen from the
TABLE 11, performance of RLS with Cut-Legendre is better than from the error of TLS with Haar, but the number of horizontal basis functions in
TLS
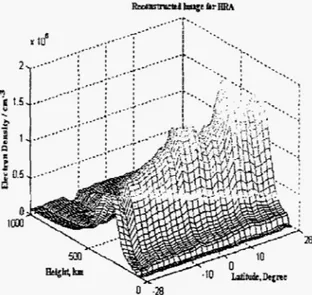
is lower than the number of horizontal basis functions in RLS, so the computational complexity is less in TLS. ART algorithm is independent of basis functions, so the computational complexity is important. In TABLE 111, reconstmction error obtained with the ART alone and that of HRA are given. With the new approach, the performance o f TLS is improved and the reconstruction error is comparable to that of usingRLS
algorithm alone. In
HRA,
the computational complexity is increased due to addition of the ART algorithm. Yet, implementation of ART is still simpler than that of RLS. The reconstructed image for HRA algorithm is given in Figure 6 .TLS
+
HaarFigure 5. Error Variations for Haar Basis Functions in TLS
RLS + Cul- Legendre Functions
c (.top. 3)
I
0.1823i
0.1798TABLE 111
ERROR NORM FOR RECONSTRUCTION ALGORITHMS
1
TLS+Haar1
ART1
HRTE (.\lop. 3)
I
0.18231
0.2279I
0.1798Figure 6 . Reconstructed Image for HRA
V. CONCLUSlON
In this study, TLS algorithm with Waar basis function and
ART algorithm is investigated for ionospheric tomography. TLS algorithm as used by itself, assumes no regularization and produces the Iowest error for Waar basis for the given latitude interval. ART aIgorithm is independent of basis
functions and very sensitive to the initial state. When the estimation by TLS is input as the initial state of ART, the
overall reconstruction error reduces significantly compared to the reconstruction error of ART only or TLS with Haar basis only. The overall error for this scenario is comparable to using Regularized Least Squares algorithm together with Cut Legendre basis. Since the proposed method does nor include any regularization, it is more efficient in implementation.
VI. REFERENCES
[ I ] R. A . Jeffrey, I. F Steven., C. H. Liu, "Ionospheric Imaging Using
Computerized Tomography", Radio Science. vol. 23, no. 3, pp. 299- 307, May/June 1988.
E. Calais, J. B. Minster, "GPS. Earthquakes, The Ionosphere and the Space Shuttle", Physics Of The Earth orld Plrrnelary hreriorr. vol. 105. pp. 167-181, 1998.
E. Sutlon, H Na, "High Resolution Ionospheric Tomography Through Orthogonal Decomposition", Proceedings 01 ICIP-94.. IEEE
InrernmionalConference, ,vol. 2, pp. 148-152, 13-16Nov. 1994. A. C. Kak, M. Slaney, Principles of Compu:eri:ed Tomographic Imuginn, IEEE Press, 1986.
G. H. Golub, P. C. Hansen, D. P. O'Lcary, "Tikhonov regulanzation and total least squares", S I A M J . Ma/rir A d A&,, vol. 21. pp. 185- 194.2000.
W. Zhu. Y . Wang and J. Zhang, " Total-Least Squares Recontmction with Wavclels for Optical Tomography", J. Opr. Soc. Am. A. vol. 15. no. IO, Oc:. 1998.
W. Zhu, Y. Wung, I. Zhang, J. Chang, H. L. Graber and R. I. Barbour, Y . Wang and J, Zhang. " Iterative Total Least Squares Image
Reconstruction Algorithm for Optical Tomography by The Conjugare Gradient Algorithm", J. Opt. Soc. Am. A. ~ 0 1 . 1 4 , no. 4, Apr. 1997.
G . H. Golub and C. F: Van Loan, " Analysis o f the Total Least Squares
Problem ", SIAM J. M d h A n d , ~01.17. p p 883-893. 1980.
T. K. Moon, W. C. Stirling, Mo/hm"iccr/ Me/hodr andAlgorilhmsfor
Signal Processing, prentice Hall, 2000.
[ZJ [3] [4] [5J [ 6 ] [7] [SI [9] *. - -