Position-invariant surface recognition and
localization using infrared sensors
Billur Barshan Tayfun Aytac¸ Bilkent University
Department of Electrical Engineering TR-06800 Bilkent, Ankara, Turkey E-mail: [email protected]
Abstract. Low-cost infrared emitters and detectors are used for the rec-ognition of surfaces with different properties in a location-invariant man-ner. The intensity readings obtained with such devices are highly depen-dent on the location and properties of the surface in a way that cannot be represented in a simple manner, complicating the recognition and local-ization process. We propose the use of angular intensity scans and present an algorithm to process them. This approach can distinguish different surfaces independently of their positions. Once the surface is identified, its position can also be estimated. The method is verified ex-perimentally with the surfaces aluminum, white painted wall, brown kraft paper, and polystyrene foam packaging material. A correct differentiation rate of 87% is achieved, and the surfaces are localized within absolute range and azimuth errors of 1.2 cm and 1.0 deg, respectively. The method demonstrated shows that simple infrared sensors, when coupled with appropriate processing, can be used to extract a significantly greater amount of information than they are commonly employed for. ©2003 Society of Photo-Optical Instrumentation Engineers.
[DOI: 10.1117/1.1621005]
Subject terms: pattern recognition and feature extraction; surface recognition; po-sition estimation; infrared sensors; optical sensing.
Paper 030092 received Feb. 20, 2003; revised manuscript received May 27, 2003; accepted for publication May 28, 2003.
1 Introduction
In this work, we consider the use of a simple infrared sens-ing system consistsens-ing of one emitter and one detector, for the purpose of surface recognition and localization. This paper complements earlier work where we considered the differentiation and localization of objects with different ge-ometries such as plane, corner, edge, and cylinder.1,2Both tasks are of considerable interest for intelligent systems where there is need to distinguish objects for autonomous operation.
Infrared sensors are inexpensive, practical, and widely available. The emitted light is reflected from the surface, and its intensity is measured at the detector. However, it is often not possible to make reliable distance estimates based on the value of a single intensity return, because the return depends on both the surface and other properties of the reflecting object. Likewise, the properties of the surface cannot be deduced from simple intensity returns without knowing its distance and angular location. In this paper, we propose a scanning technique and algorithm that can distin-guish surfaces in a manner that is invariant to their location. Once the properties of a surface are determined, its position (r,) can also be estimated. Our results show that by prop-erly processing data obtained from simple infrared sensors, it is possible to extract a significantly greater amount of information than such devices are commonly employed for. The method we propose is scalable in the sense that the accuracy can be increased by increasing the number of ref-erence scans without increasing the computational com-plexity of the differentiation and localization process.
Most work on pattern recognition involving infrared deals with recognition or detection of features or objects in conventional two-dimensional images. Examples of appli-cations include face identification, automatic target recog-nition, target tracking, automatic vehicle detection, remote sensing, detection and identification of targets in back-ground clutter, and automated terrain analysis. We note that the position-invariant recognition and position estimation reported in this paper are different from such operations performed on conventional images3 in that here we work not on direct ‘‘photographic’’ images obtained by some kind of imaging system, but rather on angular intensity scans obtained by rotating a point sensor. What we differ-entiate are not patterns in a two-dimensional image whose coordinates we try to determine, but rather different kinds of surfaces, whose position with respect to the sensing sys-tem we need to estimate. Thus position-invariant differen-tiation and localization is achieved with an approach quite different than those employed in invariant pattern recogni-tion and localizarecogni-tion in convenrecogni-tional images.4 –9
Infrared sensors are used in robotics and automation, process control, remote sensing, and safety and security systems. More specifically, they have been used in simple object and proximity detection,10 counting,11 distance and depth monitoring,12 floor sensing, position control,13 and obstacle and collision avoidance.14Infrared sensors are also used in door detection and mapping of openings in walls,15 as well as monitoring doors and windows of buildings and vehicles, and light curtains for protecting an area. In Ref. 16, the properties of a planar surface at a known distance
have been determined using the Phong illumination model,17and using this information, the infrared sensor em-ployed has been modeled as an accurate rangefinder for surfaces at short ranges. References 18 –20 deal with opti-cal determination of depth information. Reference 21 de-scribes a passive infrared sensing system that identifies the locations of the people in a room. Infrared sensors have also been used for automated sorting of waste objects made of different materials.22,23 However, to the best of our knowledge, no attempt has been made to simultaneously differentiate and estimate the position of several kinds of surfaces using a small number of simple, low-cost, point sensors. In this paper, we show that by appropriate process-ing and application of pattern recognition techniques, it is possible to achieve these objectives. Our results show that it is possible to extract a significantly greater amount of information from simple optical sensors than in their usual applications共e.g., the emitter-detector pair employed in this study is marketed as a simple proximity switch兲.
This paper is organized as follows: In Sec. 2, we de-scribe the surface differentiation and localization process. Two alternative approaches are employed, which are dis-cussed in Secs. 2.1 and 2.2. In Sec. 2.3, a description of how saturated scans are processed is given. Section 3 pro-vides experimental verification of the approaches presented in this paper. Concluding remarks are made in the last sec-tion.
2 Surface Recognition and Localization
The infrared sensor24used in this study consists of an emit-ter and detector, works with 20- to 28-V dc input voltage, and provides analog output voltage proportional to the mea-sured intensity. The detector window is covered with an infrared filter to minimize the effect of ambient light on the intensity measurements. Indeed, when the emitter is turned off, the detector reading is essentially zero. The sensitivity of the device can be adjusted with a potentiometer to set the operating range of the system.
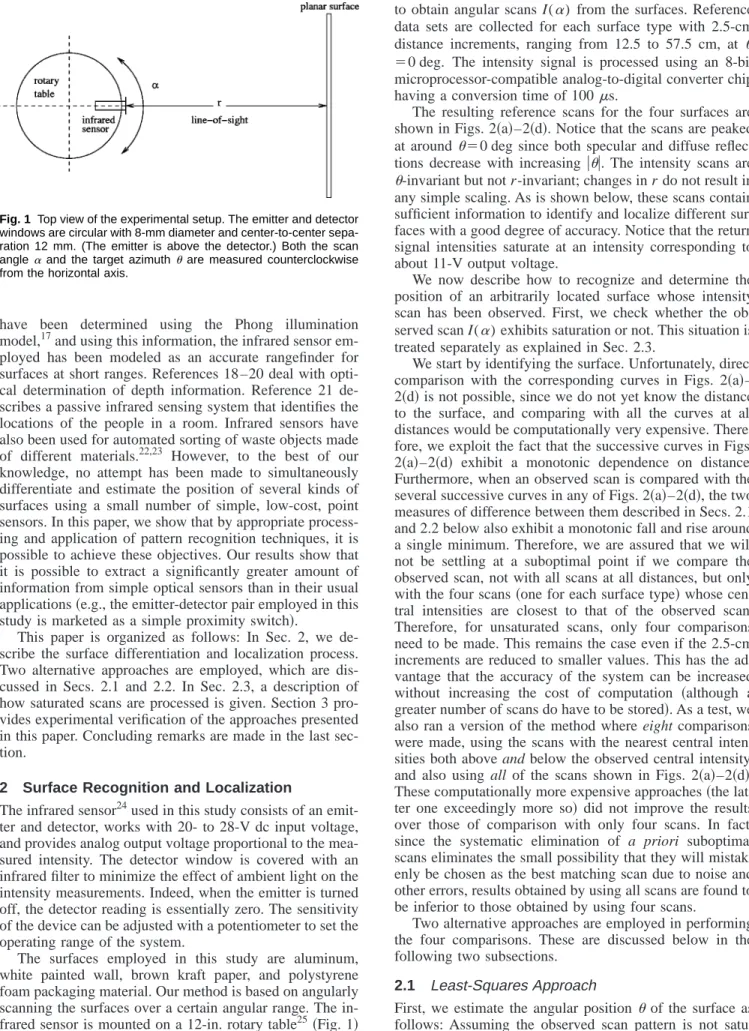
The surfaces employed in this study are aluminum, white painted wall, brown kraft paper, and polystyrene foam packaging material. Our method is based on angularly scanning the surfaces over a certain angular range. The in-frared sensor is mounted on a 12-in. rotary table25共Fig. 1兲
to obtain angular scans I(␣) from the surfaces. Reference data sets are collected for each surface type with 2.5-cm distance increments, ranging from 12.5 to 57.5 cm, at ⫽0 deg. The intensity signal is processed using an 8-bit microprocessor-compatible analog-to-digital converter chip having a conversion time of 100s.
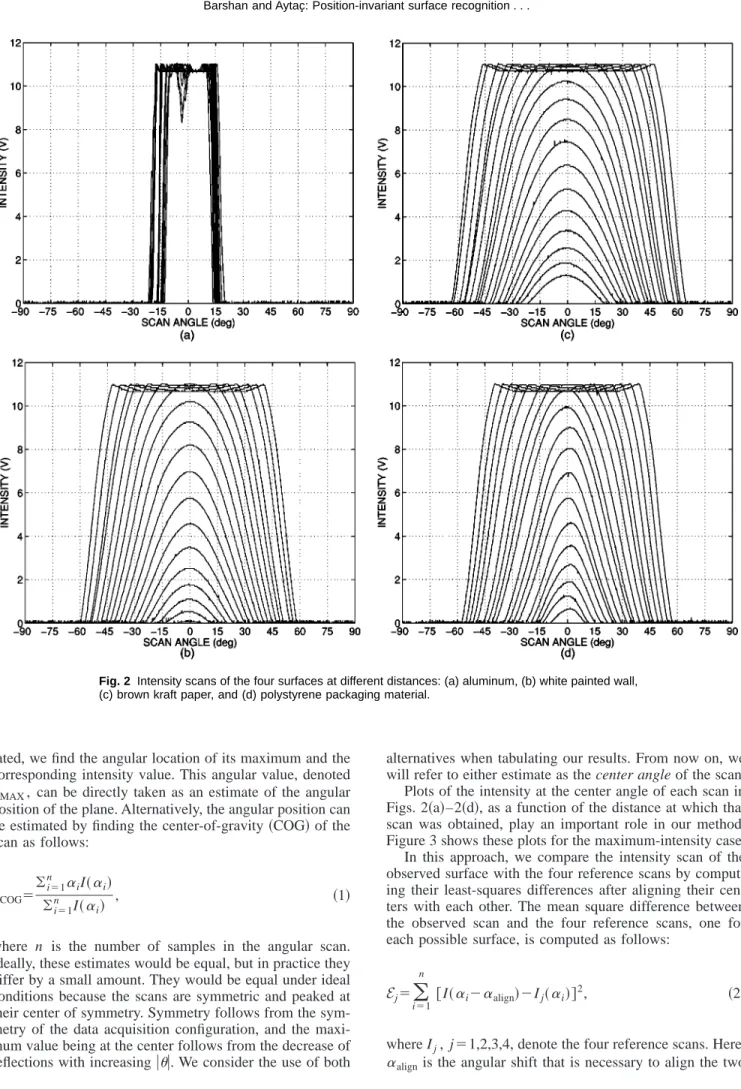
The resulting reference scans for the four surfaces are shown in Figs. 2共a兲–2共d兲. Notice that the scans are peaked at around⫽0 deg since both specular and diffuse reflec-tions decrease with increasing兩兩. The intensity scans are
-invariant but not r-invariant; changes in r do not result in any simple scaling. As is shown below, these scans contain sufficient information to identify and localize different sur-faces with a good degree of accuracy. Notice that the return signal intensities saturate at an intensity corresponding to about 11-V output voltage.
We now describe how to recognize and determine the position of an arbitrarily located surface whose intensity scan has been observed. First, we check whether the ob-served scan I(␣) exhibits saturation or not. This situation is treated separately as explained in Sec. 2.3.
We start by identifying the surface. Unfortunately, direct comparison with the corresponding curves in Figs. 2共a兲– 2共d兲 is not possible, since we do not yet know the distance to the surface, and comparing with all the curves at all distances would be computationally very expensive. There-fore, we exploit the fact that the successive curves in Figs. 2共a兲–2共d兲 exhibit a monotonic dependence on distance. Furthermore, when an observed scan is compared with the several successive curves in any of Figs. 2共a兲–2共d兲, the two measures of difference between them described in Secs. 2.1 and 2.2 below also exhibit a monotonic fall and rise around a single minimum. Therefore, we are assured that we will not be settling at a suboptimal point if we compare the observed scan, not with all scans at all distances, but only with the four scans共one for each surface type兲 whose cen-tral intensities are closest to that of the observed scan. Therefore, for unsaturated scans, only four comparisons need to be made. This remains the case even if the 2.5-cm increments are reduced to smaller values. This has the ad-vantage that the accuracy of the system can be increased without increasing the cost of computation 共although a greater number of scans do have to be stored兲. As a test, we also ran a version of the method where eight comparisons were made, using the scans with the nearest central inten-sities both above and below the observed central intensity, and also using all of the scans shown in Figs. 2共a兲–2共d兲. These computationally more expensive approaches共the lat-ter one exceedingly more so兲 did not improve the results over those of comparison with only four scans. In fact, since the systematic elimination of a priori suboptimal scans eliminates the small possibility that they will mistak-enly be chosen as the best matching scan due to noise and other errors, results obtained by using all scans are found to be inferior to those obtained by using four scans.
Two alternative approaches are employed in performing the four comparisons. These are discussed below in the following two subsections.
2.1 Least-Squares Approach
First, we estimate the angular position of the surface as follows: Assuming the observed scan pattern is not
satu-Fig. 1 Top view of the experimental setup. The emitter and detector
windows are circular with 8-mm diameter and center-to-center sepa-ration 12 mm. (The emitter is above the detector.) Both the scan angle␣ and the target azimuthare measured counterclockwise from the horizontal axis.
rated, we find the angular location of its maximum and the corresponding intensity value. This angular value, denoted
MAX, can be directly taken as an estimate of the angular
position of the plane. Alternatively, the angular position can be estimated by finding the center-of-gravity共COG兲 of the scan as follows: COG⫽ 兺i⫽1 n ␣ iI共␣i兲 兺i⫽1 n I共␣i兲 , 共1兲
where n is the number of samples in the angular scan. Ideally, these estimates would be equal, but in practice they differ by a small amount. They would be equal under ideal conditions because the scans are symmetric and peaked at their center of symmetry. Symmetry follows from the sym-metry of the data acquisition configuration, and the maxi-mum value being at the center follows from the decrease of reflections with increasing兩兩. We consider the use of both
alternatives when tabulating our results. From now on, we will refer to either estimate as the center angle of the scan. Plots of the intensity at the center angle of each scan in Figs. 2共a兲–2共d兲, as a function of the distance at which that scan was obtained, play an important role in our method. Figure 3 shows these plots for the maximum-intensity case. In this approach, we compare the intensity scan of the observed surface with the four reference scans by comput-ing their least-squares differences after aligncomput-ing their cen-ters with each other. The mean square difference between the observed scan and the four reference scans, one for each possible surface, is computed as follows:
Ej⫽
兺
i⫽1 n
关I共␣i⫺␣align兲⫺Ij共␣i兲兴2, 共2兲 where Ij, j⫽1,2,3,4, denote the four reference scans. Here,
␣alignis the angular shift that is necessary to align the two
Fig. 2 Intensity scans of the four surfaces at different distances: (a) aluminum, (b) white painted wall,
patterns. The reference scan resulting in the smallest value
of E is declared as the observed surface. Once the type of
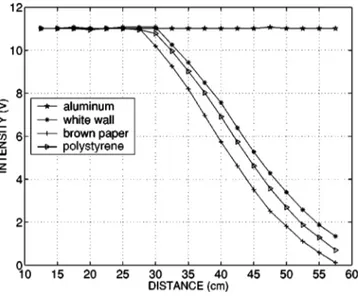
the surface is determined, the range can be estimated by using Fig. 3. We use the set of points associated with the determined surface type and employ linear interpolation be-tween the points at which reference scans are available to determine a distance estimate from the observed intensity value. For instance, if the surface is determined to be a white wall, and the intensity is observed to be 6 V, we use linear interpolation to estimate the distance as approxi-mately 43.5 cm. Note that, this way, the accuracy of the method is not limited by the 2.5-cm spacing used in col-lecting the reference scans.
2.2 Matched Filtering Approach
As an alternative, we have also considered the use of matched filtering26 to compare the observed and reference scans. The output of the matched filter is the cross-correlation between the observed intensity pattern and the
j ’th reference scan normalized by the square root of its
total energy:
yj共l兲⫽兺kI共␣k兲Ij共␣k⫺l兲 兵兺k关Ij共␣k兲兴2其1/2
. 共3兲
The surface corresponding to the maximum cross-correlation peak is declared as the observed surface type, and the angular position of the correlation peak directly provides an estimate of the azimuth angle of the surface. Then, the distance is estimated by using linear interpolation in Fig. 3 with the intensity value at the azimuth estimate.
2.3 Saturated Scans
If saturation is detected in the observed scan, special treat-ment is necessary. In the least-squares approach, the mean square differences between the aligned observed scan and
all the saturated reference scans are computed and the
ref-erence scan with the minimum mean square diffref-erence is chosen. The range estimate of the surface is taken as the distance corresponding to the scan resulting in the
mini-mum mean square difference. Similarly, for the matched filter, correlation between the observed scan and all the stored saturated reference scans is computed, and the refer-ence scan resulting in the highest correlation peak is se-lected. The range estimate is again taken as that of the best-matching scan.
It should be noted that, in the saturated case, range esti-mation accuracy is limited by the 2.5-cm interval at which the reference scans were taken. If this accuracy is not sat-isfactory, it can be improved by reducing the intervals. We underline that the 2.5-cm interval does not limit the range estimation accuracy in the unsaturated case, where accurate interpolation is possible from Fig. 3.
In the unsaturated case, the azimuth could be estimated by taking the angular value corresponding to either the maximum value of the intensity curve or its COG. In the case of saturated scans, a single maximum may not be ob-served, but the COG can still be used to reliably estimate the azimuth. Even when the maximum intensity is used for the unsaturated scans, the COG approach is used for the saturated scans.
3 Experimental Verification and Discussion
In this section, we experimentally verify the proposed method by locating the surfaces at randomly selected dis-tances r and azimuth anglesand collecting a total of 100 test scans. The surfaces are randomly located at ranges from 12.5 to 57.5 cm and azimuths from⫺45 to 45 deg.
The results of least-squares-based surface differentiation are displayed in Tables 1 and 2 in the form of surface confusion matrices. Table 1 gives the results obtained using the maximum intensity values, and Table 2 gives those ob-tained using the intensity value at the COG of the scans.
Fig. 3 Central intensity versus distance for the different surfaces.
Table 1 Surface confusion matrix: least-squares-based recognition
(maximum intensity variation). AL: aluminum; WW: white wall; BP: brown paper; PF: polystyrene foam.
Surface Recognition result Total AL WW BP PF AL 25 — — — 25 WW — 20 3 2 25 BP — 5 17 3 25 PF — — 6 19 25 Total 25 25 26 24 100
Table 2 Surface confusion matrix: least-squares-based recognition
(COG variation). Surface Recognition result Total AL WW BP PF AL 25 — — — 25 WW — 20 3 2 25 BP — 4 18 3 25 PF — — 6 19 25 Total 25 24 27 24 100
The average accuracy over all surface types can be found by summing the correct decisions given along the diagonal of the confusion matrix and dividing this sum by the total number of test trials共100兲. The average correct classifica-tion rates obtained by using the maximum intensity and the COG variations of the least-squares approach are 81% and 82%, respectively.
Matched-filter differentiation results are presented in Table 3. The average accuracy of differentiation over all surfaces is 87%, which is better than that obtained with the least-squares approach. In Ref. 1, where we dealt with the differentiation of targets with different geometries as op-posed to the different surfaces treated here, the least-squares approach resulted in differentiation accuracies of 93% and 89%, and the matched-filtering approach resulted in an accuracy of 97%. Based on these results, we conclude that differentiating targets with different surfaces is consid-erably more difficult than differentiating targets with differ-ent geometries.
As shown in the tables, aluminum is always correctly identified regardless of which method is used, due to its distinctive signature. The remaining surfaces are compa-rable in their correct identification percentages. Brown kraft paper is the surface most confused with others, especially polystyrene foam. Although the intensity scans of these two surfaces do not resemble each other in the unsaturated re-gion, their saturated scans are similar, contributing to the misclassification rate. Nearly all misclassified surfaces are located at nearby ranges where the return signal intensities are saturated. This means that the misclassification rate can be reduced by increasing the lower limit of the range inter-val at the cost of reducing the operating range.
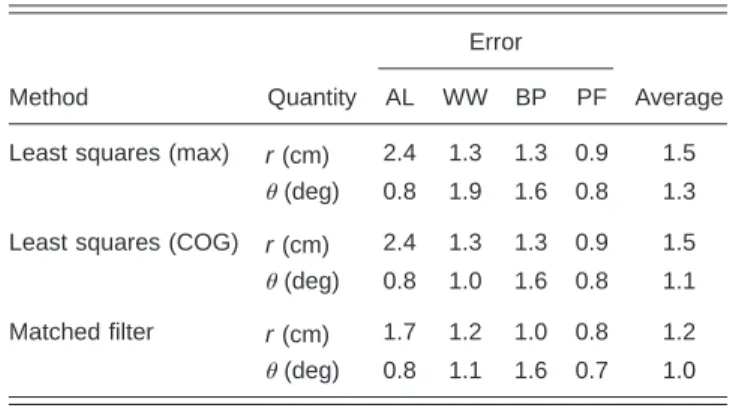
The average absolute range and azimuth estimation er-rors for the different approaches are presented in Table 4 for all surface types. As seen in the table, using the maximum-intensity and COG variations of the least-squares approach, the surface ranges are estimated with av-erage absolute range error of 1.5 cm in both cases. Matched filtering results in an average absolute range error of 1.2 cm, which is better than that obtained with the least-squares approach. The greatest contribution to the range errors comes from surfaces that are incorrectly recognized. If we average over only correctly recognized surfaces, the aver-age absolute range errors become 1.0, 1.1, and 1.2 cm for the maximum intensity and COG variations of least-squares and the matched filter approaches, respectively. Since these three numbers are closer than the corresponding numbers in Table 4, we may conclude that the superior range accuracy
of matched filtering is mostly a consequence of its superior differentiation accuracy.
The major contribution to range errors comes from satu-rated scans, where linear interpolation from Fig. 3 cannot be employed to obtain better range estimates. Conse-quently, surfaces for which saturation occurs over a greater portion of the operating range exhibit greater range estima-tion errors, with aluminum being the worst.
As for azimuth estimation, matched filtering results in an average absolute estimation error of 1.0 deg, which is the best among the approaches compared. Averaging the azi-muth errors over only correctly differentiated surfaces does not result in significant changes. This is because azimuth estimation is not dependent on correct differentiation. The COG variation is, on the average, better than the maximum intensity variation in azimuth estimation, because COG-based calculations average out the noise in the return signal intensities.
We have also considered expanding the range of opera-tion of the system. As an example, changing the operating range from关12.5 cm, 57.5 cm兴 to 关5 cm, 60 cm兴, results in a reduction of the correct differentiation percentage from 87% to 80%. This reduction in performance is mostly a consequence of highly saturated scans and scans with very low intensities, both of which are prone to greater errors.
Light reflected from a surface consists of specular and diffuse components. The specular component is concen-trated where the reflection angle equals the incidence angle, whereas the diffuse component is spread in all directions with a cosine factor. For different types of surfaces, the contribution of these two components and the rate of de-crease of intensity with the scan angle ␣ is different. It is this difference which results in a characteristic intensity scan pattern 共signature兲 for each surface, enabling us to distinguish them without knowing their positions. In con-trast, a system relying only on reflected energy could not distinguish between a highly reflecting distant object and a less reflecting nearby one. Occasionally, two very distinct surfaces may have intensity scans with very similar depen-dence on␣, in which case they cannot be reliably differen-tiated with the present method.
4 Conclusion
In this study, differentiation and localization of four types of surfaces is achieved using an inexpensive infrared emitter-and-detector pair. Different approaches are
com-Table 4 Absolute range and azimuth estimation errors for all sur-faces.
Method Quantity
Error
Average
AL WW BP PF
Least squares (max) r(cm) 2.4 1.3 1.3 0.9 1.5
(deg) 0.8 1.9 1.6 0.8 1.3
Least squares (COG) r(cm) 2.4 1.3 1.3 0.9 1.5
(deg) 0.8 1.0 1.6 0.8 1.1
Matched filter r(cm) 1.7 1.2 1.0 0.8 1.2
(deg) 0.8 1.1 1.6 0.7 1.0
Table 3 Surface confusion matrix: matched-filter-based recognition.
Surface Recognition result Total AL WW BP PF AL 25 — — — 25 WW — 21 3 1 25 BP — 1 21 3 25 PF — — 5 20 25 Total 25 22 29 24 100
pared with respect to correct differentiation and to range and azimuth estimation accuracy. One advantage of our system is that it does not greatly depend on environmental conditions, since we employ an active sensing modality. A typical use of the demonstrated system would be in mobile robotics in surveying an unknown environment composed of several different types of surfaces, or in industrial appli-cations where different materials must be identified and separated.
The main accomplishment of this study is that even though the intensity patterns are highly dependent on sur-face location and properties, and this dependence cannot be represented by a simple relationship, we achieve position-invariant differentiation of different types of surfaces. A correct differentiation rate of 87% over all surface types is achieved, and surfaces are localized within absolute range and azimuth errors of 1.2 cm and 1.0 deg, respectively. The method we propose is scalable in the sense that the accu-racy can be increased by increasing the number of refer-ence scans without increasing the computational cost.
In earlier work, we had considered differentiation and localization of objects having different geometries such as plane, corner, edge, and cylinder,1as opposed to the differ-entiation and localization of different surfaces considered in this paper. In that work, 97% correct differentiation was achieved. Comparing this with the 87% correct differentia-tion reported in this paper, we conclude that specular and diffuse reflection characteristics are not as distinctive as geometric reflection characteristics. Current work investi-gates the deduction of both the surface type and the geom-etry of the target from its intensity scan without knowing its location. Preliminary results indicate that the method of the present paper can be applied to this case by treating the combination of a particular geometry and particular surface as a generalized target type.27
Acknowledgments
This research was supported by TU¨ BI˙TAK under BDP and 197E051 grants. The authors would like to thank the De-partment of Engineering Science of the University of Ox-ford for donating the infrared sensors.
References
1. T. Aytac¸ and B. Barshan, ‘‘Differentiation and localization of targets using infrared sensors,’’ Opt. Commun. 210共1–2兲, 25–35 共2002兲. 2. T. Aytac¸ and B. Barshan, ‘‘Rule-based target differentiation and
posi-tion estimaposi-tion based on infrared intensity measurements,’’ Opt. Eng. 42共6兲, 1766–1771 共2003兲.
3. F. T. S. Yu and S. Yin, Eds., Selected Papers on Optical Pattern Recognition, SPIE Optical Engineering Press, Bellingham, WA
共1999兲.
4. D. Casasent and D. Psaltis, ‘‘Scale invariant optical correlation using Mellin transforms,’’ Opt. Commun. 17共1兲, 59–63 共1976兲.
5. M. McDonnell, ‘‘Clarification on use of Mellin transform in optical pattern recognition,’’ Opt. Commun. 25共3兲, 320–322 共1978兲. 6. H. H. Arsenault, Y. N. Hsu, and K. Chalasinska-Macukow,
‘‘Rotation-invariant pattern recognition,’’ Opt. Eng. 23共6兲, 705–709 共1984兲. 7. G. Gheen, ‘‘Design considerations for low-clutter, distortion invariant
correlation filters,’’ Opt. Eng. 29共9兲, 1029–1032 共1990兲.
8. C. Gu, J. Hong, and S. Campbell, ‘‘2-D shift invariant volume holo-graphic correlator,’’ Opt. Commun. 88共4–6兲, 309–314 共1992兲. 9. P. Refregier, ‘‘Optical pattern recognition—optimal trade-off circular
harmonic filters,’’ Opt. Commun. 86共2兲, 113–118 共1991兲.
10. E. Cheung and V. J. Lumelsky, ‘‘Proximity sensing in robot manipu-lator motion planning: system and implementation issues,’’ IEEE Trans. Rob. Autom. 5共6兲, 740–751 共1989兲.
11. A. J. Hand, ‘‘Infrared sensor counts insects,’’ Photonics Spectra 32共11兲, 30–31 共1998兲.
12. H. C. Wikle, S. Kottilingam, R. H. Zee, and B. A. Chin, ‘‘Infrared sensing techniques for penetration depth control of the submerged arc welding process,’’ J. Mater. Process. Technol. 113共1–3兲, 228–233
共2001兲.
13. B. Butkiewicz, ‘‘Position control system with fuzzy microprocessor AL220,’’ Lect. Notes Comput. Sci. 1226, 74 – 81共1997兲.
14. V. J. Lumelsky and E. Cheung, ‘‘Real-time collision avoidance in teleoperated whole-sensitive robot arm manipulators,’’ IEEE Trans. Syst. Man Cybern. 23共1兲, 194–203 共1993兲.
15. A. M. Flynn, ‘‘Combining sonar and infrared sensors for mobile robot navigation,’’ Int. J. Robot. Res. 7共6兲, 5–14 共1988兲.
16. P. M. Novotny and N. J. Ferrier, ‘‘Using infrared sensors and the Phong illumination model to measure distances,’’ in Proc. IEEE Int. Conf. on Robotics and Automation, pp. 1644 –1649, Detroit, MI
共1999兲.
17. B. T. Phong, ‘‘Illumination for computer generated pictures,’’ Com-mun. ACM 18共6兲, 311–317 共1975兲.
18. F. J. Cuevas, M. Servin, and R. Rodriguez-Vera, ‘‘Depth object recov-ery using radial basis functions,’’ Opt. Commun. 163共4–6兲, 270–277
共1999兲.
19. P. Klysubun, G. Indebetouw, T. Kim, and T. C. Poon, ‘‘Accuracy of three-dimensional remote target location using scanning holographic correlation,’’ Opt. Commun. 184共5–6兲, 357–366 共2000兲.
20. J. J. Esteve-Taboada, P. Refregier, J. Garcia, and C. Ferreira, ‘‘Target localization in the three-dimensional space by wavelength mixing,’’ Opt. Commun. 202共1–3兲, 69–79 共2002兲.
21. K. Hashimoto, T. Tsuruta, K. Morinaka, and N. Yoshiike, ‘‘High per-formance human information sensor,’’ Sens. Actuators A 79共1兲, 46–52
共2000兲.
22. P. J. de Groot, G. J. Postma, W. J. Melssen, and L. M. C. Buydens, ‘‘Validation of remote, on-line, near-infrared measurements for the classification of demolition waste,’’ Anal. Chim. Acta 453共1兲, 117– 124共2002兲.
23. D. M. Scott, ‘‘A 2-color near-infrared sensor for sorting recycled plas-tic waste,’’ Meas. Sci. Technol. 6共2兲, 156–159 共1995兲.
24. Matrix Elektronik, ‘‘IRS-U-4A Proximity Switch Datasheet,’’ Kirch-weg 24, CH-5422 Oberehrendingen, Switzerland共1995兲.
25. Arrick Robotics, ‘‘RT-12 Rotary Positioning Table,’’ P.O. Box 1574, Hurst, TX 76053, www.robotics.com/rt12.html共2002兲.
26. J. W. Goodman, Introduction to Fourier Optics, 2nd ed., pp. 246 –249, McGraw-Hill, New York共1996兲.
27. T. Aytac¸, ‘‘Differentiation and localization using infrared sensors,’’ Master’s Thesis, Dept. of Electrical Engineering, Bilkent Univ., An-kara, Turkey共2002兲.
Billur Barshan received BS degrees in both electrical engineering and physics from Bog˘azic¸i University, Istanbul, Turkey, and the MS and PhD degrees in electrical engineering from Yale University, New Ha-ven, Connecticut, in 1986, 1988, and 1991, respectively. Dr. Barshan was a research assistant at Yale University from 1987 to 1991, and a postdoctoral researcher at the Robotics Research Group at University of Oxford, UK, from 1991 to 1993. In 1993, she joined Bilkent University, Ankara, where she is currently a pro-fessor in the Department of Electrical Engineering. Dr. Barshan is the founder of the Robotics and Sensing Laboratory in the same department. She is the recipient of the 1994 Nakamura Prize awarded to the most outstanding paper at the 1993 IEEE/RSJ Intel-ligent Robots and Systems International Conference, the 1998 TU¨ -BI˙TAK Young Investigator Award, and the 1999 Mustafa N. Parlar Foundation Research Award. Dr. Barshan’s current research inter-ests include intelligent sensors, sonar and inertial navigation sys-tems, sensor-based robotics, and multisensor data fusion.
Tayfun Aytac¸ received the BS degree in electrical engineering from Gazi University, Ankara, Turkey, in 2000, and the MS de-gree in electrical engineering from Bilkent University, Ankara, Turkey, in 2002. He is currently working towards the PhD degree in the same subject. His current research interests include intelligent sensing, optical sensing, pattern recognition, sensor data fusion, target differentiation, and sensor-based robotics.